Summary
- BDC fundamentals continue to improve including higher portfolio yields, improved net interest margins, improvements in underlying general economic fundamentals including unemployment rate, labor force participation, consumer consumption and corporate earnings.
- However, I am expecting temporarily lower BDC prices for the reasons discussed in this update including widening of rate spreads and general market volatility driving ‘flight to safety’.
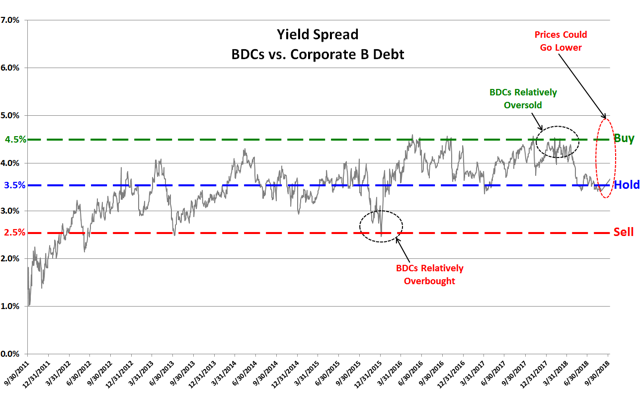
- The current yield spread with Corp B is around 3.7% and could go higher, similar to Q1 2018 closer to 4.5%. I will likely be waiting to make BDC purchases.
- I have recently updated the Deep Dive reports for most of the BDCs considered a ‘Strong Buy’. I suggest reading these reports and being ready to make purchases of BDCs that fit your risk profile.
- As shown in the BDC Google Sheets, the average RSI for BDC’s is almost 32 implying BDCs are oversold.
Interest Rate Spreads:
Please read Investopedia discussion of net interest rate spreads:
“In simple terms, the net interest spread is like a profit margin. The greater the spread, the more profitable the financial institution is likely to be; the lower the spread, the less profitable the institution is likely to be. While the federal funds rate plays a large role in determining the rate at which an institution lends immediate funds, open market activities ultimately shape the rate spread.”
BDC pricing is often volatile which can be a good thing for investors that know what and when to buy. We are finally starting to experience wider interest rate spreads which drives counter-intuitive pricing for BDCs. Management for most BDCs have been patiently waiting for higher yields on new investments which is often driven by wider interest rate spreads. However, the market is now expecting higher yields from investments such as BDCs during a period when the fundamentals are improving.
We have previously experienced windows of wider spreads and higher quality BDCs typically have much higher portfolio growth during these periods as they take advantage of higher market yields. The counter-intuitive pricing refers to: this is usually the time when investors are discounting pricing for BDC stocks. Higher quality BDCs only invest in lower leveraged companies that are able to support debt payments and have strong covenants to protect shareholders during worst-case scenarios.
Also, there have been continued improvements in the underlying economic fundamentals including unemployment rate, labor force participation, consumer consumption and corporate earnings.
Are BDCs Overbought or Oversold?
I closely watch the yield spreads between BDCs and other investments including the ‘BofA Merrill Lynch US Corporate B Index’ (Corp B). Yield spreads are important to monitor as they can indicate when a basket of investments is overbought or oversold compared to other yield-related investments. However, general market yields can change at any time. Also, spreads change depending on perception of risk and these are only averages that then need to be assigned a range for assessing individual investments/BDCs. BDCs can be volatile and timing is everything for investors that want to get the “biggest bang for their buck” but still have a higher quality portfolio that will deliver consistent returns over the long-term.
As you can see, the average BDC yield is currently trending higher:
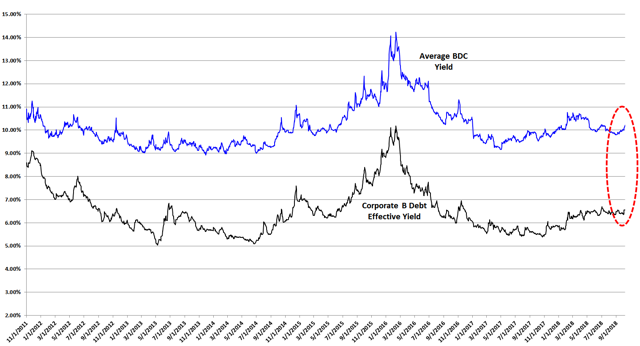
The following chart uses the information from the previous chart showing the average yield spread between BDCs and Corp B. I consider BDCs oversold when the yield spread approaches 4.5% higher and overbought when it is closer to 2.5%.
The average BDC is currently yielding around 10.2% compared to Corp B closer to 6.5% for a current yield spread of 3.7%. However, there is a chance that this spread could increase over the coming weeks implying lower prices for the average BDC.
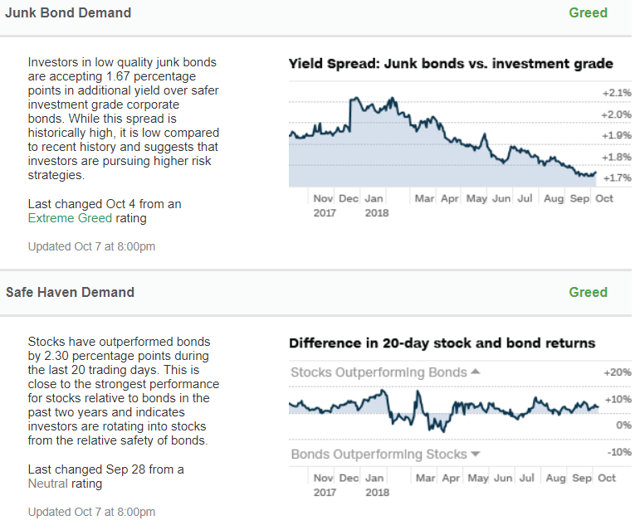
As shown below, the yield spread between junk bonds and safer investment grade corporate bonds is currently lower than previous months but currently headed higher.
“While this spread is historically high, it is low compared to recent history and suggests that investors are pursuing higher risk strategies.”
Improved economic conditions have meant that junk bonds are being perceived as less risky.
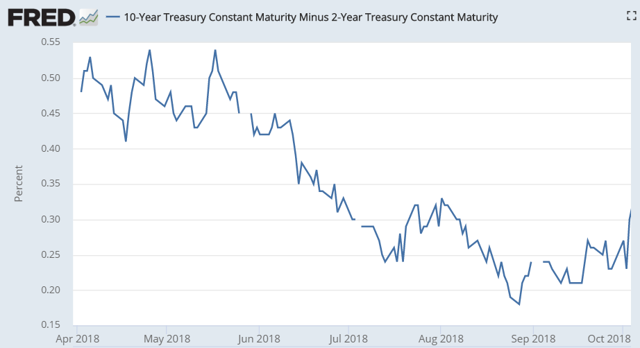
U.S. Treasury Yields:
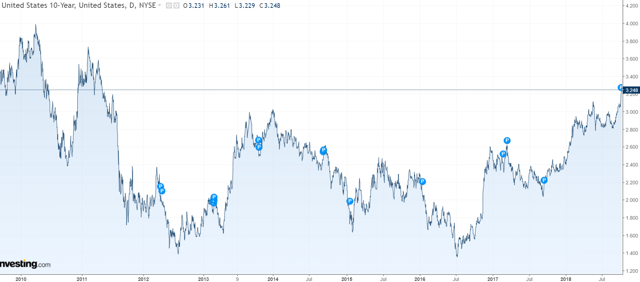
As shown below, the 10-year U.S. treasury yield is now above 3.2% and headed higher in pre-market:
The spread between 10 and 2-year treasuries has finally started to increase:
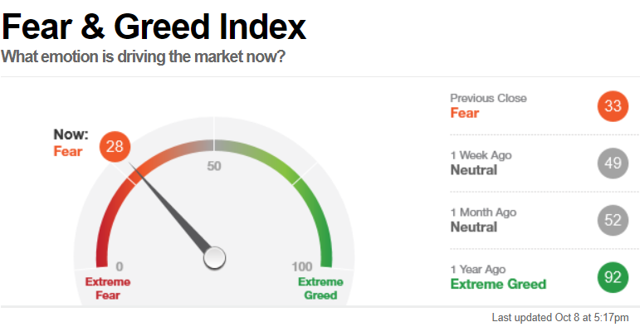
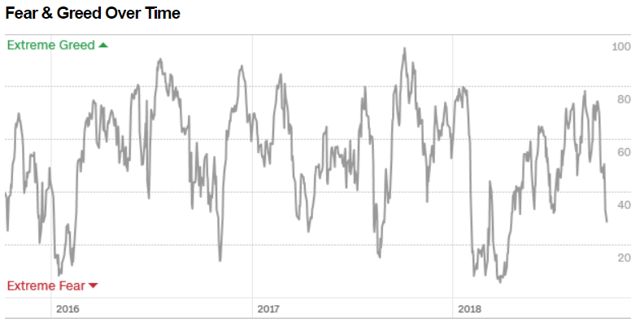
Fear & Greed Index:
The market seems to be headed into ‘fear’ territory:
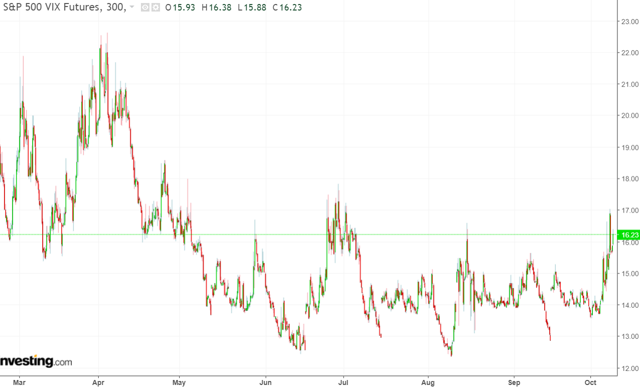
The S&P Volatility Index (“VIX”) futures are headed higher in pre-market:
Thanks, been watching for bargains.
I just added this blog site to my google reader, excellent stuff. Can’t get enough!