Readers may have noticed the recent volatility in pricing for business development companies (“BDCs”). Please see “BDC Market Update: October 9, 2018” that briefly discussed current yield spreads, sector oversold/overbought measures, and recently improved BDC fundamentals including higher portfolio yields, improved net interest margins, improvements in underlying general economic fundamentals including unemployment rate, labor force participation, consumer consumption and corporate earnings.
However, I am expecting temporarily lower BDC prices for the reasons discussed in the update including the widening of rate spreads and general market volatility driving ‘flight to safety’.
As mentioned in 14.5% Yielding ETN: Time To Buy Or Take Profits?:
“The UBS ETRACS Business Development Company ETN (BDCS) and UBS ETRACS 2X Leveraged Business Development Company ETN (BDCL) are exchange traded notes that continue to under-perform the average BDC for a few reasons but mostly related to index allocations and “tracking fees.”
BDCL has declined by over 12% since the article as shown below:
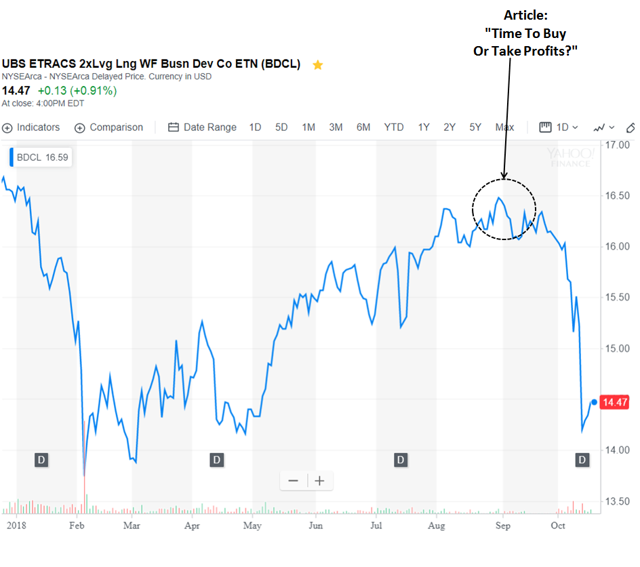
However, BDC pricing has been pulling back and likely for the reasons discussed in the update linked above.
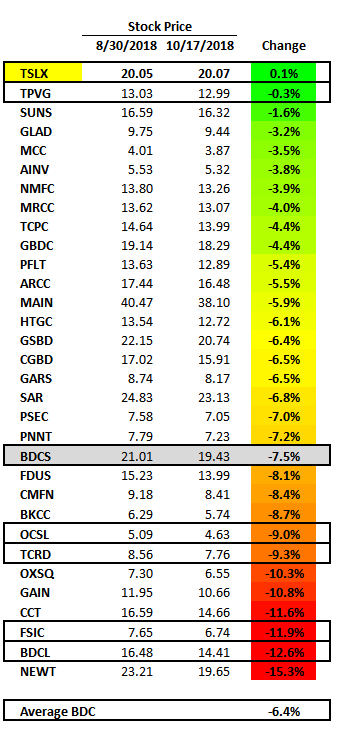
It should be noted that many of the BDCs that I consider to be ‘higher quality’ have outperformed the others during this pullback including TriplePoint Venture Growth (TPVG) discussed last month in “Stable 11% Yield With Pre-IPO VC Tech Exposure For Higher Returns“.
Many of the BDCs that I have warned investors about have been under-performing such as Oaktree Specialty Lending (OCSL) in “High-Yield BDC Sector Return And Expense Ratios” that discussed why the company was overpriced, THL Credit (TCRD) in “13.2% Yield At Risk Of Upcoming Dividend Cut” and FS Investment Corp. (FSIC) discussed last week in “Why I Sold This 11.1% Yielding BDC“.
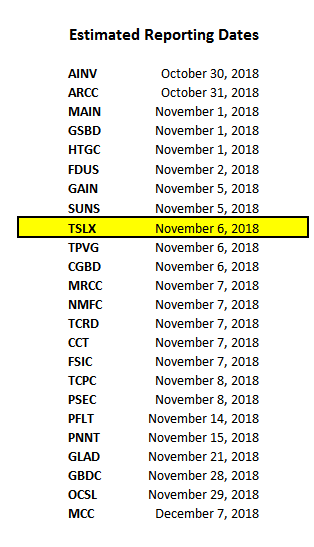
Q3 2018 BDC Reporting
Obviously, timing is important when investing, but especially with BDCs for many reasons, including opaque reporting standards, general sector volatility, and being largely retailed owned. The opaque and inconsistent reporting for BDCs often results in retail investors making poor decisions. Focusing on simple coverage of the dividend with the previous quarter net investment income (“NII”) or changes in net asset value (“NAV”) are not enough.
BDCs will begin reporting calendar Q3 2018 results later this month. Please sign up for Premium Report to receive real-time notifications of changes in risk profile and dividend coverage potential for each company as they report results.