Previous Quick Market Updates:
Relative Strength Index or RSI is an indicator that I use after I already know which BDCs I would like to purchase, but waiting for a good entry point. Please see the definition from Investopedia as well as the discussion of net interest rate spreads
The following is a quick update that was previously provided to subscribers of Premium Reports along with target prices, dividend coverage and risk profile rankings, credit issues, earnings/dividend projections, quality of management, fee agreements, and my personal positions on all business development companies (“BDCs”) please see Deep Dive Reports.
Quick BDC Market Update:
On Wednesday, a series of purchasing managers’ indexes for December mostly showed declines or slowdowns in manufacturing activity, including much of Europe and Asia as the U.S.-led trade war and a slowdown in demand hit production. U.S. activity was a bit slower, but still expanding, in a sign that China has suffered more from trade issues than the U.S.
It is important to note that BDCs mostly invest U.S. companies as they were created by Congress in 1980 “to fuel job growth and assist emerging U.S. businesses in raising funds“. The following chart shows the recent performance for U.S. Financial Select Sector SPDR ETF (XLF) and UBS ETRACS Wells Fargo Business Development Company ETN (BDCS) that have declined around 13% to 14% over the last three months. However, both have started to rebound:
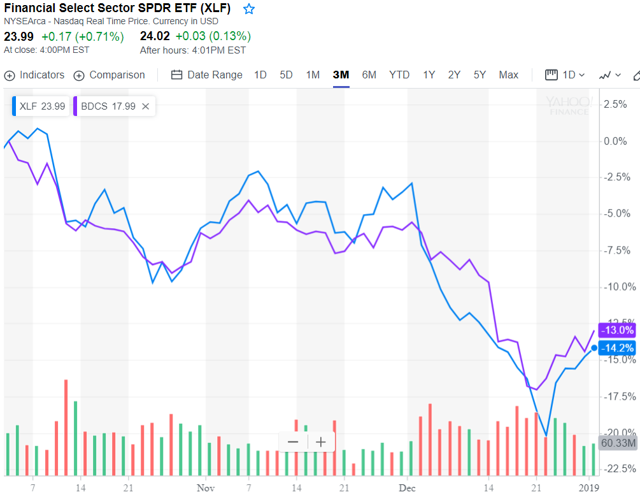
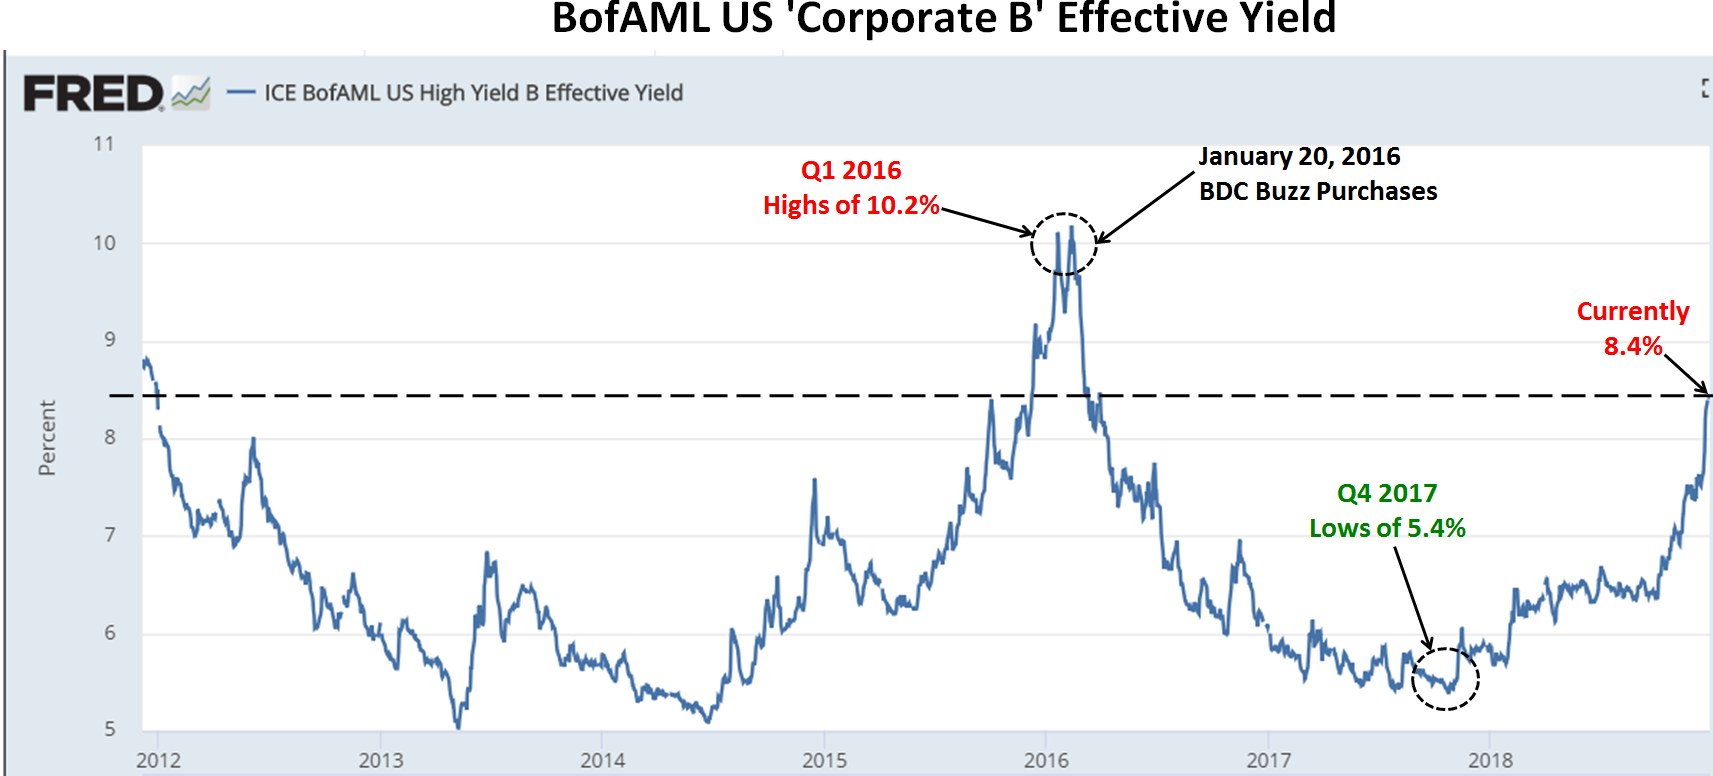
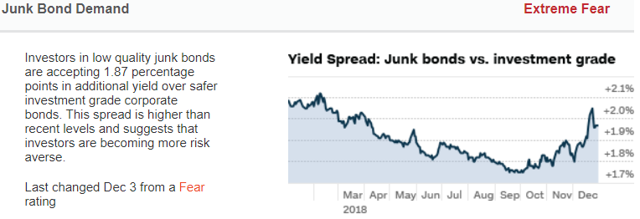
The S&P 500 has declined by over 15% over the last three months for various reasons, some of which are related to BDCs (including a potential economic slowdown), but the underlying fundamentals of the U.S. economy and BDCs remain strong. In January/February 2016, the markets experienced similar concerns including slowing Chinese growth and increased energy sector defaults driving higher yield expectations, especially for non-investment grade debt as shown in the chart below (see Junk bonds suffer a rare negative return in January). This also resulted in wider interest rate spreads and favorable lending conditions. Higher quality BDCs typically have much higher portfolio growth during these periods as they take advantage of higher market yields.
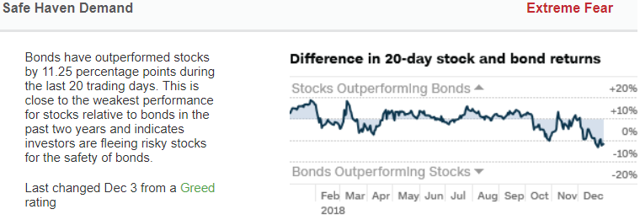
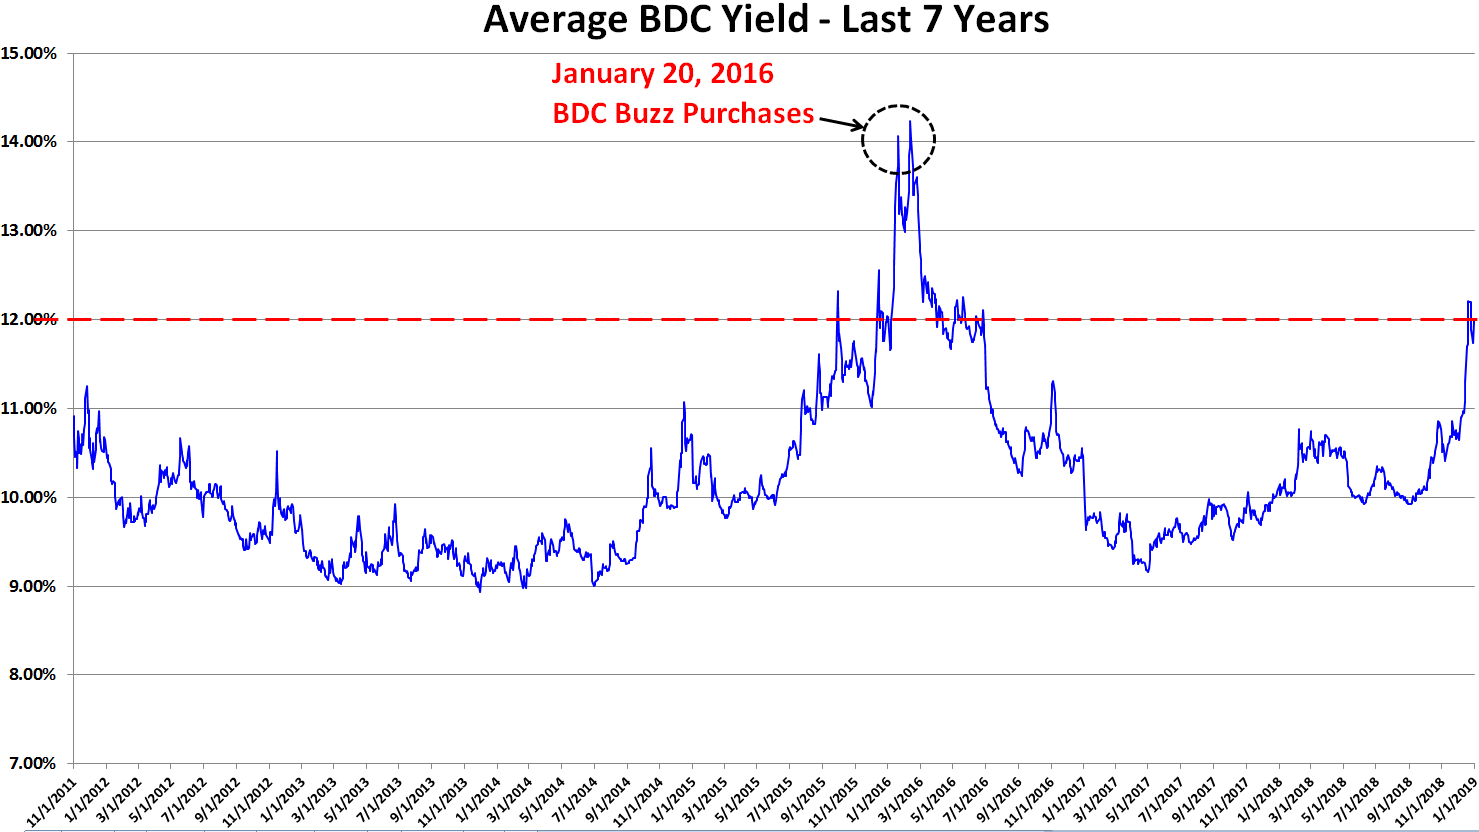
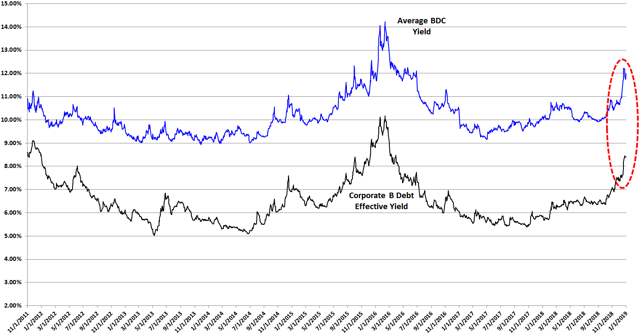
However, this drives counter-intuitive pricing and is usually the time when investors are discounting pricing for BDC stocks, expecting higher yields due to “a flight to safety mode”. The average BDC yield is around 12% which is much higher-than-average over the last seven years:
There is a chance for continued lower BDC prices potentially due to continued flight to safety and retail investor fear-related selling when they should be holding or buying. The following are the three most likely general market scenarios and what I will be doing in each case:
- ‘Dead cat bounce’ where stock prices start to rebound but then continue down. In this scenario, I will be making select purchases and then waiting to make meaningful purchases of many BDCs likely in late January or February.
- Continued market declines through January/February 2019 where I will be waiting for the selling pressures to abate before making multiple purchases.
- A solid round of good news regarding interest rate policy and the economy driving a full rebound toward previous levels where I will be making meaningful purchases on the way back up.
Also, over the coming weeks, I will continue to monitor economic and BDC fundamentals as well as ‘Corp B’ effective yield spreads looking for extreme oversold conditions and:
- Actively purchase additional shares if economic and BDC fundamentals improve driving lower ‘Corp B’ effective yield.
- Hold current positions and wait if economic and BDC fundamentals decline driving higher ‘Corp B’ effective yield.
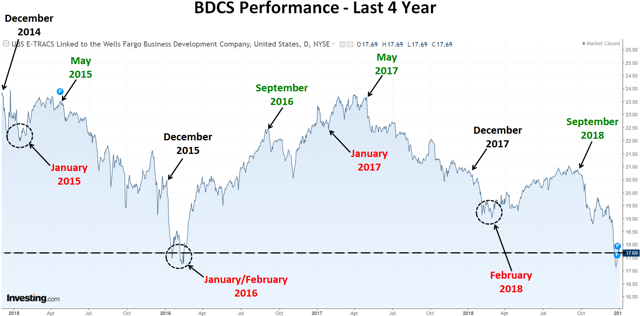
As predicted in previous updates, BDC prices continued lower and as shown in the chart below, “BDCS” is now near the previous lows from January/February 2016. Also shown in the chart, the average BDC stock price typically declines from December through January/February and then rallies through May or September. Clearly, this could be coincidence but BDCs are largely retailed-owned and pricing often does not follow the fundamentals which are strong as most companies are beating expectations, with higher NII/NAV and special dividends. There have been a handful of BDCs reporting new credit issues including MRCC, FSIC, TCRD but I view these idiosyncratic. There is a good chance that I will be holding off on making significant purchases until February 2019 but could make smaller individual purchases over the coming weeks.
Are BDCs Overbought or Oversold?
I closely watch the yield spreads between BDCs and other investments including the ‘BofA Merrill Lynch US Corporate B Index’ (Corp B) that has increased from 6.36% to 8.40% since October 1, 2018. This is meaningful for many reasons but mostly due to indicating higher yields expected by investors for non-investment grade debt that will likely result in higher portfolio yields over the coming quarters as discussed earlier.
Yield spreads are important to monitor as they can indicate when a basket of investments is overbought or oversold compared to other yield-related investments. However, general market yields can change at any time. Also, spreads change depending on the perception of risk and these are only averages that then need to be assigned a range for assessing individual investments/BDCs. BDCs can be volatile and timing is everything for investors that want to get the “biggest bang for their buck” but still have a higher quality portfolio that will deliver consistent returns over the long-term. As you can see, the average BDC yield is still trending higher:
I consider BDCs oversold when the yield spread is 4.0% higher and overbought when it is 3.0% lower.
For BDC target prices, dividend coverage and risk profile rankings, credit issues, earnings/dividend projections, quality of management, fee agreements, and my personal positions on all BDCs please see Premium Reports.