Previous Quick Market Updates:
Relative Strength Index or RSI is an indicator that I use after I already know which BDCs I would like to purchase, but waiting for a good entry point. Please see the definition from Investopedia as well as the discussion of net interest rate spreads
The following is a quick update that was previously provided to subscribers of Premium Reports along with target prices, dividend coverage and risk profile rankings, credit issues, earnings/dividend projections, quality of management, fee agreements, and my personal positions on all business development companies (“BDCs”) please see Deep Dive Reports.
Quick BDC Market Update:
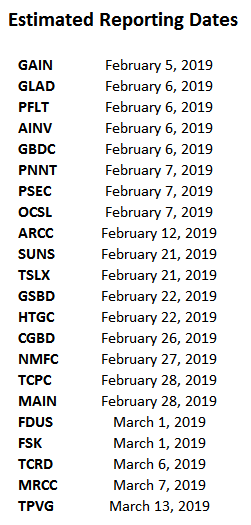
Business Development Companies (“BDCs”) will begin reporting results in less than two weeks, starting with Gladstone Investment (GAIN), and the following article from earlier today discusses some of the items that investors should be watching:
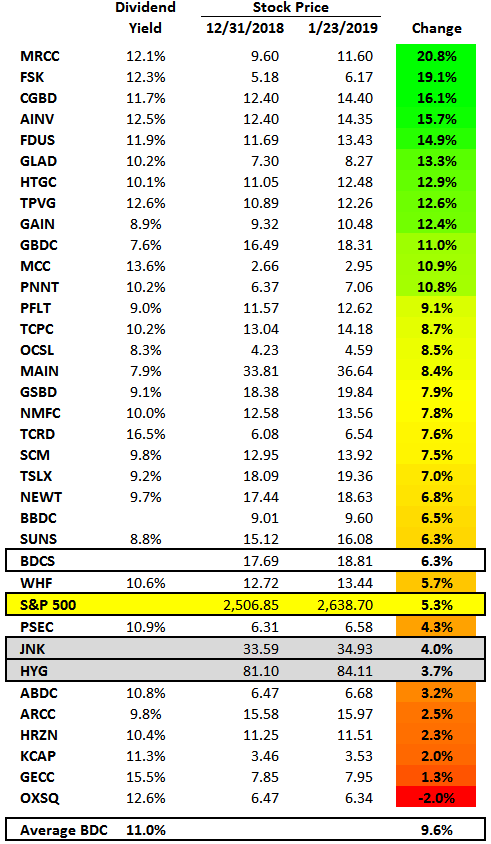
As mentioned in previous updates, in December 2018, I purchased additional shares of multiple higher-quality Business Development Companies (“BDCs”) with risk-averse balance sheets prepared for a potential economic slowdown, including TCG BDC Inc. (CGBD) for the reasons discussed in “I Just Bought More TCG BDC, Which Is About To Rally With A Safe 13% Yield.” As investors jump back into financial stocks, the average BDC has easily outperformed the S&P 500 so far in 2019 but still have an average dividend yield of almost 11%:
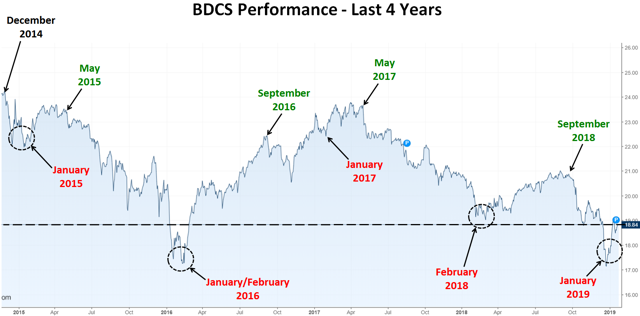
Most BDCs were down sharply on December 31, 2018, likely due to final tax-loss harvesting and/or year-end position changes in various investment funds. As shown in the chart below, “BDCS” has rebounded from the recent lows. During previous years, the average BDC stock price typically declined from December through January/February and then rallied through May/September.
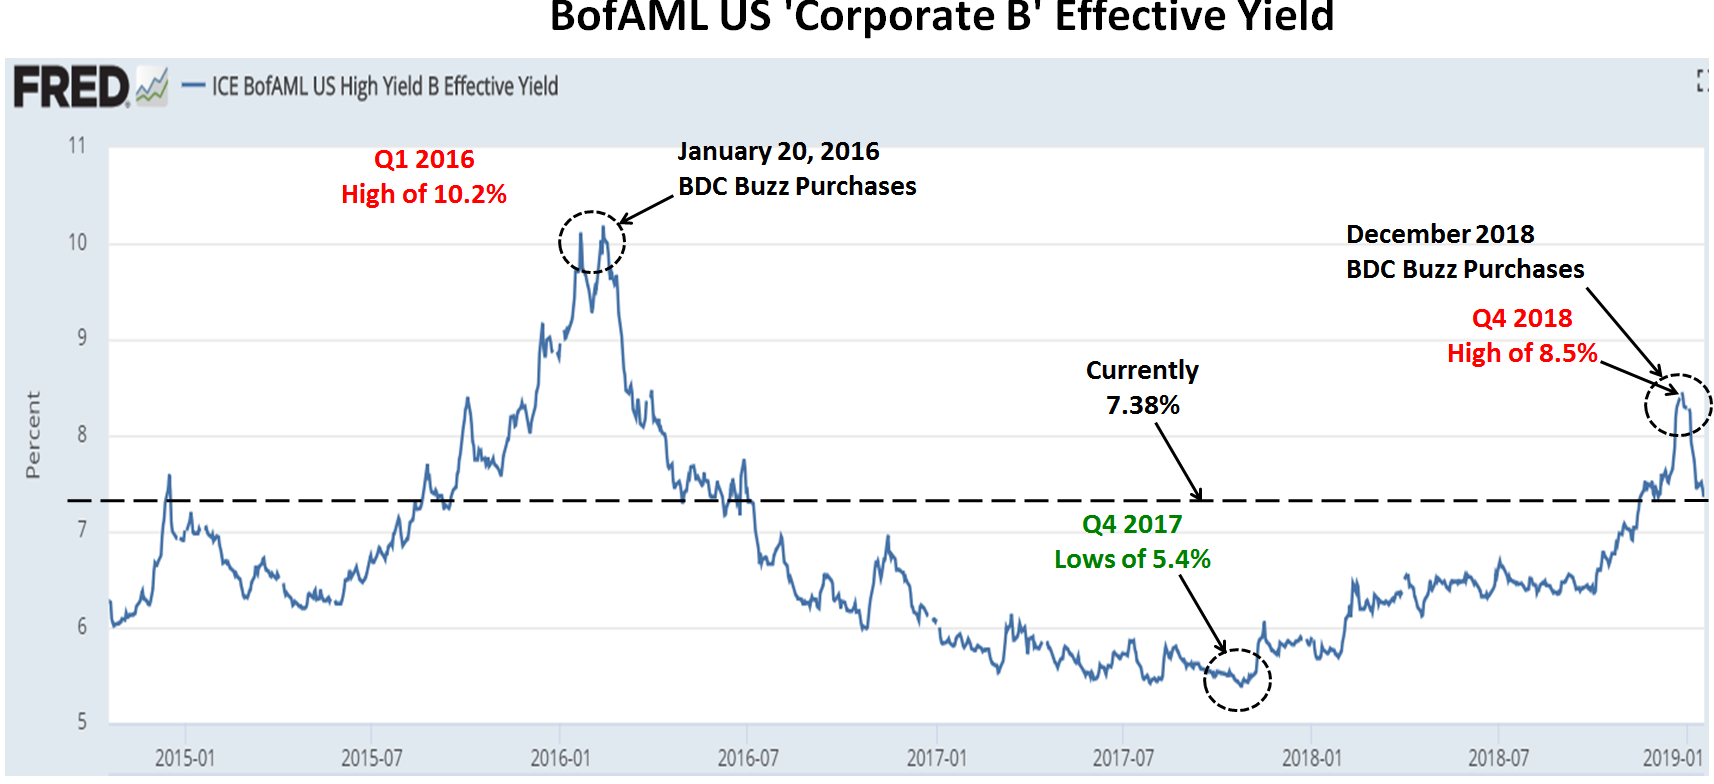
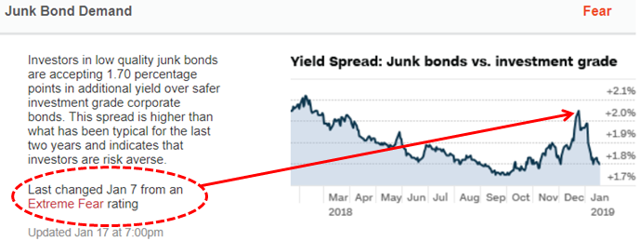
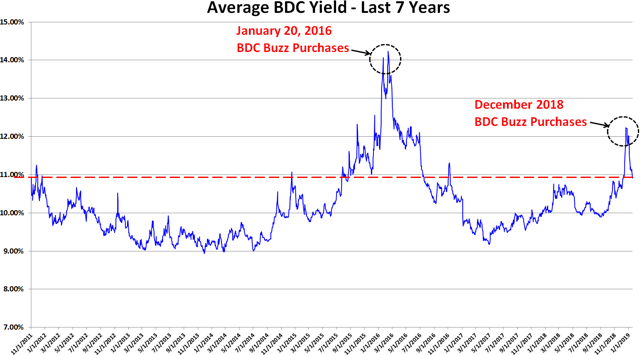
However, it should be pointed out that BDC pricing is closely correlated to yields spreads including other non-investment grade debt and the ‘BofA Merrill Lynch US Corporate B Index’ (Corp B). As shown in the chart below, I typically make multiple purchases when Corp B effective yields rise including January/February 2016, when the markets experienced similar concerns of slowing Chinese growth and increased energy sector defaults driving higher yield expectations, especially for non-investment grade debt (Junk bonds suffer a rare negative return in January). This also resulted in wider interest rate spreads and favorable lending conditions. Higher quality BDCs typically have much higher portfolio growth during these periods as they take advantage of higher market yields. Also shown in the chart below, is the recent pullback in Corp B yields which was driving higher BDC pricing this month.
Higher effective yields result in counter-intuitive pricing and usually the time when investors are discounting pricing for BDC stocks, expecting higher yields due to “a flight to safety mode”. The average BDC yield is around 11% which is higher-than-average over the last seven years:
The S&P 500 is still around 9% below its previous highs for various reasons, some of which are related to BDCs (including a potential economic slowdown), but the underlying fundamentals of the U.S. economy and BDCs remain strong. There is a chance for lower BDC prices potentially due to returned flight to safety and retail investor fear-related selling when they should be holding or buying. I now believe that the following are the two most likely general market scenarios and what I will be doing in each case:
- ‘Dead cat bounce’ where stock prices continue to rebound but then continue back down to previous lows. In this scenario, I will be making select purchases and then waiting to make meaningful purchases of many BDCs likely in late February 2019.
- A solid round of good news regarding interest rate policy, world economy and the end of the government shutdown driving a full rebound toward previous levels where I will be making meaningful purchases on the way back up.
Also, over the coming weeks, I will continue to monitor economic and BDC fundamentals as well as ‘Corp B’ effective yield spreads looking for oversold conditions and:
- Actively purchase additional shares if economic and BDC fundamentals improve driving lower ‘Corp B’ effective yield.
- Hold current positions and wait if economic and BDC fundamentals decline driving higher ‘Corp B’ effective yield.
As discussed in the BDC Risk Profiles Rankings report, most BDCs have built their portfolios and balance sheets in anticipation of a recession with investments supported by high cash flow multiples and protected by covenants and first-lien on assets for worst case scenarios.
For BDC target prices, dividend coverage and risk profile rankings, credit issues, earnings/dividend projections, quality of management, fee agreements, and my personal positions on all BDCs please see Premium Reports.
Hey Buzz, I follow you on SA and was looking into subscribing to your service. I was curious if you could send me an example of the difference between the premium w/google sheets and the other or if you could summarize it I’d be grateful.
You get the exact same content through both platforms but the BDC Google Sheets is automatically included in the Seeking Alpha site (with the BDC Buzz site, it is an extra option that you can choose). Reports are provided in PDF format on the BDC Buzz site with one page that has links to all reports. Also, you get the same amount of email updates each week but the entire report is included with the BDC Buzz site service as well as links to the latest updated reports. Let me know if you have any other questions.