The following information was previously provided to subscribers of Premium BDC Reports along with target prices, dividend coverage and risk profile rankings, earnings/dividend projections, quality of management, fee agreements, and my personal positions for all Business Development Companies (“BDCs”).

BDC Sector ETFs/ETNs
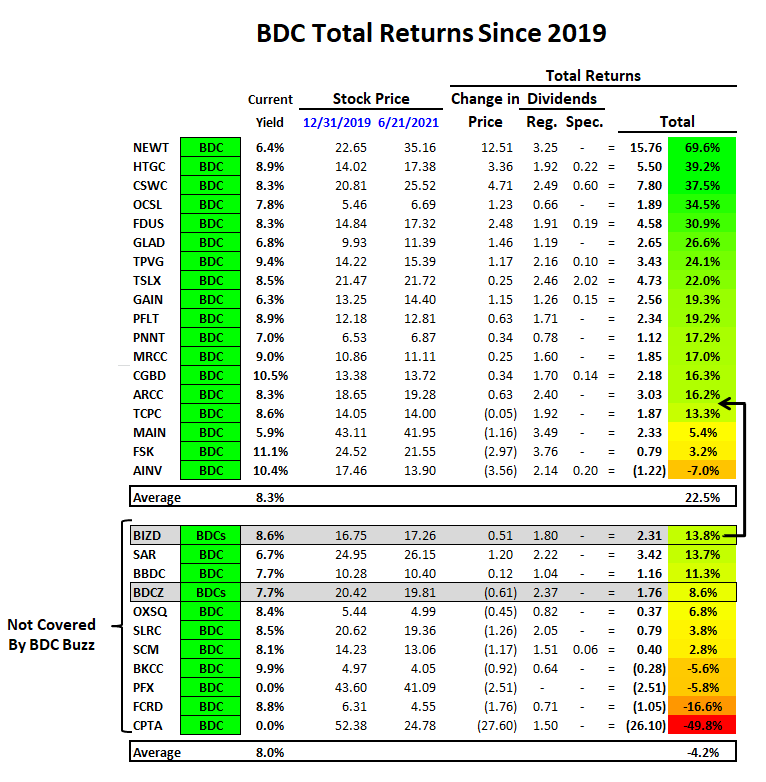
I have recently noticed increased attention to using BIZD and BDCZ as investment vehicles for the BDC sector and I will discuss these in an article titled “The Worst Way to Invest the BDC Sector” later this week.
To start, BDCs are relatively new and a small sector compared to REITs so there are not many companies that provide sufficient trading volumes or market cap to create a quality ETF/ETN. Their allocations are terrible and currently have 11% to 15% in FSK, 5% to 6% in PSEC, and another 30% to 35% in other companies that might be adequate quality but currently overpriced and I would not recommend at these levels. But the worst part is that these investments (BIZD/BDCZ) somehow find a way to underperform not just the average BDC but also their specific allocations which must be due to poor management including fees and ‘adjustments’. I have gone through a quarterly analysis using their exact allocations and not able to tie the results as they are usually lower by around 2% annually.
I’m not a fan of using calendar dates to track BDC returns because most people who invest in this sector take advantage of volatility and no one was buying on December 31, 2019, as BDC prices were near new highs at the time. But it is a way to compare returns over a certain time period and the following tables show how much BIZD/BDCZ have underperformed the average.
It should be noted that FSK, MAIN, and AINV have lower performance for the reasons discussed in previous updates:
- FSK Quick Update: Please Be Careful
- MAIN: Remains on Probation
- AINV Projections: Potential Downgrade
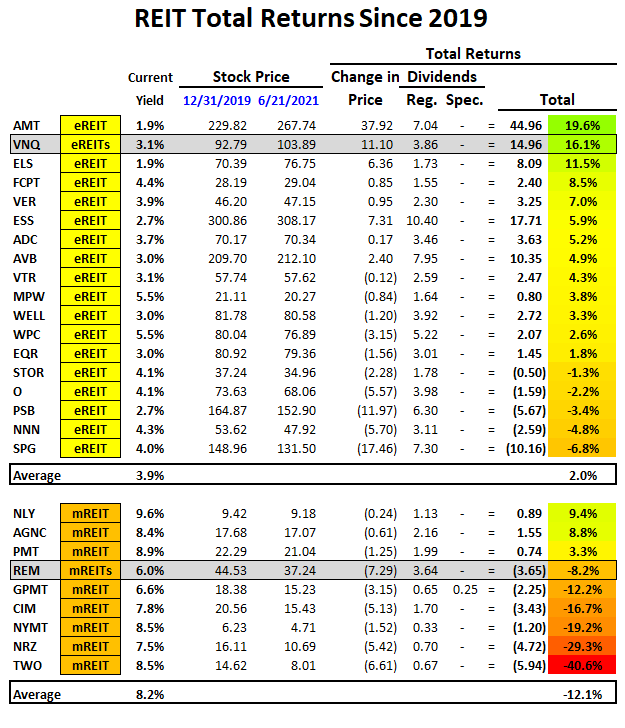
Below are the updated equity and mortgage REIT returns compared to VNQ and REM in the following table which have seriously underperformed the average BDC over the last 18 months.
Full BDC Reports
- Weekly BDC Sector Update – Before the markets open Monday morning we provide quick updates for the sector including significant events for each of the companies that we follow along with upcoming earnings, reporting, and ex-dividend dates. Also, we provide a list of the best-priced opportunities along with oversold/overbought conditions, what to look for in the coming week, and any other meaningful economic events that need to be considered for the sector.
- Deep Dive Projection Reports – Detailed reports on 2 to 3 BDCs per week prioritized by first focusing on potential issues such as dividend coverage and/or portfolio credit quality changes. We look for portfolio updates that might be mentioned in the SEC filings as compared to company announcements. Then, reports are prioritized based on pricing opportunities including equity offerings.
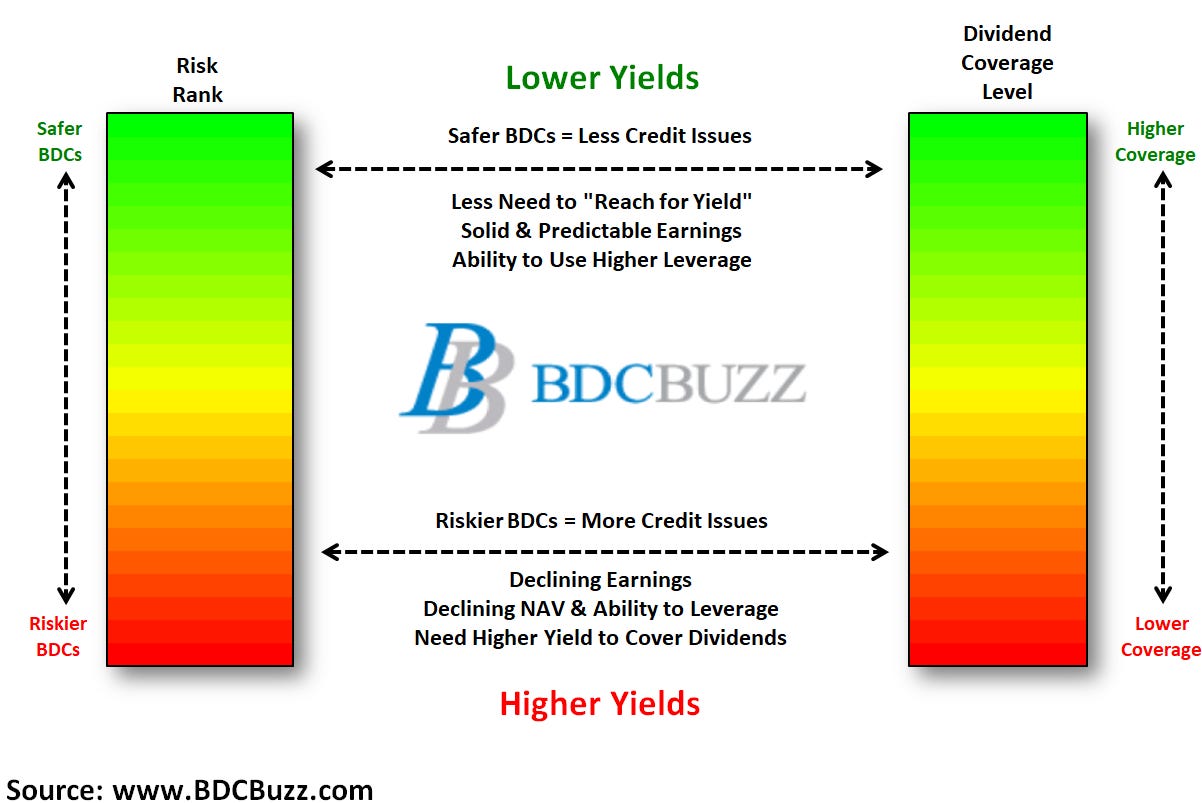
This information was previously made available to subscribers of Premium BDC Reports. BDCs trade within a wide range of multiples driving higher and lower yields mostly related to portfolio credit quality and dividend coverage potential (not necessarily historical coverage). This means investors need to do their due diligence before buying.