The following information was previously provided to subscribers of BDC Buzz Premium Reports along with:
- TSLX target prices, buying points and suggested limit orders (used during market volatility).
- TSLX risk profile, potential credit issues, changes in NAV, and overall rankings. Please see BDC Risk Profiles for additional details.
- TSLX dividend coverage projections (base, best, worst-case scenarios). Please see BDC Dividend Coverage Levels for additional details.


TSLX Quick Update:
- Even if you’re not interested in TSLX, please read this update as it contains many insights and discussion for the BDC sector and plenty of comparisons with other BDCs.
- TSLX is currently a ‘Strong Buy’ with 10% yield before upcoming specials/supplementals (discussed below).
- Please make purchases before the company reports a strong Q4 (also discussed below).
- As shown below, TSLX recently traded below NAV, which triggered share repurchases, as mentioned later.
- Plenty of good news, including pre-payments of its 2 largest investments (over 6% of portfolio), American Achievement improvements, increased fee income, reduced concentration risk, increased NAV per share, etc.
- As we enter an environment of increased recessionary concerns, these reports will focus more on risk profiles, including any changes to ‘watch list’ investments as we have done for TSLX.
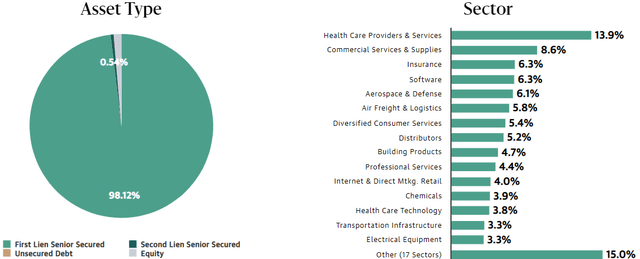
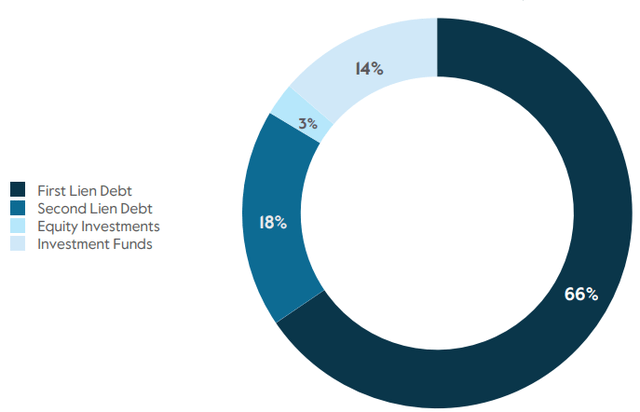
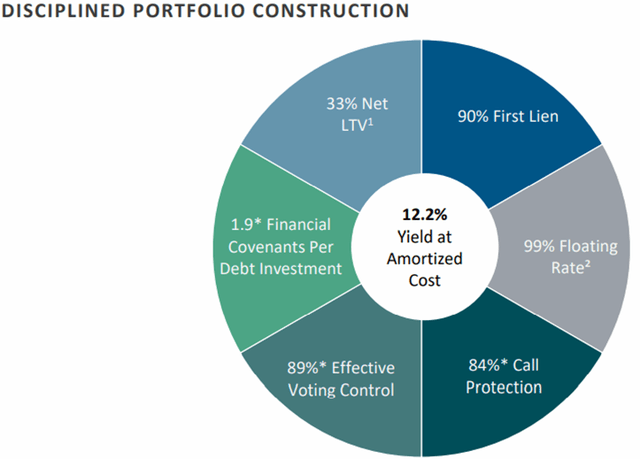
- TSLX’s portfolio is 90% first-lien with an average of 1.9 financial covenants for each debt position, 84% with call protection, and 89% effective voting control.
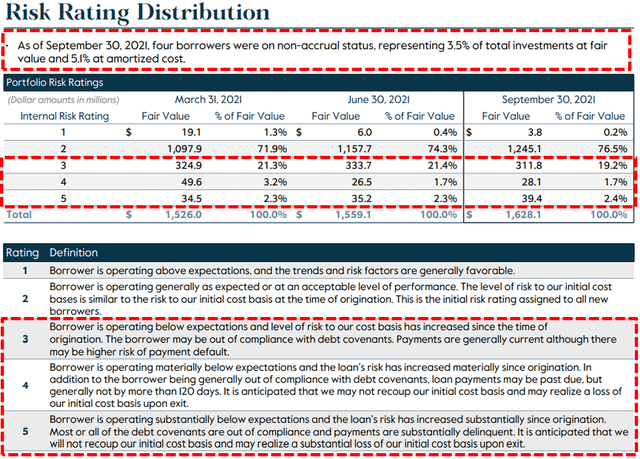
- Also, TSLX has a very low amount of investments considered ‘watch list’ that remains well under 4%.
This report discusses Sixth Street Specialty Lending (TSLX) which remains one of the highest quality BDCs that perform well during distressed environments. Management is very skilled at finding value in the worst-case scenarios, including recent retail and energy investments.
TSLX often lends to companies with an exit strategy of being paid back through bankruptcy/restructuring and proficient at stress testing every investment with proper coverage and covenants.
Management has prepared for the worst as a general philosophy and historically used it to make superior returns (as shown earlier). TSLX’s portfolio is 90% first-lien with an average of 1.9 financial covenants for each debt position, 84% with call protection, and 89% effective voting control. Also, as shown later, TSLX has a very low amount of investments considered ‘watch list’ that remains well under 2%.
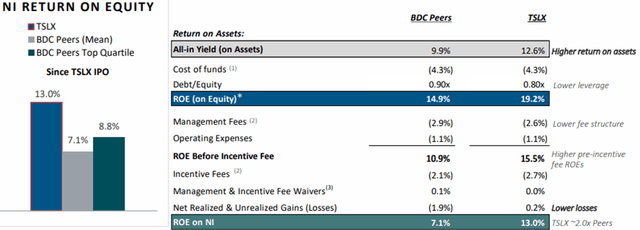
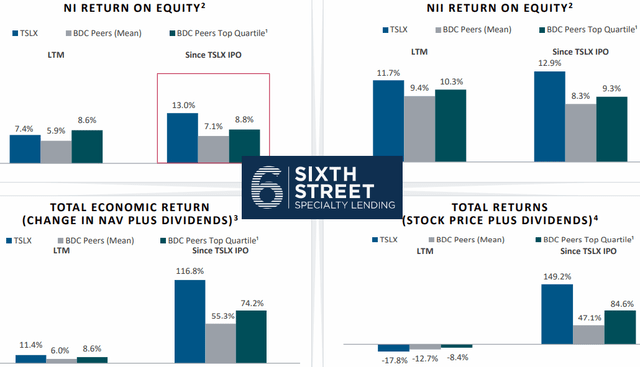
Comparison of Return on Equity (“ROE”)
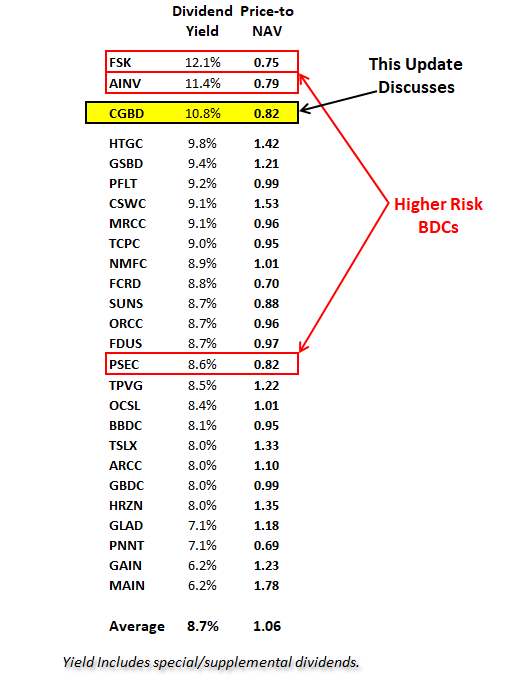
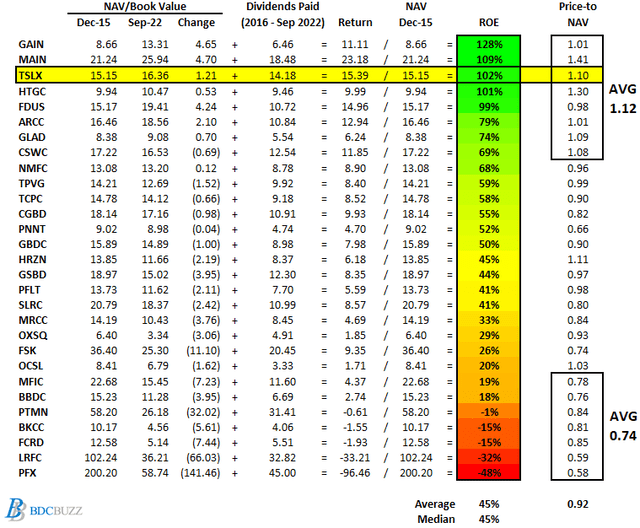
The following table shows the changes in NAV per share and dividends paid from December 31, 2015 through September 30, 2022, as a simple proxy for return on equity (“ROE”) to shareholders. It is important to note that many BDCs prefer not to pay special or supplemental dividends unless absolutely necessary because they directly reduce NAV per share. Also, some BDCs purposely pay lower dividends relative to their earnings, which contribute to higher NAV per share. However, this table takes these into account along with the current price-to-NAV ratios showing that investors pay higher multiples for BDCs that deliver higher returns to shareholders.
Most of the BDCs with higher ROEs have historically held higher amounts of equity investments, especially GAIN, MAIN, HTGC, FDUS, ARCC, GLAD, and CSWC. However, TSLX has relatively lower amount amounts of equity positions and much higher first-lien currently around 90% but has still delivered higher returns to investors as shown below.
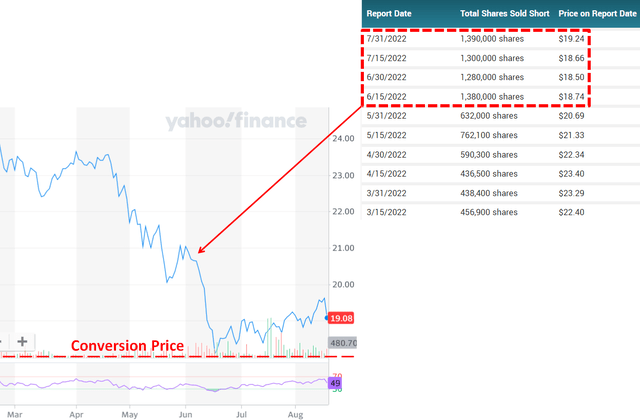
Technical Pressure Related to Conversion of Convertible Notes?
TSLX is a Strong Buy at these levels and I would suggest making purchases before the company reports Q4 2022 results in early February 2023 for the reasons discussed in this report.
There is a good chance that a portion of the previous decline in its stock prices was due to the conversion of its convertible notes into 4.4 million shares. As shown below, there was a meaningful increase in the amount share sold short just before the conversion:
TSLX Portfolio Yield & Interest Rate Sensitivity Analysis
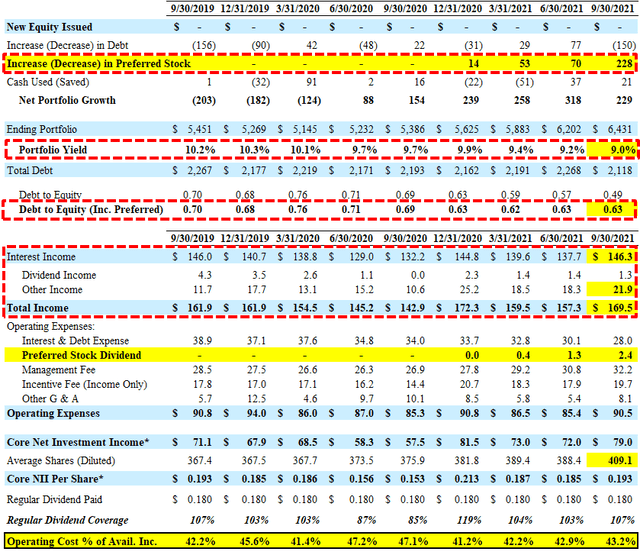
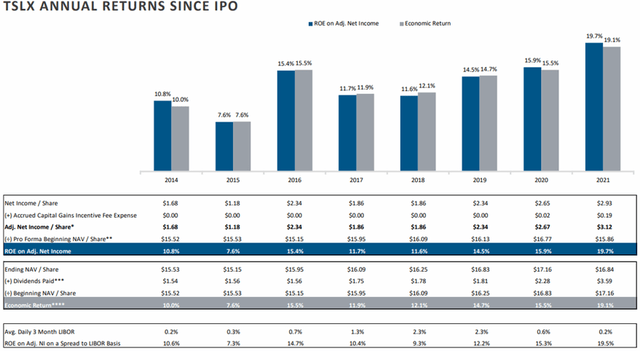
During 2013 and 2014, many BDCs experienced declining portfolio yields driven by competition for “true” first-lien and higher-quality assets. This was followed by a period of rate hikes, as mentioned earlier, which resulted in higher portfolio yields for most BDCs, including TSLX, as shown below. This had a direct impact on dividend coverage, increasing from 119% in 2016 to 147% in 2018, driving supplemental dividends paid to shareholders starting in 2017.
“In previous periods of rising interest rates, for example, from 2017 to late 2018, the reality of asset sensitivity has been called in question, given the tendency of the BDC sector to sacrifice spread in order to prioritize asset growth. Given the spread environment today, our strong relative capital base and significant liquidity, we are well positioned to retain the asset sensitivity.”
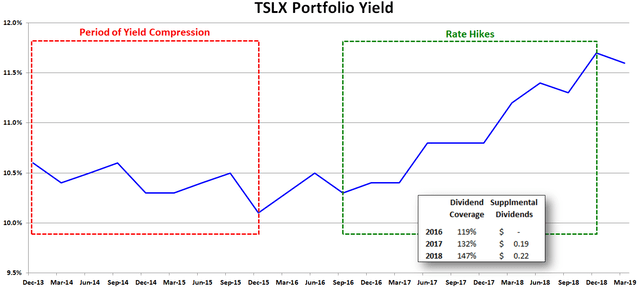
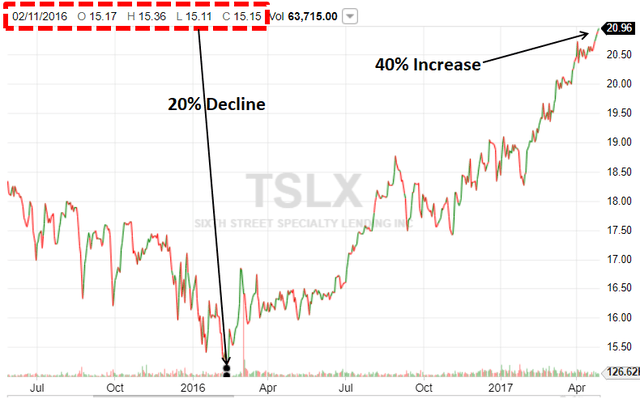
Obviously, higher dividend coverage and supplemental dividends was good news and TSLX’s stock price increased from $15.15 in early 2016 to over $21.00 by mid-2017. However, TSLX was only paying a regular quarterly dividend of $0.39 per share at the time.
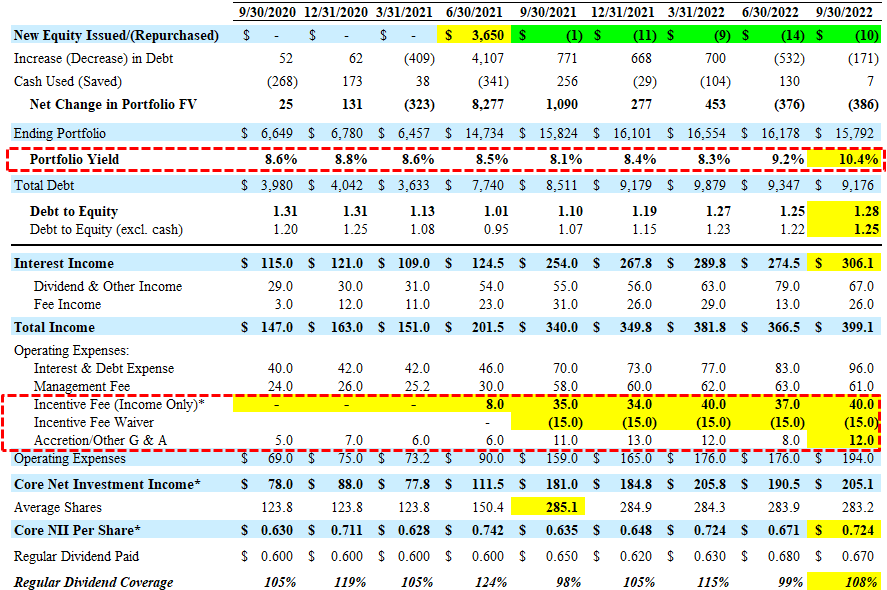
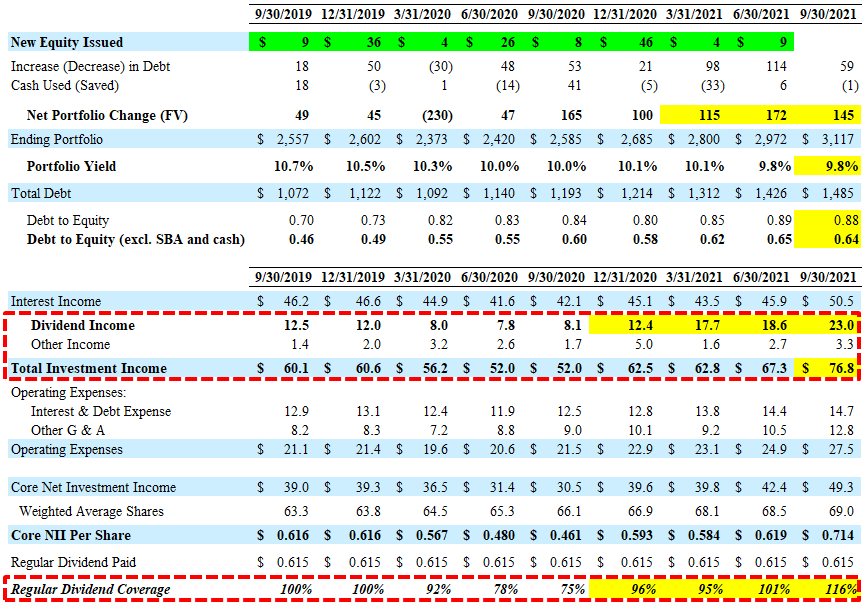
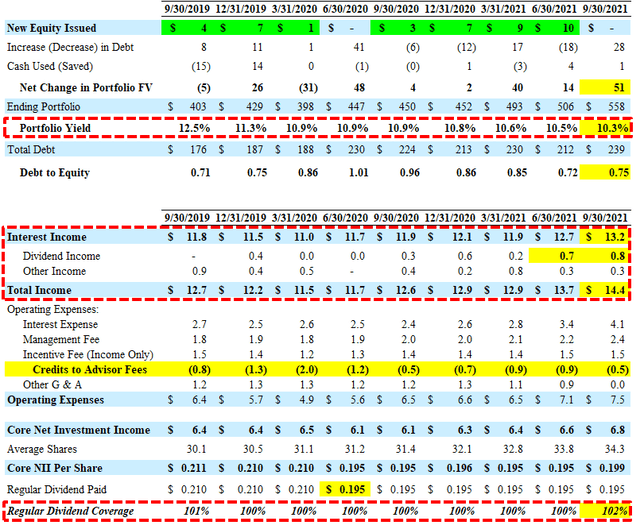
As shown below, there was a meaningful increase in TSLX’s portfolio yield for Q3 2022:
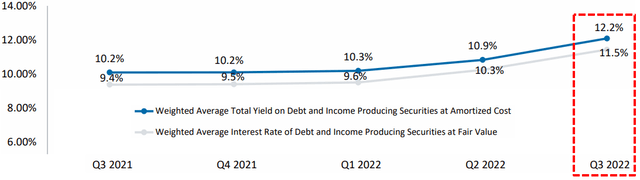
Management discussed on the recent call and is expecting a meaningful increase in earnings:
“Our weighted average yield on debt and income-producing securities at amortized cost was up to 12.2% from 10.9% quarter-over-quarter and is up about 200 basis points from a year ago. The weighted average yield at amortized cost on new investments, including up-sizes this quarter was 12.6% compared to a yield of 10% on investments partially paid down. The combination of the rising rates are now well above our average floor levels on our debt investments and the shape of the forward LIBOR or SOFR curve support that expectation. The rising rates will drive incremental interest income and outweigh the increases in the cost of our liabilities. This quarter’s net investment income and the rise in our base dividend, was driven by an increase in the core earnings power of our portfolio. As we previewed in prior quarters, we’re now seeing the positive asset sensitivity from higher base rates impacting core earnings. Since we reported last quarter, the forward curve has deepened resulting in core earnings in excess of what we previously anticipated.”
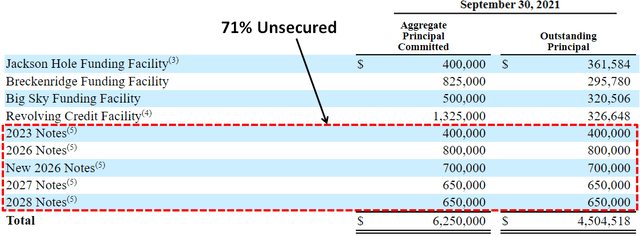
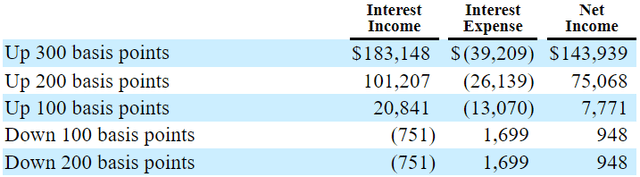
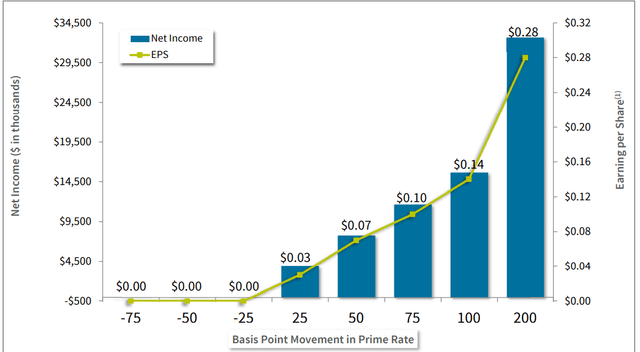
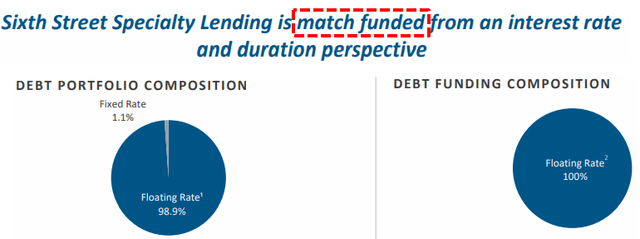
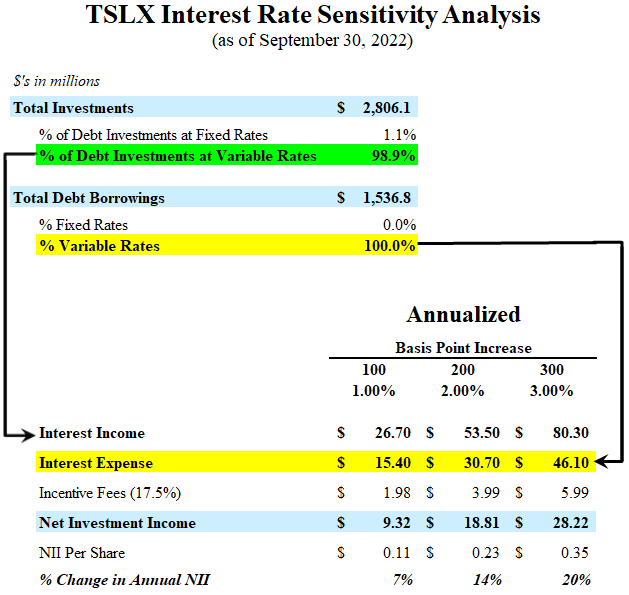
Interest rate sensitivity refers to the change in earnings that may result from changes in interest rates. TSLX carefully matches assets and liabilities, including floating or fixed, term, and risk. As of September 30, 2022, around 99% of portfolio debt investments bore interest at variable rates, most of which are subject to interest-rate floors and 100% of borrowings were also at variable rates and 52% unsecured:
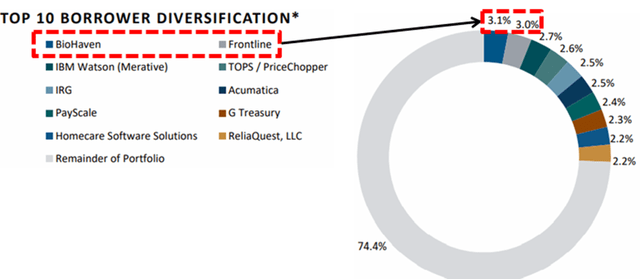
“Our funding mix at quarter end comprised 52% unsecured debt and 48% secured debt. Our balance sheet positioning was further enhanced post quarter end from the payoff of our positions in BioHaven and Frontline totaling approximately $146 million. Pro forma for these payoffs, which were the two largest positions in our portfolio at quarter end, we have close to $1 billion of liquidity. On top of the activity-based fees earned, these payoffs also increased our capital base by creating incremental investment capacity for new deployment opportunities into a more appealing investment environment.”
On the recent and previous earnings calls, management was asked about the potential impacts to portfolio credit quality from rising interest rates, inflation, and/or recessionary environments:
“We continue to have a conservative weighted average attach and detach point on our loans at 1.0x and 4.4x, respectively, and their weighted average interest coverage remained stable at 2.6 times. As of Q3 2022, the weighted average revenue and EBITDA of our core portfolio companies was $149 million and $44 million.”
“Returns for long-duration assets such as tech and biotech equities have been more meaningfully and negatively impacted by movement in rates, as small moves on results and large changes to the net present value of future cash flows. On the other hand, private credit and more specifically our portfolio, is predominantly compromise of shorter-duration assets and not sensitive to change in rates and less sensitive to winning risk premiums, given the ability to reprice those assets every two to three years. The benefit to our portfolio of floating rate, short duration assets and rising rate and spread environment is fundamentally dependent, however, upon credit selection and active portfolio management. We believe these factors will ultimately be what drives the dispersion in returns across the sector over time. Given our track record through COVID, 11 years investing through SOX and 25 years since our first direct mini investment, we feel well positioned to navigate the uncertainty — uncertain macro environment and take advantage of the opportunity set that it presents.”
“While we recognize that the terms are moving into a more lender-friendly direction, there is no free lunch. On the opposite side of the coin, borrowers of many leveraged credit issuers are feeling pressure from sustained inflation, higher interest rates on the debt obligations in a very tight labor market. Similar to our approach during COVID, we are actively monitoring our portfolio of companies by staying in close communication with management teams, so we’re able to respond quickly when necessary if credit quality issues look likely to arise. Based on the ongoing real-time conversations we’re having with our borrowers, however, we feel very good about the health and positioning of our current portfolio as we continue to be largely invested at the top of the capital structure and software and business services sectors that provide mission critical products and solutions to their customers. And the great thing about software business is, it tend to be 80% to 85% gross margin businesses and have variable cost structures beneath that. And so they — and their revenues are typically known. So when we look at the health of our software portfolio, just to go through, because I think it is helpful, and we try to look at KPIs are that more forward leaning about the health of the business.”
“We had no material amendment activity this quarter. The portfolio is in really, really good shape. It was a very, very benign level of activity on amendments and waivers. And I think that speaks to the portfolio and the quality portfolio, which we’ve built, which mostly is when you think about the nature of our business, I think like 78% to 80% has been of existing portfolio relates to software and business services that have recurring revenue and variable cost structures.”
“Despite these rising costs, the overall health of our borrowers’ financial position remains strong. We are heavily invested in businesses that are characterized by having predominantly variable cost structures, strong recurring revenue attributes, high switching costs and low customer concentration. We believe these fundamental characteristics will be key in the ongoing inflationary environment as we expect companies with pricing power and variable cost structures will be better positioned than those with large exposure to commodities, high fixed costs and limited ability to pass through price increases.”
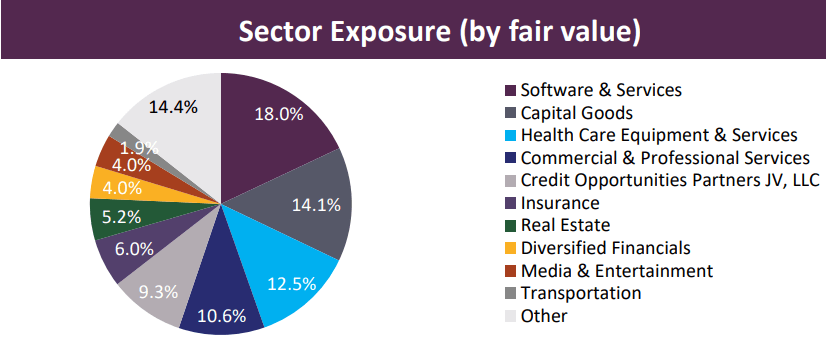
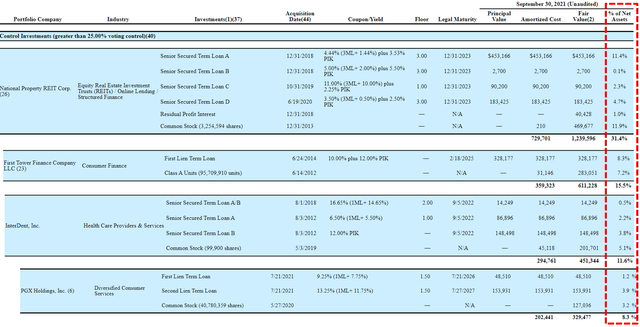
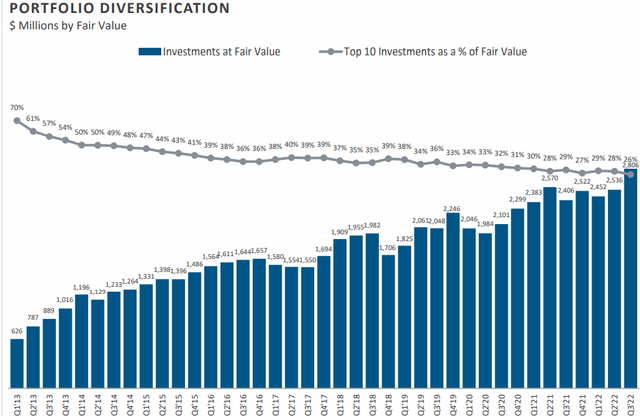
As shown below, TSLX continues to reduce its concentration risk with the top 10 investments now accounting for only 26% of the portfolio. However, as discussed later, its two largest investments accounting for over 6% of the portfolio (BioHaven Pharmaceuticals and Frontline Technologies) were prepaid in October 2022.
TSLX Dividend Coverage Update
Last month, TSLX increased its base dividend from $0.42 to $0.45 per share for Q4 2022.
“For the second consecutive quarter, our Board has increased our quarterly base dividend regions figured by approximately 7.1% or $0.03 per share to $0.45 per share. This quarter’s net investment income and the rise in our base dividend, was driven by an increase in the core earnings power of our portfolio. We’re now seeing the positive asset sensitivity from higher base rates impacting core earnings. Since we reported last quarter, the forward curve has deepened resulting in core earnings in excess of what we previously anticipated. Over the last five years, the rolling four quarter dividend coverage on our core earnings, core earnings defined as excluding all activity-based income average 102%. At the new quarterly base dividend level of $0.45 per share, we expect our core earnings to exceed this level and highlight the significant influence that all-in yields have had in the core earnings generated ability for our portfolio.”
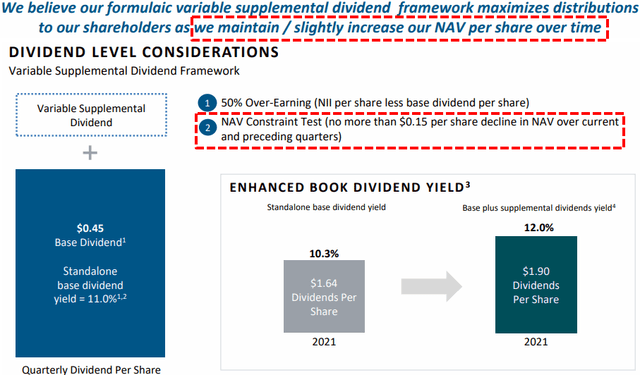
When calculating supplemental dividends, management takes into account a “NAV constraint test” to preserve its NAV per share. As discussed later, its NAV per share increased by only by $0.09, resulting in no supplemental dividend paid in Q4 2022:
“While the base dividend level in Q3 was well covered through core earnings, no supplemental dividend was declared related to Q3 earnings given the NAV limiter in our distribution framework which serves to retain capital and stabilize net asset value. The revised level of our quarterly base dividend increases the quarterly booked dividend yield to 11% from our prior quarterly annualized book dividend yield of 10.3%. Our supplemental dividend framework remains in place, allowing for the opportunity to increase book dividend yields with future supplemental dividends.”
However, there is a good chance that its NAV per share will increase due to credit spreads, eventually tightening, driving a partial reversal of the recent unrealized depreciation:
“Spread widening and lower implied equity values during this quarter resulted in approximately $0.05 per share of unrealized losses and not as a result of material changes in the underlying credit quality of our investments. We would expect to see a reversal of these unrealized losses related to credit spreads over time as our investments approach their respective maturities.”
For Q3 2022, TSLX reported between its base and best case projections covering its regular dividend by 112% with NII of $0.47 per share, again with historically low amounts of fee and prepayment-related income. However, during the first week of October 2022, its two largest investments (BioHaven Pharmaceuticals and Frontline Technologies) were prepaid, resulting in $0.11 per share of prepayment-related income, which has been taken into account with the update projections:
“Since quarter end, Frontline and Biohaven, our two largest portfolio companies based on fair value as of 9/30 were repaid during the first week of October, driven by previously announced M&A. As of quarter end, our weighted average mark on Biohaven was 110%, reflecting the impact of the anticipated fees embedded in our underlying exposure to this portfolio company that has since been crystallized in the $0.11 per share of activity-based fees, which will flow through investment income in Q4.”

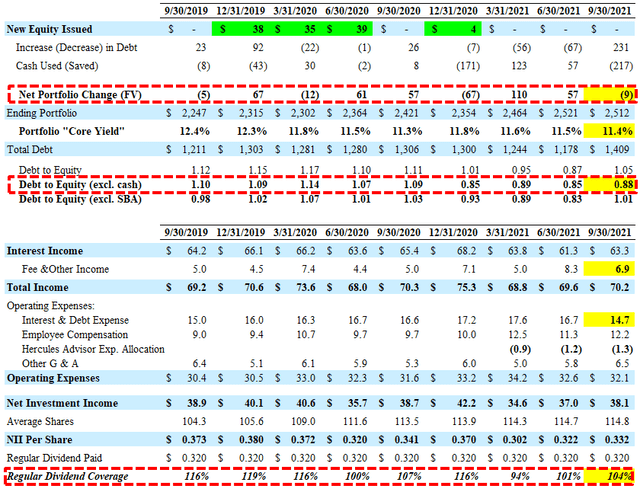
Leverage recently increased near the midpoint of its targeted debt-to-equity ratio between 0.90 and 1.25 but declined closer to 1.05 after taking into account the prepayments of BioHaven and Frontline. This is excellent timing as the proceeds will be redeployed “into a more appealing investment environment”:
“Our balance sheet positioning was further enhanced post quarter end from the payoff of our positions in BioHaven and Frontline totaling approximately $146 million. Pro forma for these payoffs, which were the two largest positions in our portfolio at quarter end, we have close to $1 billion of liquidity. The repayment activity we experienced in the first week of Q4 brought our debt-to-equity ratio down to approximately 1.05 times. On top of the activity-based fees earned, these payoffs also increased our capital base by creating incremental investment capacity for new deployment opportunities into a more appealing investment environment.”
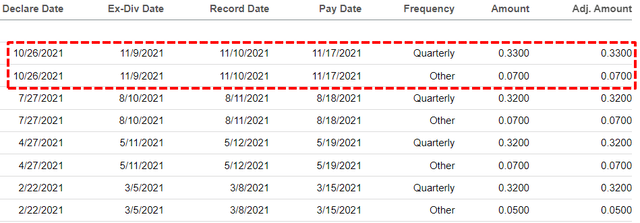
Management typically avoids having excessive amounts of excise tax by “cleaning out” the spillover as it “creates a drag on earnings” which is why the company paid a total of $1.95 per share in supplemental/specials during 2021. During 2022 there were lower amounts of supplemental/specials paid partially due to increasing its regular dividend plus its “NAV constraint test” as mentioned earlier. However, there is a good chance that the company will pay higher amounts in 2023 related to increased fee and prepayment-related income, higher portfolio yield, the reversal of previous unrealized losses, and building undistributed taxable income (“UTI”). Previously, there was $0.56 per share of spillover that continues to build and there will likely be a ‘special’ dividend announced at some point in 2023, in addition to supplemental dividends paid over the coming quarters, as shown in the projections.
“Based on the enhanced levels of the dividend coverage, that we anticipate extending through 2023 and an understanding of our anticipated leverage levels, our Board felt comfortable raising the quarterly dividend. As the operating environment continues to evolve, the Board will continue to evaluate further increases on a quarterly basis. This is consistent with our philosophy of establishing a base dividend level that we have a high degree of confidence and meeting each period.”
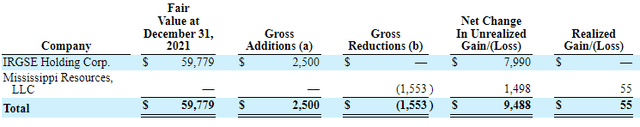
Most dividend coverage measures for BDCs use net investment income (“NII”) which is basically a measure of earnings. However, some BDCs achieve incremental returns with equity investments that are sold for realized gains often used to pay supplemental/special dividends. So far in 2022, there has been another $16.5 million or $0.21 per share of net realized gains mostly related to the full exit of SMPA/MD America Energy, partial exit of Copper Bidco and most recently from dissolving its non-accrual investment in Mississippi Resources:
“We had one full and one partial investment realization, totaling approximately $16 million in Q3. Our full investment realization of the Mississippi Resources was related to the proceeds available from dissolving the business. We received our final distribution at the end of September, and the remaining debt was repaid, resulting in a small realized gain.”
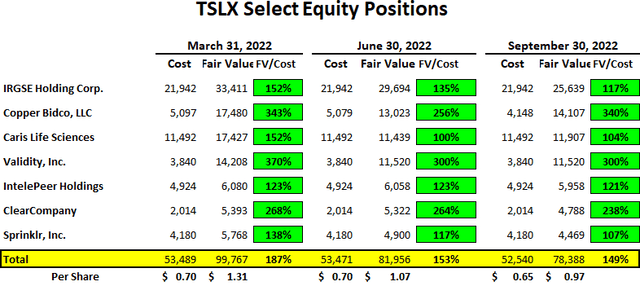
As shown below, many of its equity positions are still marked above cost including IRGSE Holding Corp., Copper Bidco, Validity, Inc., and ClearCompany,that could result in an additional $0.32 per share of realized gains if sold/exited at September 30, 2022, fair values.
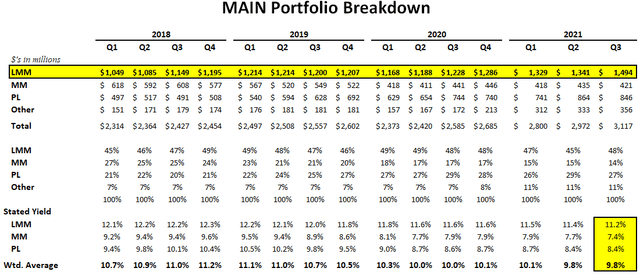
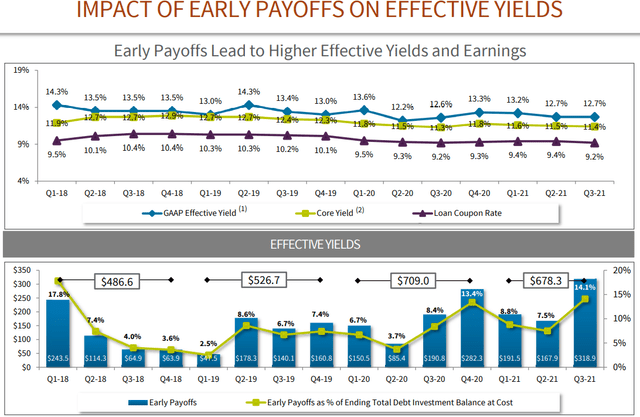
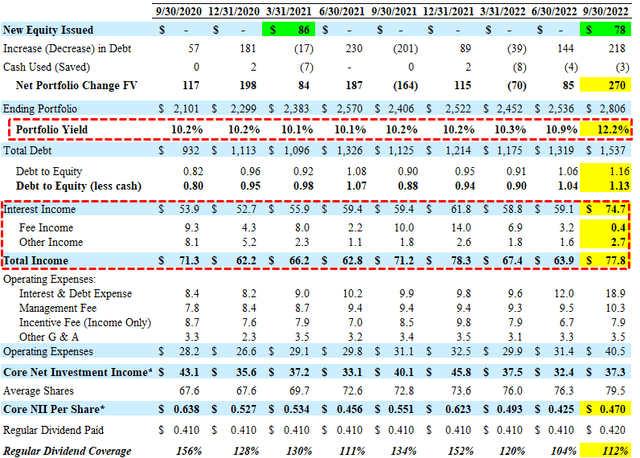
During Q3 2022, there was another meaningful increase in the overall portfolio yield from 10.9% to 12.2% likely responsible for the continued dividend increases.
“Our weighted average yield on debt and income-producing securities at amortized cost was up to 12.2% from 10.9% quarter-over-quarter and is up about 200 basis points from a year ago. The weighted average yield at amortized cost on new investments, including up-sizes this quarter was 12.6% compared to a yield of 10% on investments partially paid down.”
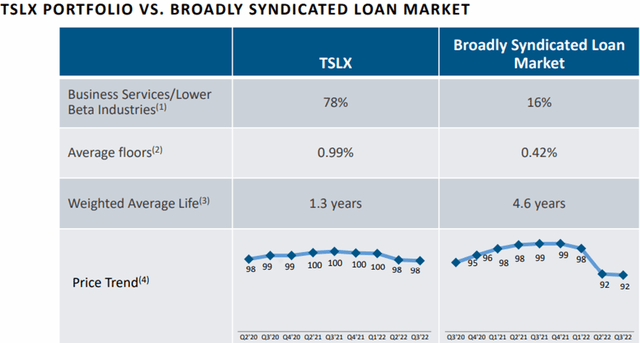
Similar to other BDCs, TSLX management mentioned the “more lender-friendly environment” with “higher overall yields” and better terms including stronger covenants (safer investments) as well as “issuers willing to pay higher fees” taken into account with the best-case projections:
“New issued leveraged loan volumes are down 86% in Q3 relative to the same period last year and high-yield bonds year-to-date reached its lowest level since 2008. In addition to the limited number of deals getting done in the public credit markets, we are also seeing a pullback from banks as they focus on satisfying regulatory-driven capital ratio requirements. Given these dynamics, there has been an increasing number of borrowers and sponsors turning to the direct lending market, including those seeking larger financings. We believe this broadening of the opportunity set is a net positive for our sector, and specifically for our business and our stakeholders, given our ability to be a solutions provider at scale through co-investments with our affiliated funds. With fewer financing options available for borrowers, we’re seeing a shift towards a more lender-friendly environment. Not only are we seeing higher overall yields, driven by higher base rates, spreads have also widened as well. We’re also seeing issuers willing to pay higher fees in order to get deals across the finish line, which allows us to pick our spots and remain selective.”
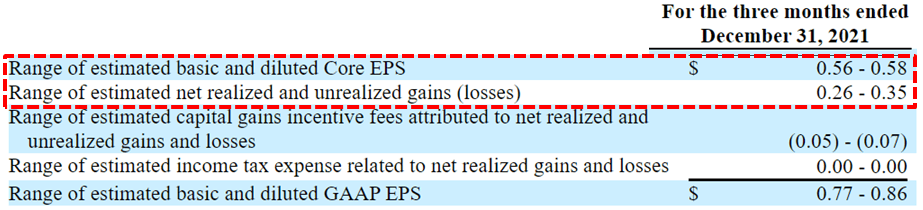
Management is expecting “to exceed the top end of our target range for full year 2022” implying earnings of over $1.92 per share for 2022, implying over $0.54 per share for Q4 2022 compared to its regular dividend of $0.45 per share.
“At the beginning of this year, we communicated an annualized ROE target of 11% to 11.5% based on our expectations over the intermediate term for our net asset level yields, cost of funds and financial leverage. Year-to-date, we’ve generated an annualized ROE on adjusted net investment income of 11%. Given the strength of our investment pipeline, continued positive impact from higher all-in yields and our expectations for fee-related activity for the remainder of the year including the $0.11 per share of fees that were crystallized in October from the payoff of Biohaven, we believe we are on pace to exceed the top end of our previously stated target range for 2022 NII per share of $1.84 to $1.92. This implies Q4 NII in excess of $0.54 per share and a full year ROE on adjusted net investment income of greater than 11.5%.”
TSLX Risk Profile Quick Update
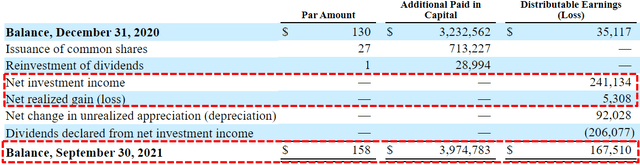
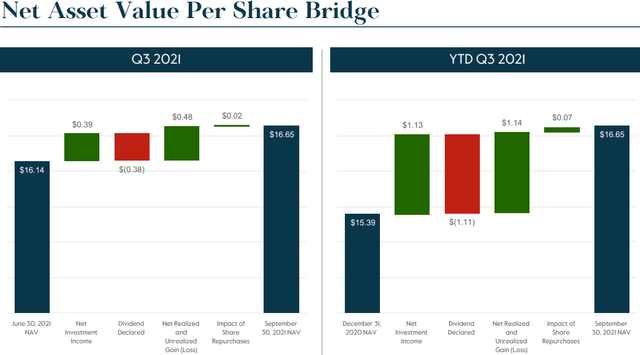
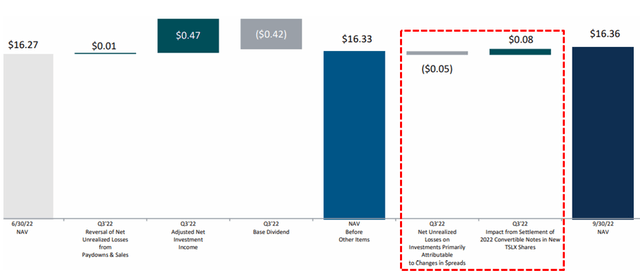
During Q3 2022, net asset value (“NAV”) per share increased by 0.6% (from $16.27 to $16.36) due to the $0.08 per share accretive impact of issuing shares to settle the majority of its 2022 convertible notes which matured in August 2022 as discussed in the previous report. Spread widening and lower implied equity values resulted in approximately $0.05 per share of unrealized losses offset by overearning the dividend.
“Growth in our reported net asset value per share from $16.27 to $16.36 was primarily driven by the accretive impact of issuing shares to sell the majority of our 2022 convertible notes, which matured in August. As you may recall from our conference call and the accompanying letter we published last quarter, our valuation framework includes the impact of market spreads movements into the valuation of our portfolio, adjusting for the expected weighted average life and other idiosyncratic factors. Spread widening and lower implied equity values during this quarter resulted in approximately $0.05 per share of unrealized losses, thereby partially offsetting the increase in net asset value we experienced from the combination of accretion within notes conversion and earnings above our base dividend level.”
TSLX’s stock price dipped slightly below its NAV per share during the market pullback in late September 2022, resulting in a small amount of share repurchases:
“During September, our 10b5-1 stock repurchase program was triggered resulting in repurchases of $3 million, which represents approximately 180,000 shares at an average price of $16.62. The existence of this program is consistent with our objective of allocating capital to accretive opportunities for our shareholders, and we will continue to prioritize capital efficiencies throughout this ongoing volatile and uncertain environment. Our Board renewed this program and reset the total size to $50 million. Given the premium on capital availability and the more compelling new investment environment that Bo spoke about earlier, our program trigger will be reset to activate at $0.01 below the most recent reported net asset value per share.”
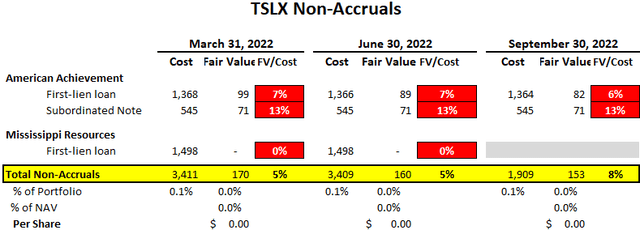
As mentioned earlier, its non-accrual investment in Mississippi Resources was exited/dissolved during Q3 2022, resulting in a small realized gain:
“After the realization of Mississippi Resources during the quarter, we have only one portfolio company on nonaccrual representing less than 0.01% of the portfolio at fair value with no new names added to non-accrual during Q3. The strength and improvement of these metrics quarter-over-quarter illustrates our confidence in the underlying credit quality of our portfolio. Our full investment realization of the Mississippi Resources was related to the proceeds available from dissolving the business. We received our final distribution at the end of September, and the remaining debt was repaid, resulting in a small realized gain.”
There were no new investments added to non-accrual status, which remain 0.0% of the portfolio fair value. As of September 30, 2022, 100.0% of the portfolio at fair value was meeting all payment and covenant requirements.
“We had no material amendment activity this quarter. The portfolio is in really, really good shape. It was a very, very benign level of activity on amendments and waivers. And I think that speaks to the portfolio and the quality portfolio, which we’ve built, which mostly is when you think about the nature of our business, I think like 78% to 80% has been of existing portfolio relates to software and business services that have recurring revenue and variable cost structures. And so it was, again, no material amendments and waivers this quarter.”
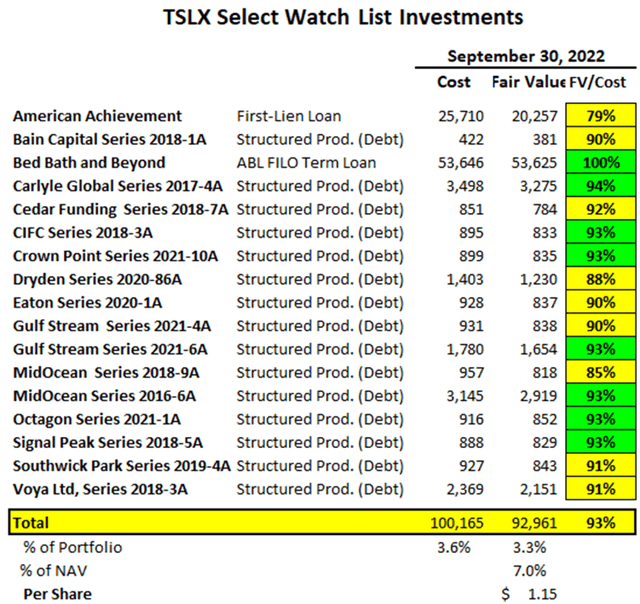
The amount of investments considered ‘watch list’ remains very low at under 4% of the total portfolio fair value, mostly its ABL term loan to Bed Bath and Beyond, first-lien position in American Achievement that remains on accrual status and some of its debt positions in structured credit investments. As discussed later, TSLX management is very skilled at finding value in the worst-case scenarios, including retail ABL (asset-based lending) and energy investments.
As discussed in previous reports, American Achievement is a company that manufactures and supplies yearbooks, class rings and graduation products and was discussed on the previous call:
“American Achievement was a relatively small position. It was a COVID-impacted name. It’s in the yearbook, class rings, caps and gowns business. Obviously they missed the selling season in 2020 and 2021 should be better. Our expectation and hope is that it would rebound to around pre-COVID numbers.”
American Achievement has been renamed Balfour & Co and recently reported good news:
“A nearly 100% fiscal year-over-year improvement in operating performance as well as the construction of its new, state-of-the-art printing facility. The company’s financial improvement was largely a reflection of strong sales and operating improvements across its core graduation products categories. With its financial flexibility and strong operating position, Balfour continues to invest in its platform to expand its products and customer support within existing and emerging categories in the commencement services space. Balfour is also well underway in the construction of its additional, new, and state-of-the-art yearbook printing facility to provide schools an extra edge by offering access to the latest innovations in printing technologies to deliver best-in-class yearbooks to its customers starting in 2023. In addition, Balfour has also arranged a partnership with an established printing company, which is under common ownership and has three printing locations, to provide printing capacity overflow and redundancy whenever it is needed.”
TSLX management is very skilled at finding value in the worst-case scenarios, including retail ABL (asset-based lending) and energy investments:
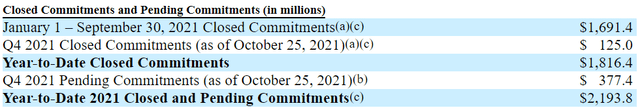
“In August, we ageing and closed a $375 million term loan commitment to support an operational turnaround by Bed Bath & Beyond. As access to traditional sources of capital has become more constrained, our ability to invest alongside affiliated funds allowed us to be a valuable solutions provider for the company during the time of meeting. Given the transactional complexity, we were able to drive better pricing in terms, which supports our robust asset level yields. Additionally, our expertise in the retail ABL space, allowed us to underwrite the investment with speed and certainty based on our years of experience executing on this theme. Since commencing investment operations, Bed Bath & Beyond represents the 25th retail ABL transaction that we’ve completed with a total of $1.1 billion of capital deployed in SLX through the strategy. At quarter end, our retail ABL exposure increased to 8.4% of the portfolio on a fair value basis.”
“Specifically on Bed Bath & Beyond, which didn’t show up as that material in our P&L, but we originated that investment and sold it above our cost increased syndication income for SLS this quarter. So our ability to deliver the entire platform to deliver in size to an issuer with certainty, allowed us to create additional economics and something that’s worth more than cost for our investors. The great thing about those type of structures and loans is that we get to evaluate the value of our collateral in an environment that we’re in today, where if there’s margin compression, the value of that inventory goes down which means, what we actually lend on that collateral goes down. And so it’s a pretty dynamic way to approach the market. We’ve been in this market for 20-plus years, and we’ve invested across the cycles. That being said, there is a mechanism in how we structure these deals and how we think about it, which allows us to adjust our risk dynamically. I couldn’t be more excited about the opportunities set going forward. But we have the opportunity to pick the highest risk-adjusted returns and drive return on equity for our shareholders because that top of our funnel is much broader and so we have a broader view of the world.”
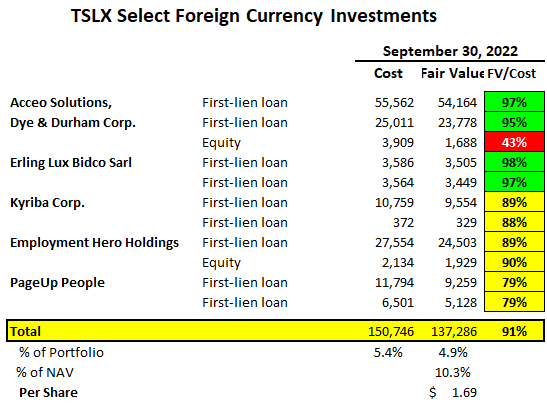
TSLX has around 5% of the portfolio with foreign currency exposure, but these investments are adequately hedged:
“And finally, movement in foreign exchange rates drove unrealized losses on our foreign currency denominated investments, which were offset by unrealized gains on our foreign currency denominated debt outstanding. It’s worth spending a moment on the financial statement presentation of our foreign currency denominated investments as this can cause some confusion. Our philosophy when funding foreign currency investments is to borrow the par amount of that investment in local currency through our multicurrency revolving credit facility. This gives us both an asset and a liability denominated in local currency. Therefore, any movement in the FX rates applying to that investment impacts both the asset side and the liability side of our balance sheet in an equal but offsetting way. It’s important to note that movement in the fair market value of an investment due to changes in foreign currency rates is distinct and separate from a change in the valuation mark caused by credit or widening spreads. To use a specific example, let’s look at the Canadian borrower in our schedule of investments, Acceo Solutions, Inc., where we hold a first lien term loan. The valuation market quarter end is 101.0. At the end of Q2, the valuation mark on Acceo was 101.25, so from a credit perspective, there’s been very limited movement quarter-on-quarter. Over that same period, however, the fair market value as a percentage of cost has fallen from 104.2 to 97.5, representing a significantly larger decrease in value than that represented by the limited decrease in the valuation mark. For Acceo, this divergence was the impact of the strengthening US dollar over the period. Taking into account our natural hedge created by borrowing in local currencies, the value of our Canadian dollar debt expressed in US dollars terms decreased in an equal and offsetting way over the same period. None of these investments are on non-accrual status, and each of the investments was rated one, consistent with that of the overall portfolio.”
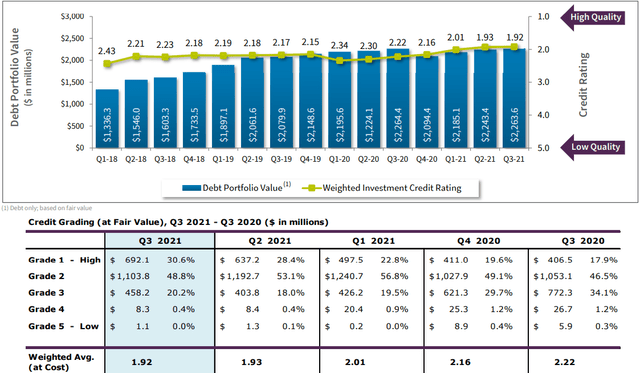
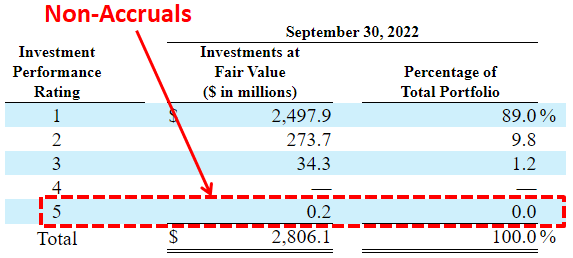
As of September 30, 2022, the overall performance of the portfolio continues to be solid, with approximately 98.8% rated 1 or 2 on a performance rating scale of 1 to 5, with 1 being the strongest.
“Moving on to portfolio composition and credit staff, across our core borrowers from whom these metrics are relevant, we continue to have a conservative weighted average attach and detach point on our loans at 1.0x and 4.4x, respectively, and their weighted average interest coverage remained stable at 2.6 times. As of Q3 2022, the weighted average revenue and EBITDA of our core portfolio companies was $149 million and $44 million, respectively.”
“The performance rating of our portfolio continues to be strong, with a weighted average rating of 1.12 on a scale of 1 to 5 with 1 being the strongest, representing a positive change from last quarter’s rating of 1.13.”
What Can I Expect Each Week With a Paid Subscription?
Each week we provide a balance between easy to digest general information to make timely trading decisions supported by the detail in the Deep Dive Projection reports (for each BDC) for subscribers that are building larger BDC portfolios.
- Monday Morning Update – Before the markets open each Monday morning, we provide we provide quick updates for the sector, including significant events for each BDC along with upcoming earnings, reporting, and ex-dividend dates. Also, we provide a list of the best-priced opportunities along with oversold/overbought conditions, and what to look for in the coming week.
- Deep Dive Projection Reports – Detailed reports on at least two BDCs each week prioritized by focusing on ‘buying opportunities’ as well as potential issues such as changes in portfolio credit quality and/or dividend coverage (usually related). This should help subscribers put together a shopping list ready for the next general market pullback.
- Friday Comparison or Baby Bond Reports – A series of updates discussing Building A BDC Portfolio, suggested pricing and limit orders, comparing expense/return ratios, interest rates, leverage, BDC Notes/Baby Bonds, portfolio mix, and potential impacts on dividend coverage and risk.
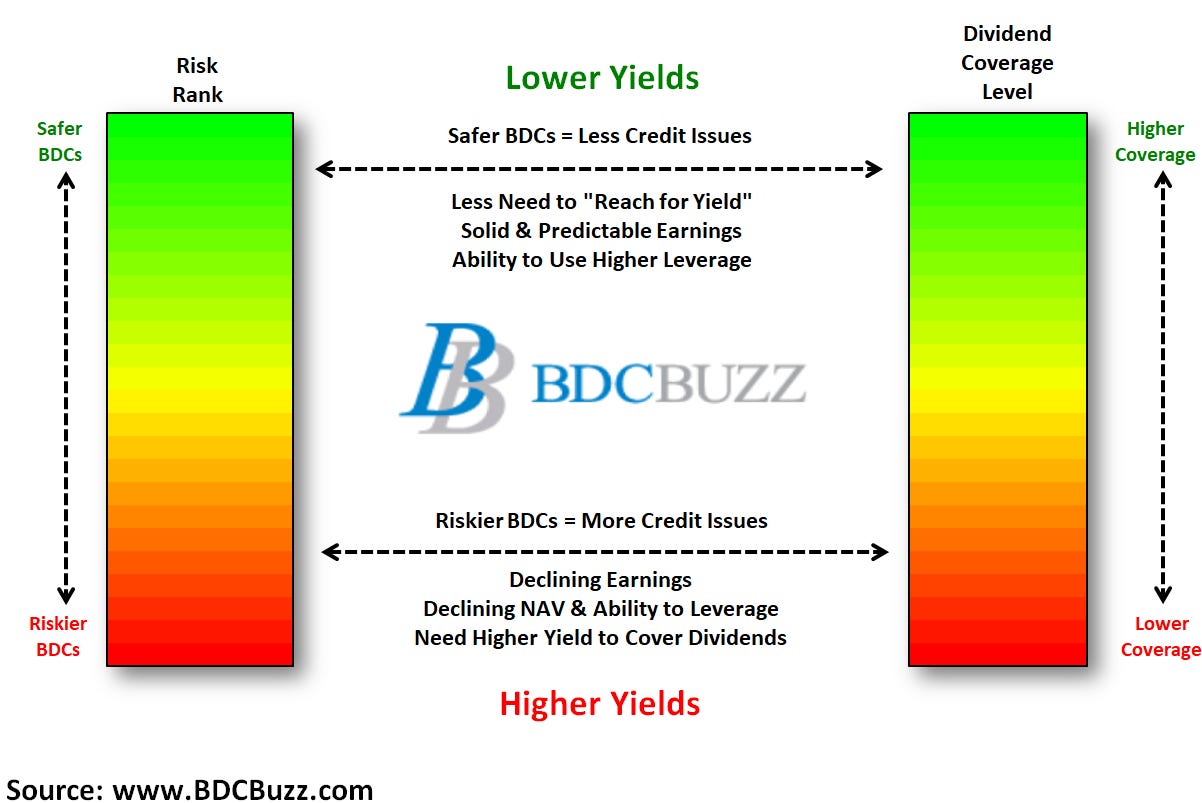
This information was previously made available to subscribers of BDC Buzz Premium Reports. BDCs trade within a wide range of multiples driving higher and lower yields mostly related to portfolio credit quality and dividend coverage potential (not necessarily historical coverage). This means investors need to do their due diligence before buying, including setting target prices using the portfolio detail shown in this article (at a minimum) as well as financial dividend coverage projections over the next three quarters, as discussed earlier.