The following information was previously provided to subscribers of Premium BDC Reports along with:
ORCC and GSBD target prices/buying points
ORCC and GSBD risk profiles, potential credit issues, and overall rankings. Please see BDC Risk Profiles for additional details.
ORCC and GSBD dividend coverage projections (base, best, worst-case scenarios). Please see BDC Dividend Coverage Levels for additional details.
The Big Boys Continue To Pile Into This Dividend Sector
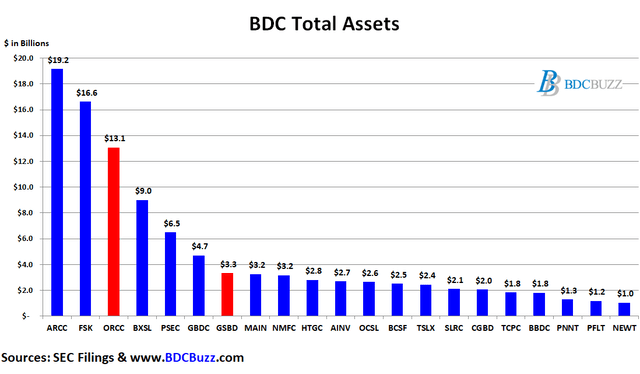
As mentioned in “The Big Boys Continue To Pile Into This Dividend Sector: ORCC” Business Development Companies (“BDCs”), like REITs almost 20 years ago, want institutional investors and the scale that comes with them. Many of the largest asset managers have been actively building assets in the sector including BlackRock, Goldman Sachs Group, Franklin Templeton, The Blackstone Group, Barings, Apollo, The Carlyle Group, Ares Management, KKR & Co. Inc., Oaktree Capital Management, TPG Capital, Bain Capital, and Blue Owl. However, Ares and Apollo have managed Ares Capital (ARCC) and Apollo Investment (AINV) for quite a while as compared to others. This article discusses Goldman Sachs BDC (GSBD)and Owl Rock Capital (ORCC). There are now 20 publicly traded BDCs with more than $1 billion in assets and I have discussed many of them over the last few months (see list below) and will try to cover the others in upcoming articles.
These 13 asset management companies combined manage more than $16.5 trillion in assets (up from $11 trillion in early 2020), and there will likely be continued positive changes to regulations over the coming quarters driving up multiples for current investors. Please keep in mind that higher multiples mean higher prices (and lower yields) as the BDC sector continues to attract more attention and respect from the investment community especially given how they performed during the pandemic. Most BDCs seem to be in a virtuous circle of improving asset quality supporting a lower cost of capital driving improved earning, NAV, and dividend increases. Many have recently issued very low rate unsecured notes and refinanced their balance sheets including Owl Rock Capital (ORCC) and Goldman Sachs BDC (GSBD) as discussed in this article.
Portfolio Mix and Credit Quality
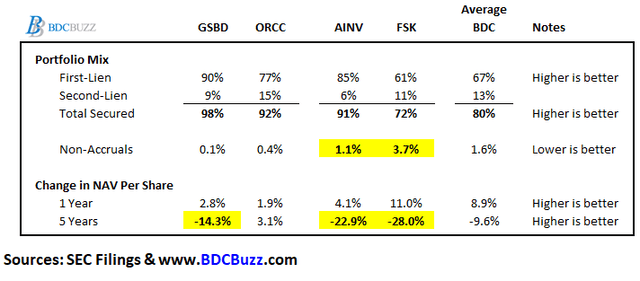
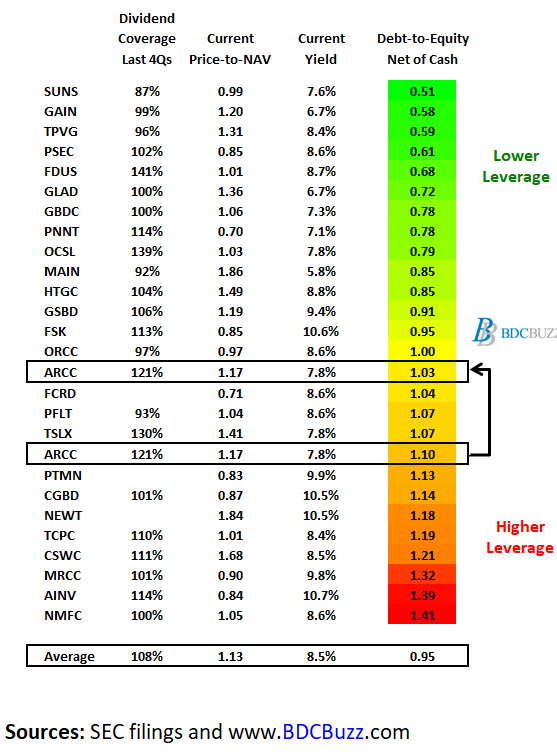
The following tables show a handful of some of the metrics used to compare BDCs but please keep in mind that this information is oversimplified and needs discussion. For example, not all “first-lien” is the same credit quality. I would feel much safer with second-lien in a higher quality BDC than first-lien in a lower quality one. Plenty of the BDCs that were the worst performers had plenty of first-lien only to have huge declines in book values or net asset values (“NAV”) the following quarters. Medley Capital (MCC) and Fifth Street Capital (FSC) were perfect examples of this.
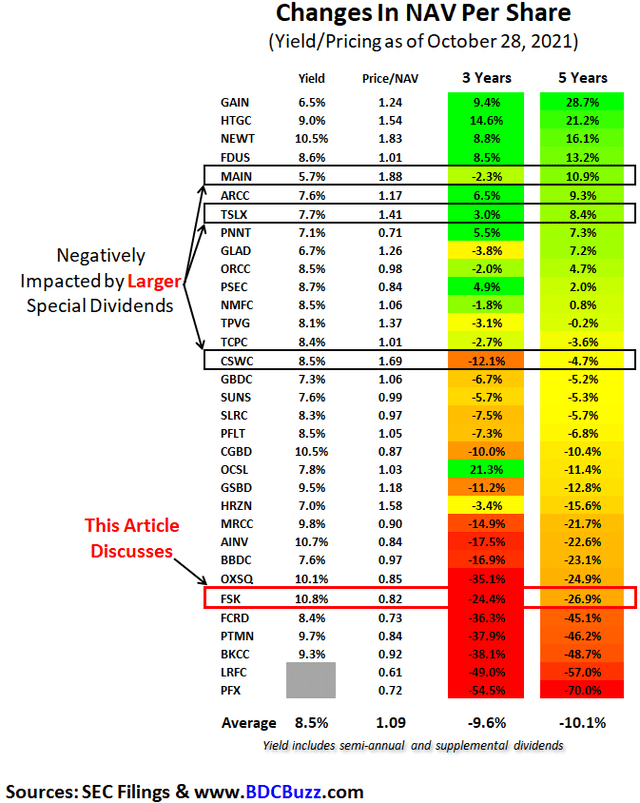
Also, please note that BDCs such as GSBD, ORCC, and AINV have mostly secured debt positions as compared to equity participation which has been primarily responsible for most of the NAV growth for other BDCs. That is why the average BDC has experienced ANV growth of around 9% over the last four quarters but they also have lower amounts of secured positions. For some examples of BDCs that have been benefitting from equity positions please see the following articles from September 2021:
It is important to point out that BDCs that have been marking up equity positions would likely experience larger NAV declines during a serious market downturn or economic event. Please be careful.
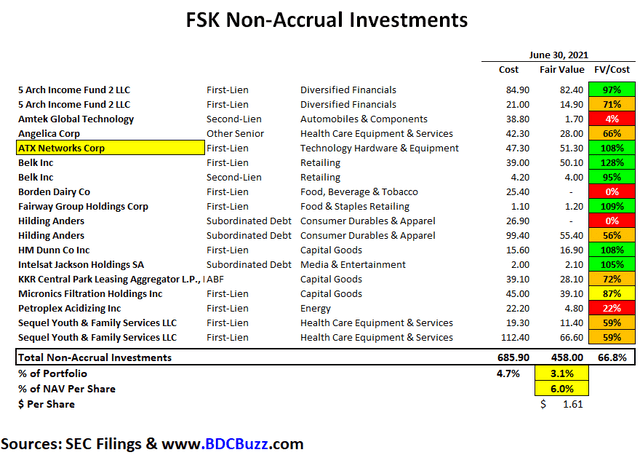
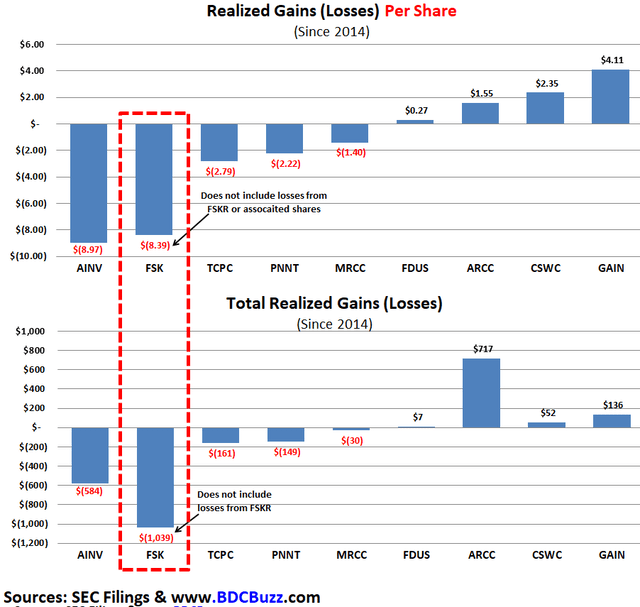
Also, non-accruals are investments that a BDC is currently not accruing income due to credit issues. Some BDCs will exit or restructure these investments just before the quarter-end taking a realized loss but avoiding being listed as a credit issue when it comes to reporting. It’s better to look at historical realized losses which clearly identify historical credit issues as discussed in some of the articles linked above including “FS KKR Capital: Dividend Decrease Coming” which discussed FSK and AINV.
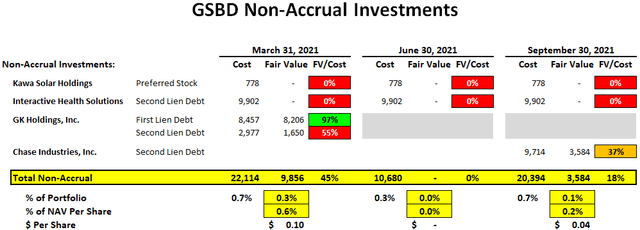
As shown in the previous table, FSK and AINV have had larger NAV declines over the last 5 years but so has GSBD mostly related to legacy investments. These investments have been discussed in previous articles and were considered idiosyncratic especially given the improved credit quality over the last two years. GSBD has 111 portfolio companies and with only 2 put on non-accrual status over the last 7 quarters.
As of September 30, 2021, GSBD’s investments on non-accrual status accounted for 0.1% and 0.7% of the total investment portfolio at fair value and cost, respectively. If its non-accrual were completely written off the impact to NAV would be around $0.04 per share or 0.2%:
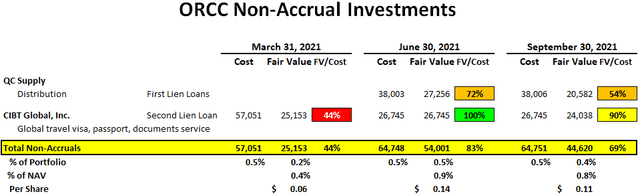
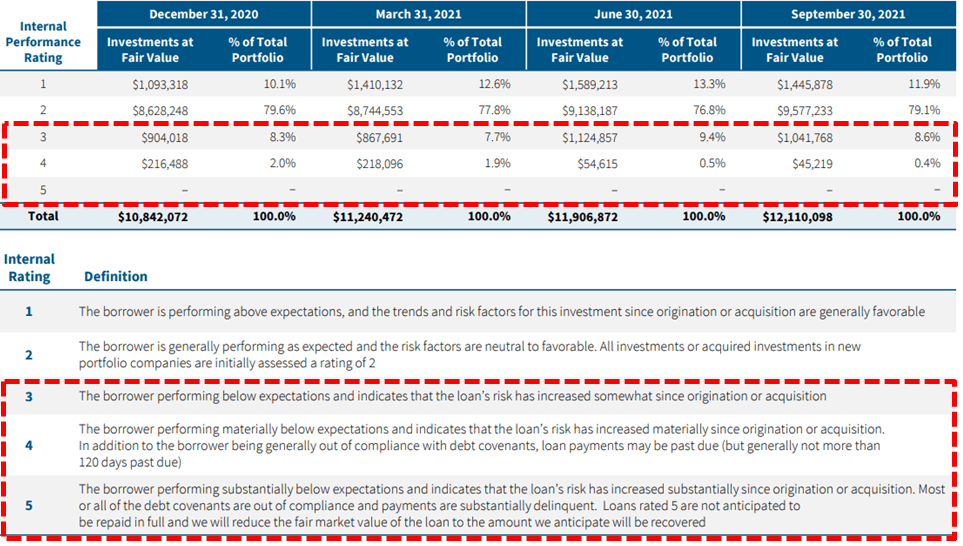
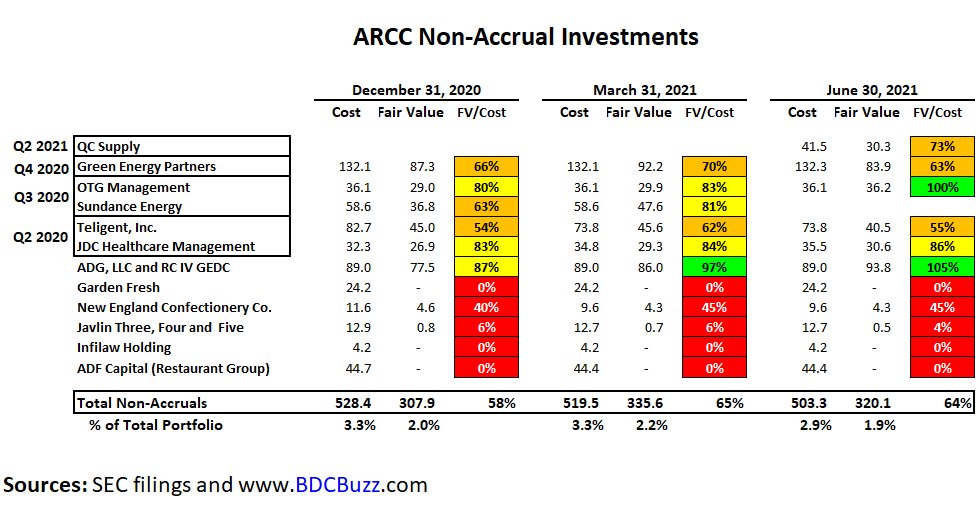
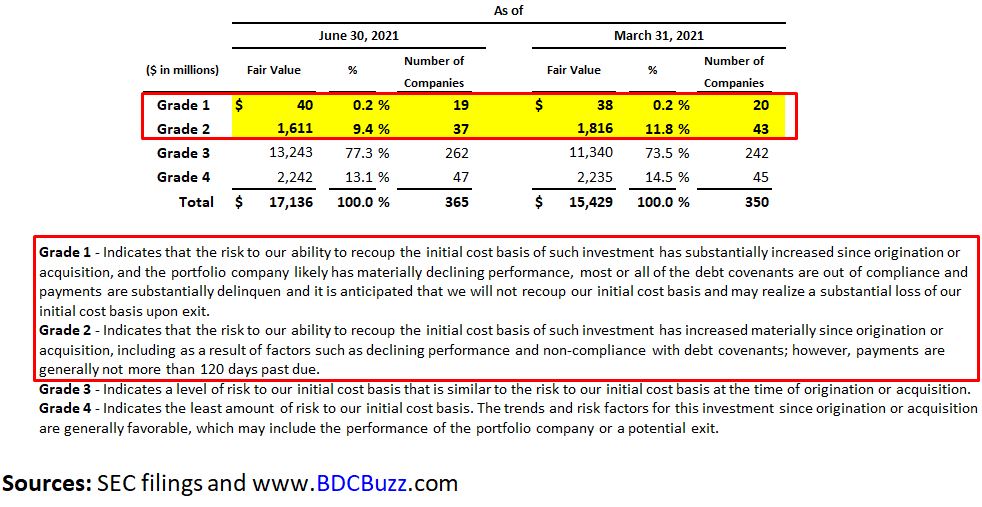
Two of ORCC’s smaller first-lien loans to QC Supply were added to non-accrual status during Q2 2021 and marked down again during Q3 2021. Also, CIBT Global, Inc. remains non-accrual and was also marked down as shown in the following table. Please keep in mind that ORCC has 130 portfolio companies so there will always be a certain amount on non-accrual which currently account for 0.4% of the total portfolio fair.
We are carefully monitoring the current headwinds caused by the labor shortages and supply chain disruptions. To date, we have not seen a material impact as many of our companies are services businesses, which have modest exposure to the manufacturing economy. For example, some of our largest sectors are software, insurance, and health care, which are not as exposed to the current economic headwinds. In line with last quarter, our nonaccruals remained low with only two investments on non-accrual status, representing 0.4% of the portfolio based on fair value. One of the lowest levels in the BDC sector and our annualized loss ratio is 14 basis points.”
Expense Ratio & Fee Agreements
As a part of assessing BDCs, it’s important to take into account expense ratios. BDCs with lower operating expenses can pay higher amounts to shareholders without investing in riskier assets.
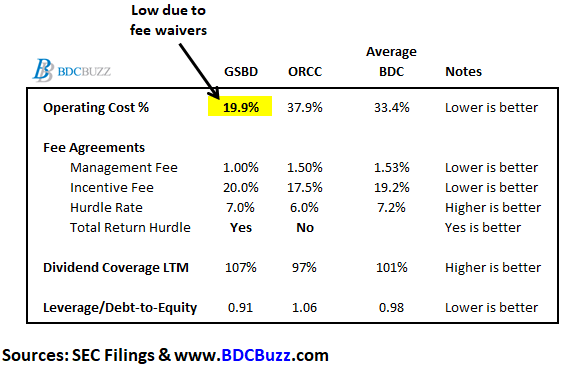
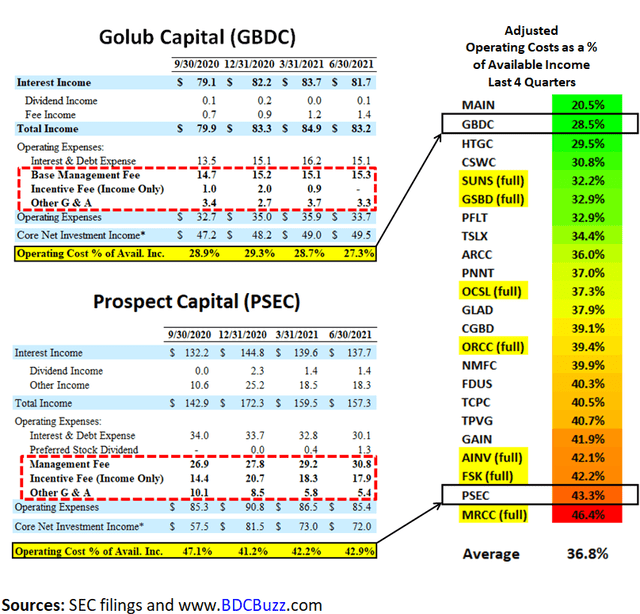
“Operating Cost as a Percentage of Available Income” is one of the many measures that I use which takes into account operating, management, and incentive fees compared to available income. “Available Income” is total income less interest expense from borrowings and is the amount of income that is available to pay operating expenses and shareholder distributions.
As discussed in “Conservative Portfolio Safely Paying Investors 7.3%“, many BDCs have been temporarily waiving fees or have fee agreements that take into account previous capital losses that are ending this year. GSAM is waiving a portion of its incentive fee for the four quarters of 2021 (Q1 2021 through and including Q4 2021) in an amount sufficient to ensure that GSBD’s net investment income per share is at least $0.48 per share per quarter.
However, GSBD has what I consider to be a more shareholder-friendly fee agreement with a lower-than-average base management fee of 1.00% and a total return hurdle to protect shareholders from additional credit issues. ORCC has a lower yielding portfolio which is why its hurdle rate is only 6.0% (not ideal) and lower-than-average incentive fee rate.
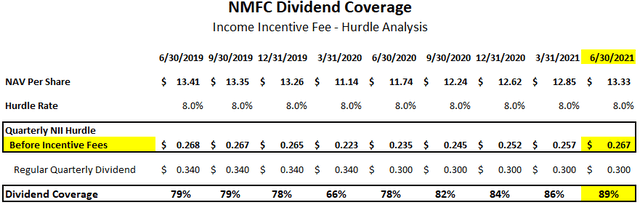
The ‘dividend coverage LTM’ is showing the average dividend coverage over the last 12 months (4 quarters) and is higher for GSBD due to fee waivers and lower for ORCC as the company was previously underleveraged. ORCC continues to increase leverage covering its dividend by 109% in Q3 2021 as discussed later.
GSBD Dividend Coverage Update
Author’s Note: The following information was provided to subscribers along with three quarters of financial projections using base, best, and worst-case assumptions to test the sustainability of the current dividends for GSBD.
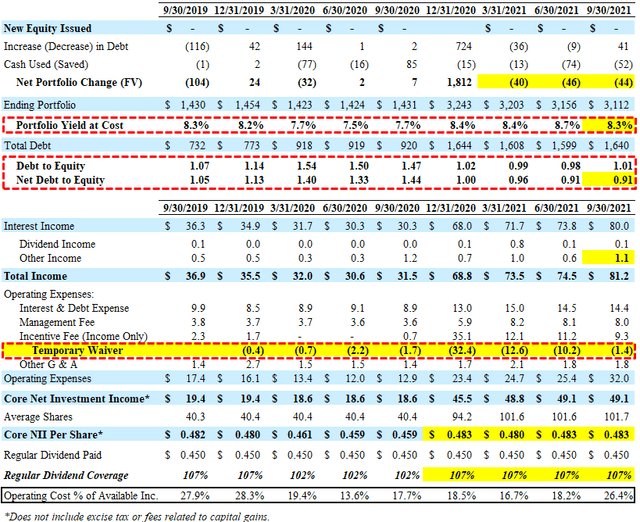
For Q3 2021, GSBD reported slightly below its best-case projections mostly due to an increase in accelerated accretion related to repayments and higher fee income partially offset by lower portfolio yield and lower portfolio growth (decline). Leverage (debt-to-equity) remains at its near-term low of 0.91 (net of cash) giving the company adequate growth capital for increased earnings potential. It should be noted that fee waivers continued to decline and were only $1.4 million.
I am expecting improved dividend coverage for GSBD over the coming quarters mostly due to:
Portfolio growth due to lower prepayments
Reinvesting the proceeds from Hunter Defense Technologies
Continued lower cost of borrowings
Higher portfolio yield from rotating into higher yield assets
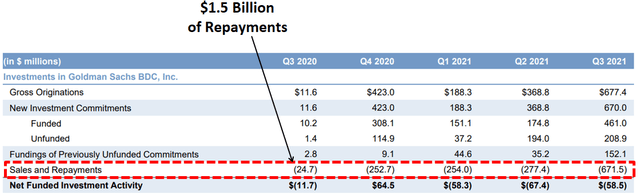
It is important to point out the GSBD remains below its targeted leverage due to $1.5 billion of repayments over the last 4 to 5 quarters which is meaningful given that its total portfolio is only $3.1 billion. However, management is not expecting the same level of repayments:
Elevated repayments continued unabated this quarter. At $672 million repayments equaled 21% of the fair value of investments at the beginning of the quarter and were 2.4 times greater than last quarter which itself was the previous high water mark repayments in the company’s nearly 10-year history. Repayments were diversified across the book with the single large repayment only amounted to less than 10% of the total. This is a somewhat remarkable level of portfolio turnover in a single quarter, there are a few takeaways I would offer for this unusual activity. First, I believe this repayment activity is a reflection of our focus on sectors and companies that continue to grow, perform well, and are therefore increasingly in investor favor. In an environment where M&A activity is high and equity evaluations are rising, it’s not surprising that high quality companies are either being sold or graduating to a lower cost of capital.”
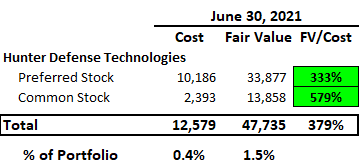
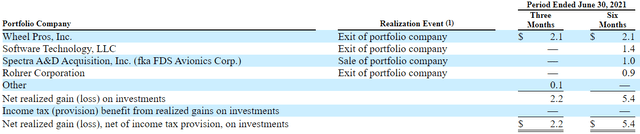
One of the repayments from Q3 2021 was Hunter Defense Technologies which accounted for almost $48 million or 1.5% of the portfolio driving a realized gain of almost $36 million or $0.35 per share. This was a non-income producing equity investment that will be reinvested into debt investments yielding at least 8% which is an additional ~$3.8 million of annual income.
During the quarter, we exited our equity position in Hunter Defense Technologies. Hunter Defense is a provider of shelters and ancillary products used primarily by the U.S. military in mobile troop deployments. The sale of the position generated a realized gain of $36 million. Hunter Defense was a previously non-income producing asset that’s been able to be monetized, recycled back into income producing assets.”
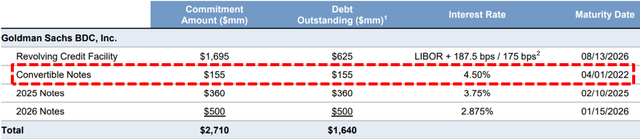
Similar to most BDCs, GSBD has been lowering its borrowing rates as well as constructing a flexible balance sheet including a public offering of $500 million of 2.875%unsecured notes due 2026. In August 2021, the company reduced the interest rate on its credit facility from LIBOR plus 2.00% to LIBOR plus 1.875%/1.75% which will be used to refinance its $155 million of 4.50% convertible notes on April 1, 2022. This will have a meaningful impact on earnings starting in Q2 2022:
There’s also tremendous tailwinds on the liability side of the balance sheet for the company here as well. I’m sure many of the investors in this space are following what’s going on in the financial markets for these assets. There’s typically generally a high correlation between if there’s pressure on asset yields, there’s also an opportunity on the liability side. For example, we’ve got our convertible bond which has a 4.5% coupon coming due early next year, that will be recycled. Our current plan would be to refinance that with our existing capacity under our revolving credit facility, which of course comes with a much lower cost of capital. I think there’ll be ongoing opportunities over the course of next year to do that, as well. So I think those are just a few things that I point to that that give us some optimism that there’s still really good opportunities to perform here.”
ORCC Dividend Coverage Update
Author’s Note: The following information was provided to subscribers along with three quarters of financial projections using base, best, and worst-case assumptions to test the sustainability of the current dividends for ORCC.
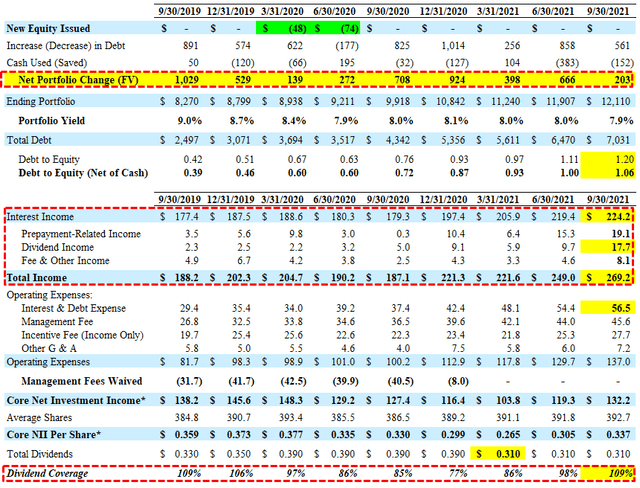
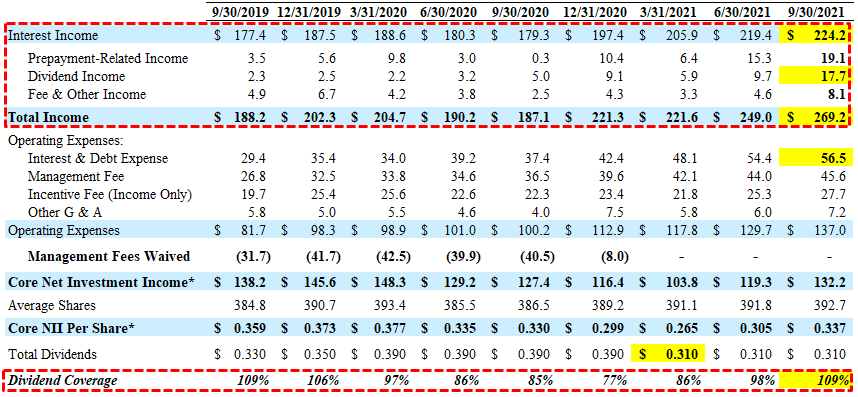
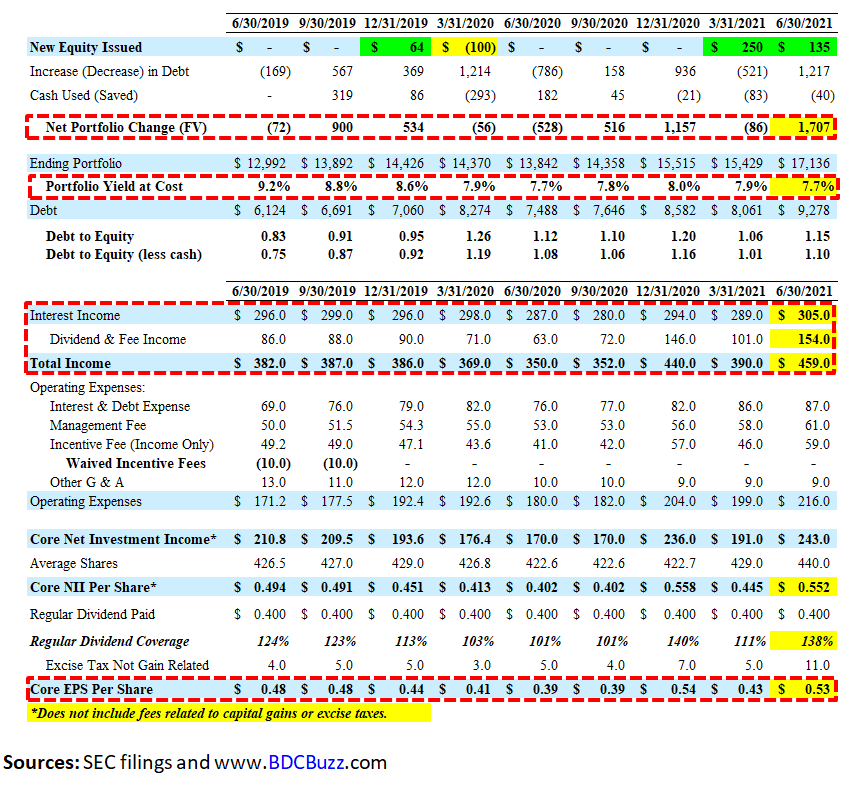
For Q3 2021, ORCC beat its best-case projected earnings due to higher-than-expected prepayment-related, dividend, and fee income as well as higher portfolio growth growing total income to the highest level of $269 million.
ORCC was not expected to cover its quarterly dividend but Core NII of $0.337 (excluding excise tax) covered 109% of its dividend of $0.310.
I am expecting improved dividend coverage for ORCC over the coming quarters mostly due to:
Increased dividend income from its Senior Loan Fund and Wingspire
Maintaining target leverage with new investments offsetting repayments
Additional prepayment fees and accelerated OID
Higher portfolio yield from rotating into higher yield assets
Continued lower cost of borrowings
ORCC continues to increase leverage and is now near the midpoint of its target debt-to-ratio between 0.90 and 1.25 (currently 1.06 excluding $780 million of available cash) giving the company plenty of growth capital.
We experienced a record level of originations this quarter which resulted in a fully ramped $12 billion-plus portfolio. We also had a record level of repayments. Prior to this quarter we had not yet seen the pace of repayments expected for a portfolio of our size but this trend finally materialized in the third quarter. We had more than $2 billion of repayments, which generated healthy fee and amortization income. At the same time, we’re able to seamlessly replace those repaid investments with equally attractive new investments of a similar credit quality and comparable economics, which has allowed us to finish the quarter in an equally strong position and with leverage comfortably in our target range. While this quarter may prove to be on the higher end, we do expect repayments to continue to exceed the levels we have seen in the last couple of years.”
Management is expecting another strong quarter partially due to higher prepayment-related income which has been taken into account with the updated financial projections and was discussed on the recent earnings call:
We had a significant amount of repayments this quarter, which drove a material increase in earnings from accelerated accretion and prepayment fees. While this is not a contractual earnings stream, we do expect repayment-related income to broadly stay around these levels in future quarters, as we expect that our repayments will remain at a more normalized pace, recognizing that the timing of repayments is idiosyncratic in any specific quarter.”
“We expect to see a healthy level, likely lower than this quarter’s record, but higher than previous quarters. Now that the portfolio is fully ramped, we will generally be targeting originations in line with repayments in order to maintain a fully levered, fully invested portfolio, and we have a strong backlog of attractive deals expected to close this quarter.”
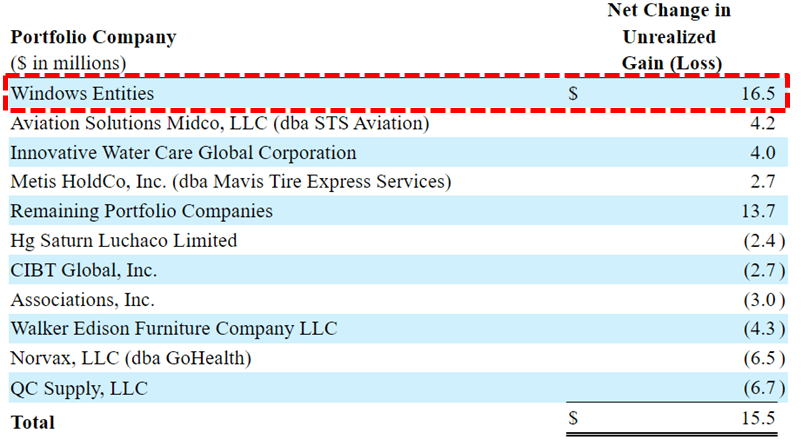
The increased dividend income was mostly related to equity investments in Windows Entities and Wingspire Capital Holdings that will likely continue over the coming quarters:
Our total investment income for the quarter, increased to $269 million, up $20 million from the prior quarter. This increase was primarily driven by dividend income, which increased by $8 million. We received our first dividend from Wingspire this quarter, as well as continued dividend income from Windows Entities and our senior loan fund. We expect dividend income from Wingspire and our senior loan fund to continue to increase as our committed capital is deployed.”
“Our investment in Wingspire, an asset-based lender to US-based middle market companies, with roughly $350 million of assets and very strong credit performance. We currently have approximately $195 million invested in Wingspire and see opportunities to invest more capital going forward. We expect Wingspire will be run rating at a high single-digit ROE by the end of this year and can generate a 10-plus percent ROE.”
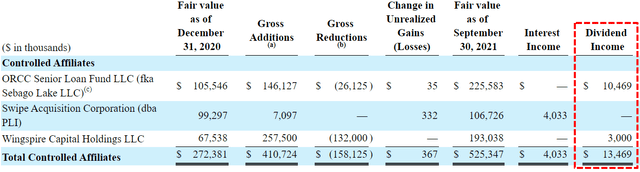
Also taken into account with the updated projections is additional dividend income from its ORCC Senior Loan Fund (previously Sebago Lake LLC) which now accounts for 1.9% of the total portfolio. Management is expecting this joint venture with Nationwide Life Insurance to eventually provide quarterly dividend income of $7 million:
“The other investment is in our Senior Loan Fund. As you recall, last quarter, we increased our equity commitment in the fund to $325 million and our economic ownership to 87.5%. The fund has already generated an attractive average quarterly ROE over the past three years of approximately 10%, and we will look to increase our capital invested over time.”
From previous call: “And so we’ll just be able to increase over time the amount of money ORCC has working and grow that number, when we get all that working it’s going to take some time should be we $7 million a quarter, which is I think terrific.”
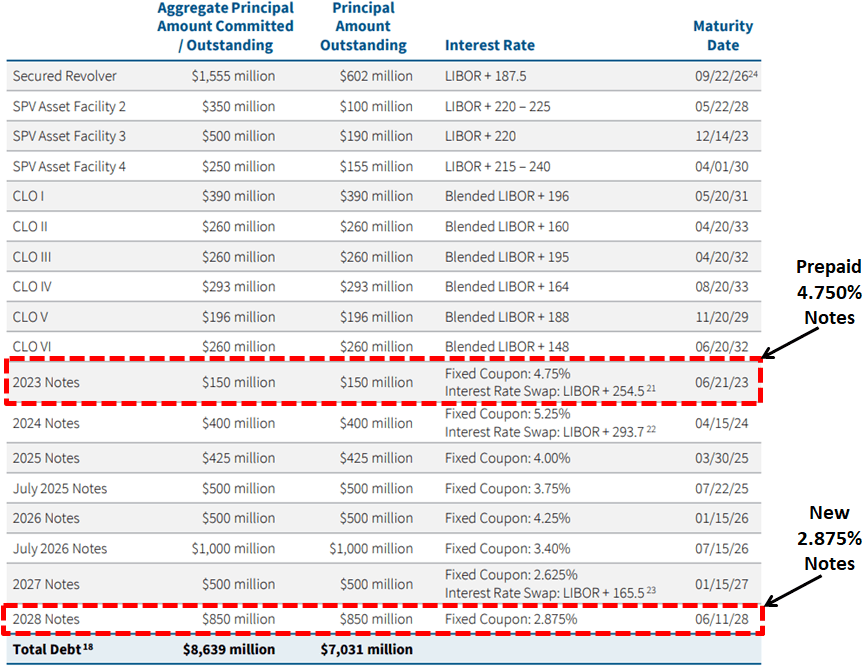
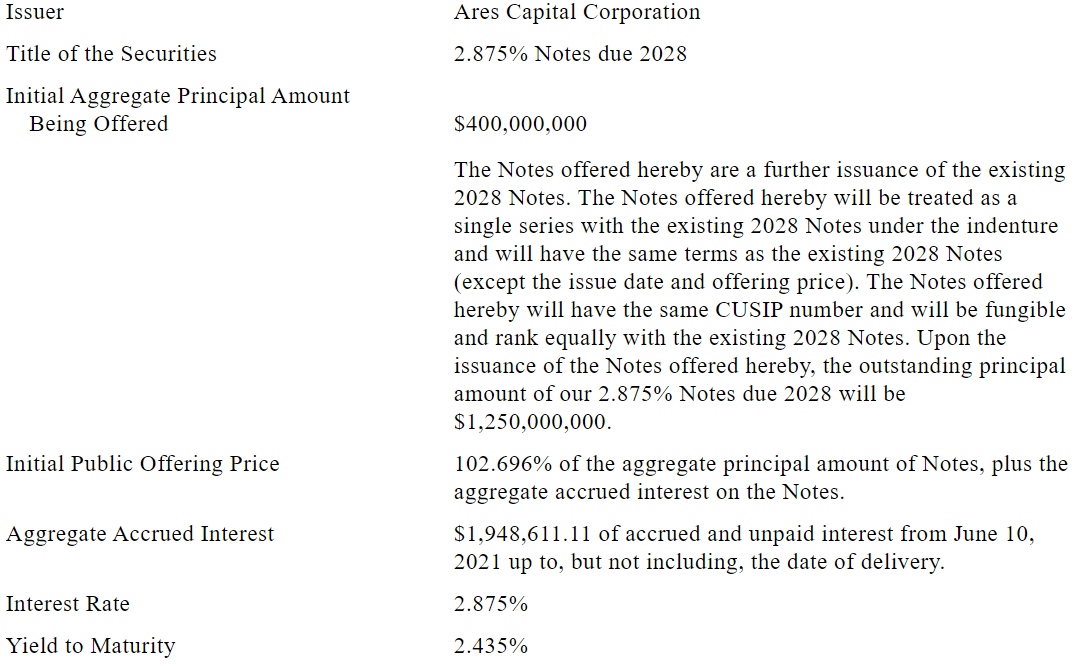
On November 23, 2021, ORCC announced the prepayment of its higher rate of 4.75% notes due 2023. In August 2021, the company issued another $400 million of its 2.875% notes due 2028. As of September 30, 2021, ORCC had around $2.4 billion of liquidity consisting of $780 million of cash and almost $1.6 billion of undrawn debt capacity (including upsizes).
Setting Target Prices
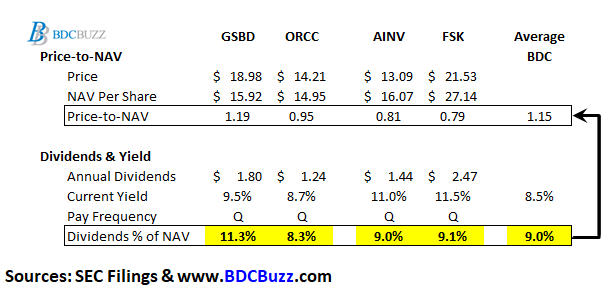
There are very specific reasons for the prices that BDCs trade driving higher and lower yields mostly related to portfolio credit quality and dividend coverage potential (not necessarily historical coverage). Also, and this is very important, the price-to-book/NAV is highly dependent on the amount of dividends that a BDC is paying as a percentage of NAV (but also taking into account risk profile and projected dividends).
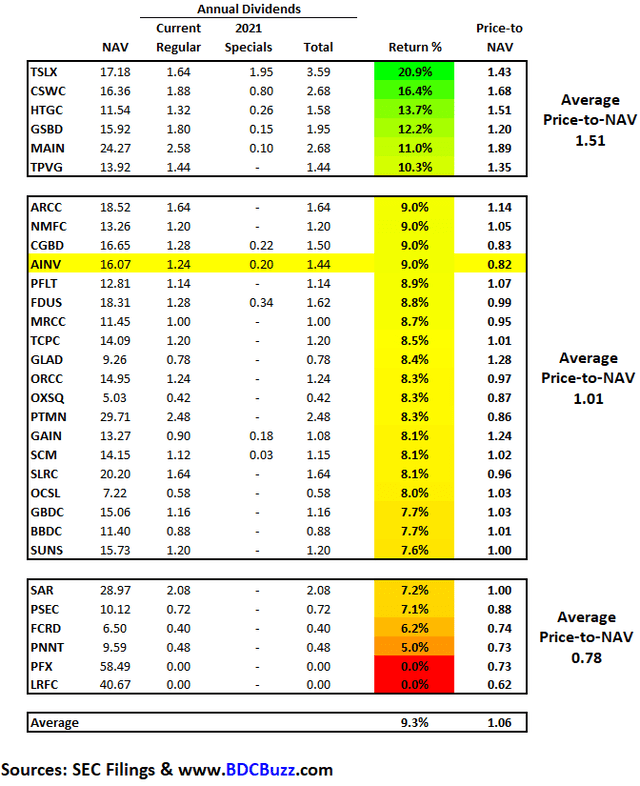
For example, GSBD is currently paying a regular quarterly dividend of $0.45 per share which is $1.80 annually and 11.3% of its current NAV per share ($1.80/$15.92). This is much higher than most BDCs which are currently averaging around 9.0% of NAV.
ORCC pays a regular quarterly dividend of $0.31 per share which is $1.24 annually and 8.3% of its current NAV per share ($1.24/$14.95).
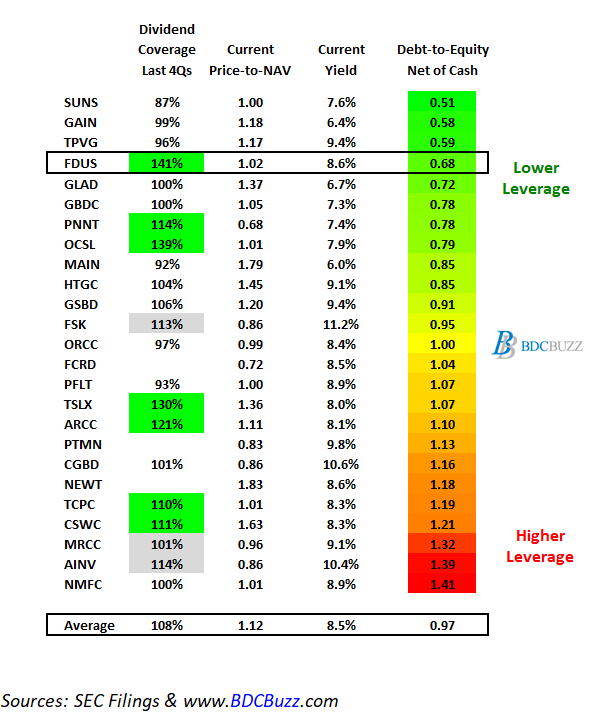
The last table from “Dividend Increase Coming For PennantPark” shows each BDC roughly categorized into groups of paying below 7.5%, 7.5% to 9.0% (including ORCC), and over 10.0% (including GSBD). If GSBD is able to maintain its regular dividend then the current pricing should be higher driving a yield closer to the average of 9.0% and its price-to-NAV closer to the other BDCs in the top group (paying over 10.0% of NAV).
Again, BDCs with higher quality credit platforms and management typically have higher quality portfolios and investors pay higher prices. This drives higher multiples to NAV and lower yields.
BDCs with lower expenses and higher potential dividend coverage typically have stable to growing dividends and investors pay higher prices. This drives higher multiples to NAV and lower yields.
What Can I Expect Each Week With a Paid Subscription?
Each week we provide a balance between easy to digest general information to make timely trading decisions supported by the detail in the Deep Dive Projection reports (for each BDC) for subscribers that are building larger BDC portfolios.
Monday Morning Update – Before the markets open each Monday morning we provide quick updates for the sector including significant events for each BDC along with upcoming earnings, reporting, and ex-dividend dates. Also, we provide a list of the best-priced opportunities along with oversold/overbought conditions, and what to look for in the coming week.
Deep Dive Projection Reports – Detailed reports on at least two BDCs each week prioritized by focusing on ‘buying opportunities’ as well as potential issues such as changes in portfolio credit quality and/or dividend coverage (usually related). This should help subscribers put together a shopping list ready for the next general market pullback.
Friday Comparison or Baby Bond Reports – A series of updates comparing expense/return ratios, leverage, Baby Bonds, portfolio mix, with discussions of impacts to dividend coverage and risk. This week we are providing a general market update with “suggested limit orders” for each BDC due to the expected volatility.
This information was previously made available to subscribers of Premium BDC Reports. BDCs trade within a wide range of multiples driving higher and lower yields mostly related to portfolio credit quality and dividend coverage potential (not necessarily historical coverage). This means investors need to do their due diligence before buying including setting target prices using the portfolio detail shown in this article (at a minimum) as well as financial dividend coverage projections over the next three quarters as discussed earlier.
The following information was previously provided to subscribers of Premium BDC Reports along with:
ORCC target prices/buying points
ORCC risk profile, potential credit issues, and overall rankings. Please see BDC Risk Profiles for additional details.
ORCC dividend coverage projections (base, best, worst-case scenarios). Please see BDC Dividend Coverage Levels for additional details.
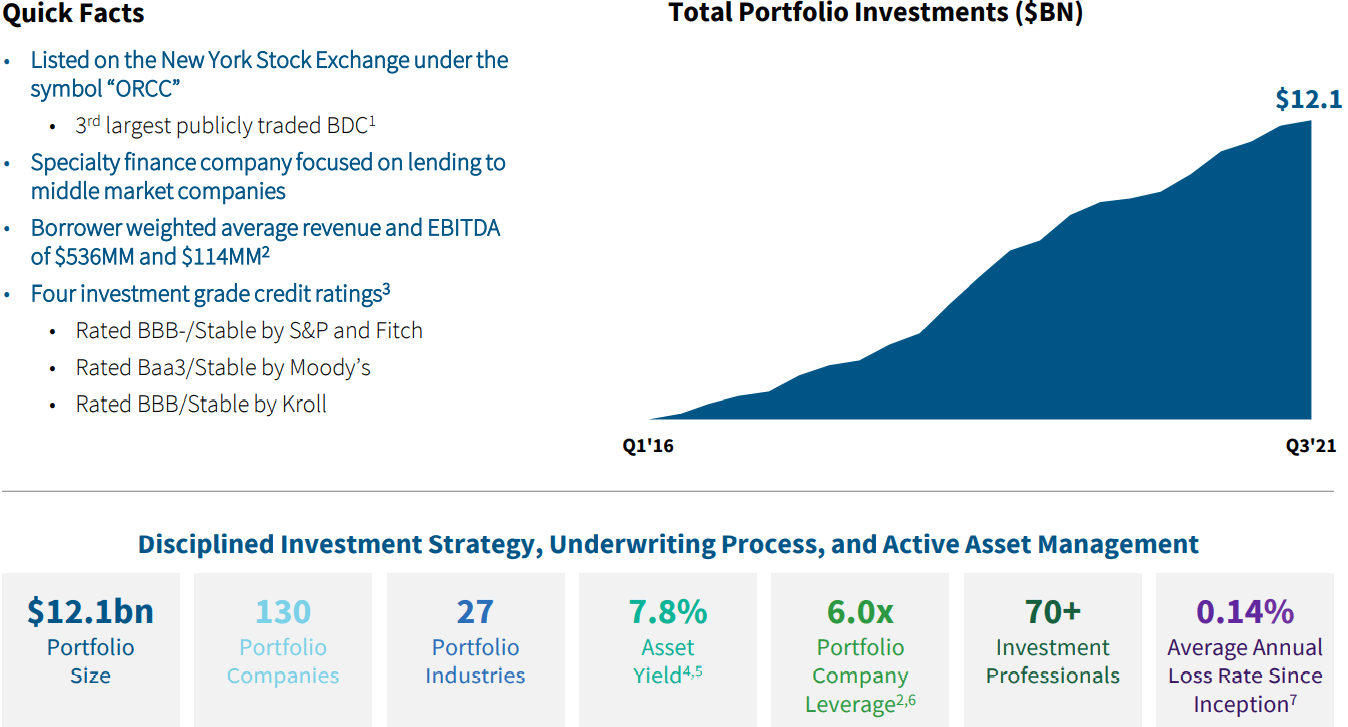
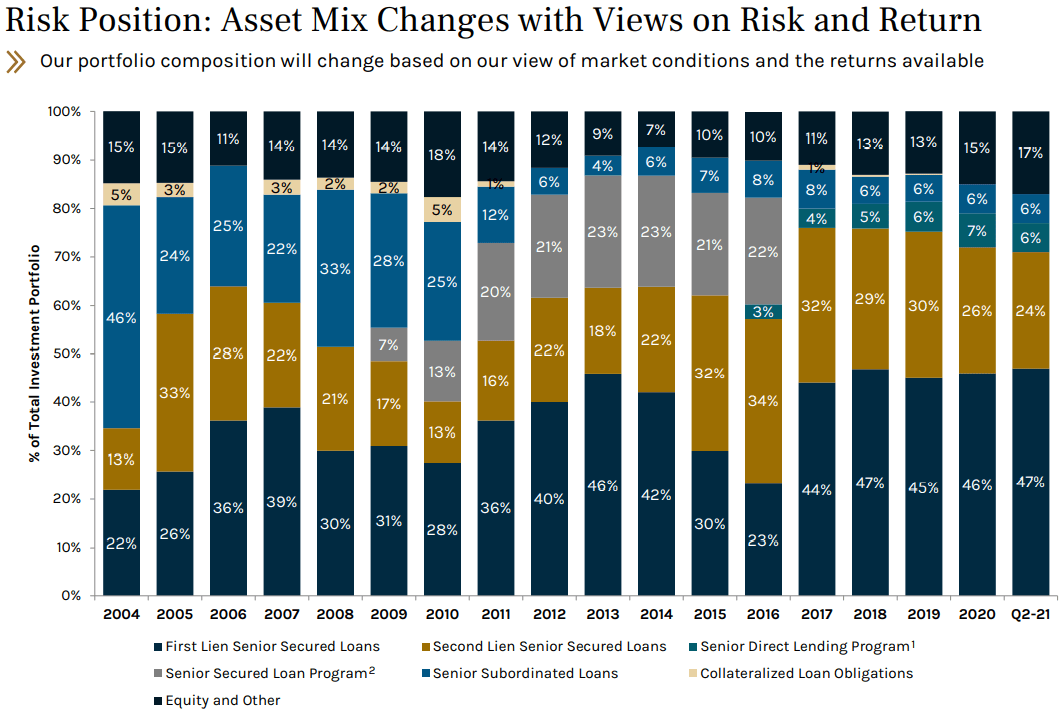
This update discusses Owl Rock Capital Corporation (ORCC) remains one of the best-priced BDCs especially for lower-risk investors that do not mind lower yields. ORCC is for risk-averse investors as the portfolio is mostly larger middle market companies that would likely outperform in an extended recession environment.
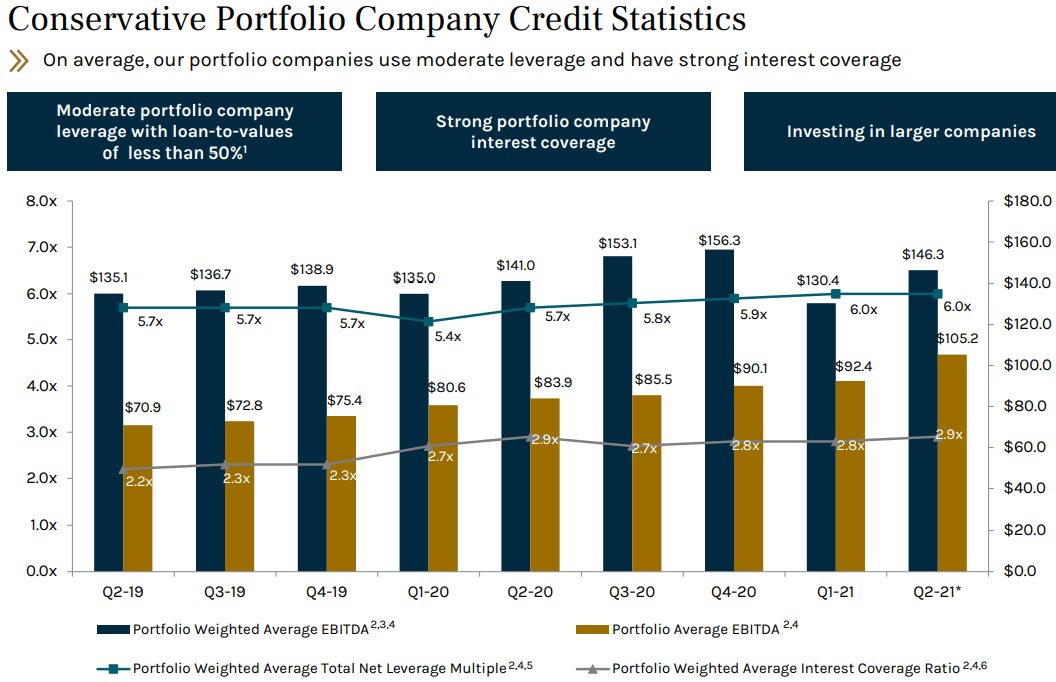
“We also continue to grow the size of the companies in our portfolio. The weighted average EBITDA of our borrowers is now $114 million, which is up from $95 million a year ago. In addition to allowing us to invest more efficiently, we believe larger companies are safer to lend to, and that has been borne out by our results over the last five years. This year, we have already evaluated more than 20 opportunities over $1 billion in size, and invested in or committed to eight of these, and continue to evaluate others. This trend continues to accelerate and is creating exciting opportunities for large direct lenders like Owl Rock.”
As predicted in previous reports, ORCC’s dividend coverage continues to improve mostly due to:
Increased dividend income from its ORCCSenior Loan Fund and Wingspire
Maintaining target leverage with new investments offsetting repayments
Additional prepayment fees and accelerated OID
Continued lower cost of borrowings
ORCC is the third-largest publicly traded BDC (much larger than MAIN, PSEC, GBDC, GSBD, NMFC, BXSL, HTGC, and AINV) with investments in 130 portfolio companies valued at around $12 billion that are mostly first-lien secured debt positions. ORCC is one of the few BDCs rated by all of the major credit agencies.
ORCC Dividend Coverage Update
ORCC’s longer-term (“LT”) target price takes into account improved dividend coverage over the coming quarters mostly due to:
Increased dividend income from its Senior Loan Fund and Wingspire
Maintaining target leverage with new investments offsetting repayments
Additional prepayment fees and accelerated OID
Higher portfolio yield from rotating into higher yield assets
Continued lower cost of borrowings
ORCC continues to increase leverage and is now near the midpoint of its target debt-to-ratio between 0.90 and 1.25 (currently 1.06 excluding $780 million of available cash) giving the company plenty of growth capital.
“We experienced a record level of originations this quarter which resulted in a fully ramped $12 billion-plus portfolio. We also had a record level of repayments. Prior to this quarter we had not yet seen the pace of repayments expected for a portfolio of our size but this trend finally materialized in the third quarter. We had more than $2 billion of repayments, which generated healthy fee and amortization income. At the same time, we’re able to seamlessly replace those repaid investments with equally attractive new investments of a similar credit quality and comparable economics, which has allowed us to finish the quarter in an equally strong position and with leverage comfortably in our target range. While this quarter may prove to be on the higher end, we do expect repayments to continue to exceed the levels we have seen in the last couple of years.”
“As a result of this activity our net leverage increased to 1.06 times roughly the midpoint of our target ranges of 0.90 to 1.25 times. I would expect that we would operate somewhere between there and 1.10 in sort of center of gravity.”
For Q3 2021, ORCC beat its best-case projected earnings due to higher-than-expected prepayment-related, dividend, and fee income as well as higher portfolio growth growing total income to the highest level of $269 million.
“We had been expecting to achieve full coverage of our $0.31 per share dividend sometime in the second half of 2021. With these strong results we have now achieved this milestone and are well-positioned to continue to fully earn our dividend going forward.”
Management is expecting another strong quarter partially due to higher prepayment-related income which has been taken into account with the updated financial projections and was discussed on the recent earnings call:
“We had a significant amount of repayments this quarter, which drove a material increase in earnings from accelerated accretion and prepayment fees. While this is not a contractual earnings stream, we do expect repayment-related income to broadly stay around these levels in future quarters, as we expect that our repayments will remain at a more normalized pace, recognizing that the timing of repayments is idiosyncratic in any specific quarter.”
“We expect to see a healthy level, likely lower than this quarter’s record, but higher than previous quarters. Now that the portfolio is fully ramped, we will generally be targeting originations in line with repayments in order to maintain a fully levered, fully invested portfolio, and we have a strong backlog of attractive deals expected to close this quarter.”
The increased dividend income was mostly related to equity investments in Windows Entities and Wingspire Capital Holdings that will likely continue over the coming quarters:
“Our total investment income for the quarter, increased to $269 million, up $20 million from the prior quarter. This increase was primarily driven by dividend income, which increased by $8 million. We received our first dividend from Wingspire this quarter, as well as continued dividend income from Windows Entities and our senior loan fund. We expect dividend income from Wingspire and our senior loan fund to continue to increase as our committed capital is deployed.”
“Our investment in Wingspire, an asset-based lender to US-based middle market companies, with roughly $350 million of assets and very strong credit performance. We currently have approximately $195 million invested in Wingspire and see opportunities to invest more capital going forward. We expect Wingspire will be run rating at a high single-digit ROE by the end of this year and can generate a 10-plus percent ROE.”
Also taken into account with the updated projections is additional dividend income from its ORCC Senior Loan Fund (previously Sebago Lake LLC) which now accounts for 1.9% of the total portfolio. Management is expecting this joint venture with Nationwide Life Insurance to eventually provide quarterly dividend income of $7 million:
“The other investment is in our Senior Loan Fund. As you recall, last quarter, we increased our equity commitment in the fund to $325 million and our economic ownership to 87.5%. The fund has already generated an attractive average quarterly ROE over the past three years of approximately 10%, and we will look to increase our capital invested over time.”
From previous call: “And so we’ll just be able to increase over time the amount of money ORCC has working and grow that number, when we get all that working it’s going to take some time should be we $7 million a quarter, which is I think terrific.”
On November 23, 2021, ORCC announced the prepayment of its higher rate of 4.75% notes due 2023. In August 2021, the company issued another $400 million of its 2.875% notes due 2028. As of September 30, 2021, ORCC had around $2.4 billion of liquidity consisting of $780 million of cash and almost $1.6 billion of undrawn debt capacity (including upsizes).
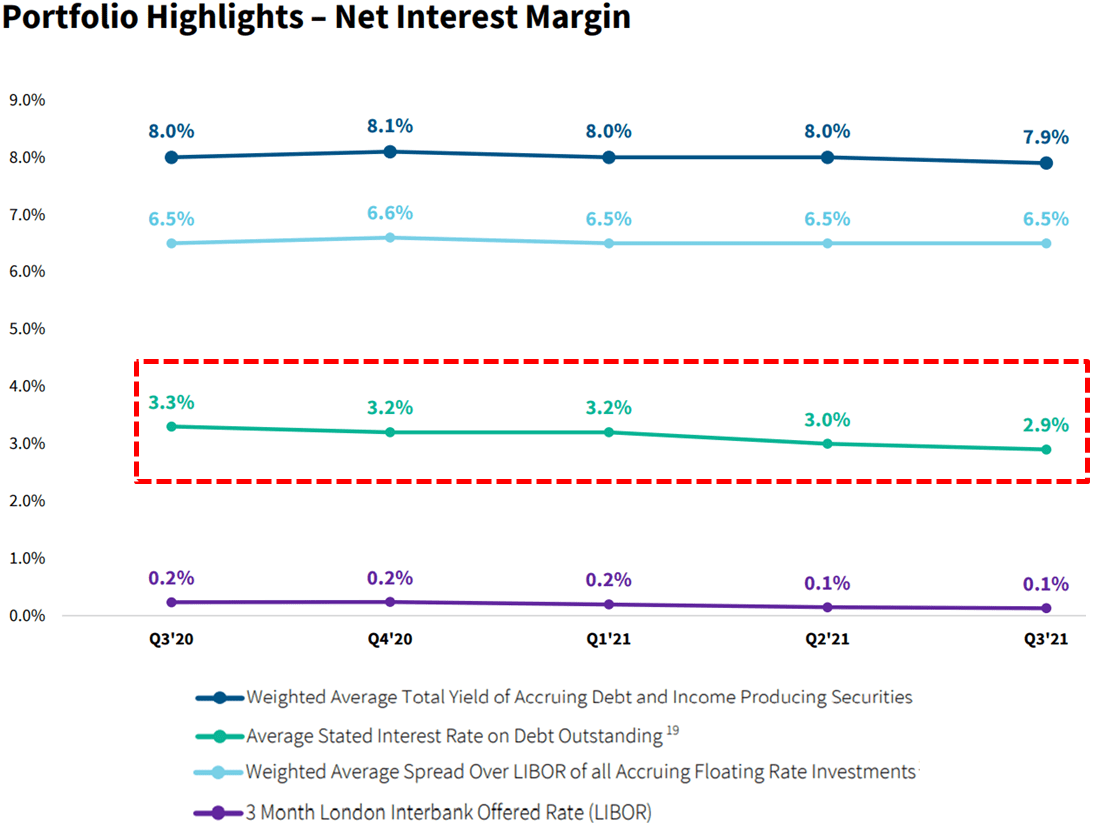
Similar to other BDCs, ORCC has been improving or at least maintaining its net interest margin which is the difference between the yield on investments in the portfolio and the rate of borrowings. During the most recently reported quarter, ORCC’s portfolio yield declined slightly but will likely trend higher over the coming quarters as the company rotates into higher yield assets “without sacrificing credit quality”:
“We continue to see an opportunity to improve our portfolio mix. We still have just over $1 billion of debt investments in the portfolio with a spread lower than 550 basis points. Our portfolio spread will benefit as these investments are repaid and we seek to redeploy this capital into higher spread investments, typically unitranches, which is an area where we have been able to achieve attractive pricing. There’s a portion of that $1 billion that I think there’s a reasonable chance we’ll get repaid in the next one to two quarters. And then there’s a portion that I think will take longer than that. There’s a portion in there that we might choose to sell over time and then there’s others that probably aren’t easily sold because there’s not other lenders in the credit with us, not from a credit reason.”
ORCC’s average borrowing rate has declined from 4.6% to 2.9% over the last 7 quarters due to continued issuances of notes and CLOs at lower rates.
For Q3 2021, ORCC beat its best-case projected earnings due to higher-than-expected prepayment-related, dividend, and fee income as well as higher portfolio growth growing total income to the highest level of $269 million.
“primarily due to an increase in our investment portfolio. Included in interest income is dividend income, which increased period over period, and other fees such as prepayment fees and accelerated amortization of upfront fees from unscheduled paydowns.”
ORCC was not expected to cover its quarterly dividend but Core NII of $0.337 (excluding excise tax) covered 109% of its dividend of $0.310.
The Board declared a Q4 2021 dividend of $0.31 per share for stockholders of record as of December 31, 2021, payable on or before January 31, 2022.
“We are very pleased to report strong results this quarter. We experienced a record level of both originations and repayments and were able to seamlessly redeploy capital from those repaid investments into equally attractive new investments. We are very proud of where our portfolio stands today and to achieve the important milestone of earning our dividend from net investment income this quarter with continued strong credit.”
ORCC Quick Risk Profile Update
Two of its smaller first-lien loans to QC Supply were added to non-accrual status during Q2 2021 and marked down again during Q3 2021. Also, CIBT Global, Inc. remains on non-accrual and was also marked down as shown in the following table. Please keep in mind that ORCC has 130 portfolio companies so there will always be a certain amount on non-accrual which currently account for 0.4% of the total portfolio fair.
“We are carefully monitoring the current headwinds caused by the labor shortages and supply chain disruptions. To date, we have not seen a material impact as many of our companies are services businesses, which have modest exposure to the manufacturing economy. For example, some of our largest sectors are software, insurance, and health care, which are not as exposed to the current economic headwinds. In line with last quarter, our nonaccruals remained low with only two investments on non-accrual status, representing 0.4% of the portfolio based on fair value. One of the lowest levels in the BDC sector and our annualized loss ratio is 14 basis points.”
ORCC’s portfolio is mostly larger middle market companies that would likely outperform in an extended recessionary environment.
“We also continue to grow the size of the companies in our portfolio. The weighted average EBITDA of our borrowers is now $114 million, which is up from $95 million a year ago. In addition to allowing us to invest more efficiently, we believe larger companies are safer to lend to, and that has been borne out by our results over the last five years.”
“We generally favor bigger companies for our portfolio. This year, we have already evaluated more than 20 opportunities over $1 billion in size, and invested in or committed to eight of these and continue to evaluate others. This trend continues to accelerate and is creating exciting opportunities for large direct lenders like Owl Rock. We believe we are especially well-positioned for this due to our scale platform with a full suite of financing solutions, large, deeply experienced team with strong relationships in the financial sponsor community.”
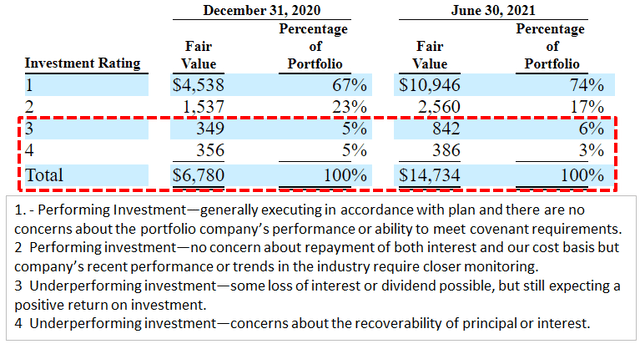
Investments Rating 3 or 4 which are borrowers performing “below” or “materially below” expectations indicating that the loan’s risk had increased “somewhat” or “materially” continue to decline and are now only 9.0% of the portfolio.
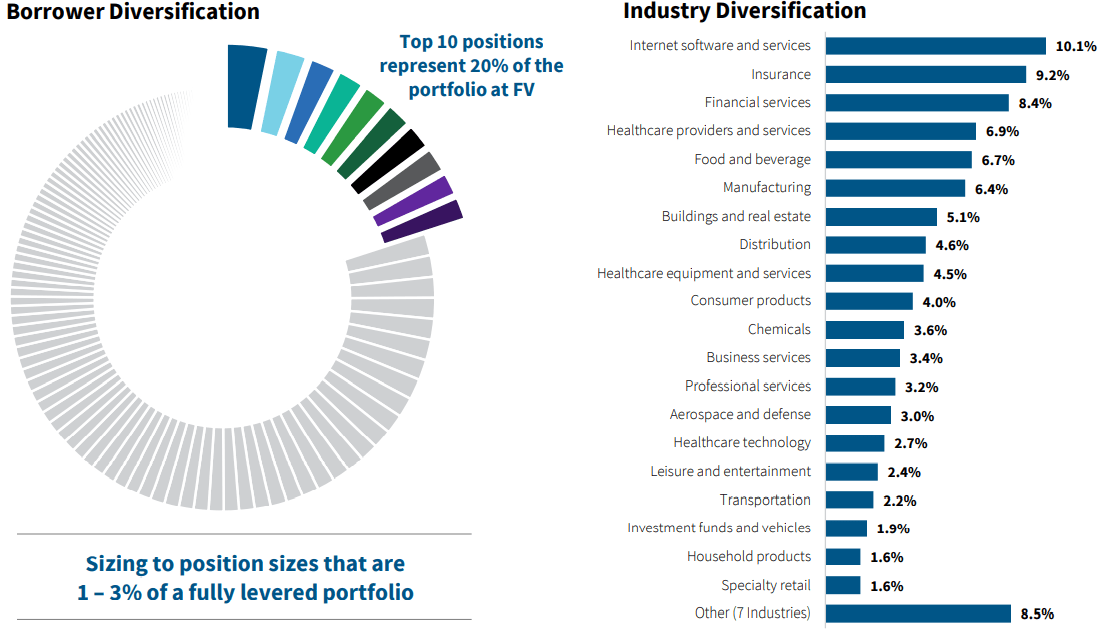
The portfolio is highly diversified with the top 10 positions accounting for around 20% of the portfolio with low cyclical exposure including retail, oil, energy, and gas.
During Q3 2021, its net asset value (“NAV”) per share increased by 0.4% due to overearning the dividend and unrealized portfolio appreciation including its equity position in Windows Entities. Please note that ORCC is for lower-risk investors with less equity participation in portfolio companies which typically drives NAV per share volatility for certain BDCs.
“Net asset value per share increased to $14.95, up $0.05 from last quarter. This increase was primarily driven by the growth in our net investment income, which exceeded our dividend by $10 million, as well as from $12 million of unrealized gains.”
What Can I Expect Each Week With a Paid Subscription?
Each week we provide a balance between easy to digest general information to make timely trading decisions supported by the detail in the Deep Dive Projection reports (for each BDC) for subscribers that are building larger BDC portfolios.
Monday Morning Update – Before the markets open each Monday morning we provide quick updates for the sector including significant events for each BDC along with upcoming earnings, reporting, and ex-dividend dates. Also, we provide a list of the best-priced opportunities along with oversold/overbought conditions, and what to look for in the coming week.
Deep Dive Projection Reports – Detailed reports on at least two BDCs each week prioritized by focusing on ‘buying opportunities’ as well as potential issues such as changes in portfolio credit quality and/or dividend coverage (usually related). This should help subscribers put together a shopping list ready for the next general market pullback.
Friday Comparison or Baby Bond Reports – A series of updates comparing expense/return ratios, leverage, Baby Bonds, portfolio mix, with discussions of impacts to dividend coverage and risk.
This information was previously made available to subscribers of Premium BDC Reports. BDCs trade within a wide range of multiples driving higher and lower yields mostly related to portfolio credit quality and dividend coverage potential (not necessarily historical coverage). This means investors need to do their due diligence before buying including setting target prices using the portfolio detail shown in this article (at a minimum) as well as financial dividend coverage projections over the next three quarters as discussed earlier.
The following information was previously provided to subscribers of Premium BDC Reports along with:
AINV target prices/buying points
AINV risk profile, potential credit issues, and overall rankings. Please see BDC Risk Profiles for additional details.
AINV dividend coverage projections (base, best, worst-case scenarios). Please see BDC Dividend Coverage Levels for additional details.
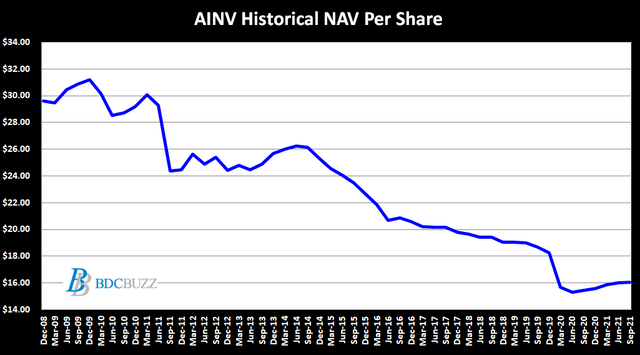
This update discusses Apollo Investment (AINV) which is one of the larger or at least more established BDCs that I do not write much about only due to being higher risk and typically not a good fit for longer-term investors. Management previously took on too much risk including concentration risk in the wrong sectors and there will likely be continued realized losses over the coming quarters including investments discussed in this article.
Setting Target Prices
Author’s Note: Many readers are constantly focused on BDCs trading at a “discount” or “premium” to net asset value (“NAV”) but not necessarily understanding the reasons. Trading at a premium is a good thing for longer-term investors. Buy more during market volatility to dollar average your purchases.
There are very specific reasons for the multiples that BDCs trade driving higher and lower yields mostly related to portfolio credit quality and dividend coverage potential (not necessarily historical coverage). Also, and this is very important, the price-to-book/NAV is highly dependant on the amount of dividends that a BDC is paying as a percentage of NAV (but also taking into account risk profile and projected dividends).
The following table shows each BDC roughly categorized into groups of paying below 7.5%, 7.5% to 9.0%, and over 10.0%. Again, there are ranges within these groups based on risk profile and projected dividends which is why most of my articles (including this one) discuss these categories providing the details so that readers can set appropriate target prices. AINV trades at a lower multiple (should be around 1.00 times NAV for the dividends paid) likely due to upcoming dividend coverage issues and realized losses discussed below. Also, using only the regular quarterly dividend of $0.31 per share would be $1.24 per annually which is only 7.7% of NAV and likely more appropriate given the direction of the portfolio toward lower yield assets (that is a good thing).
AINV Advisory Fee Agreement
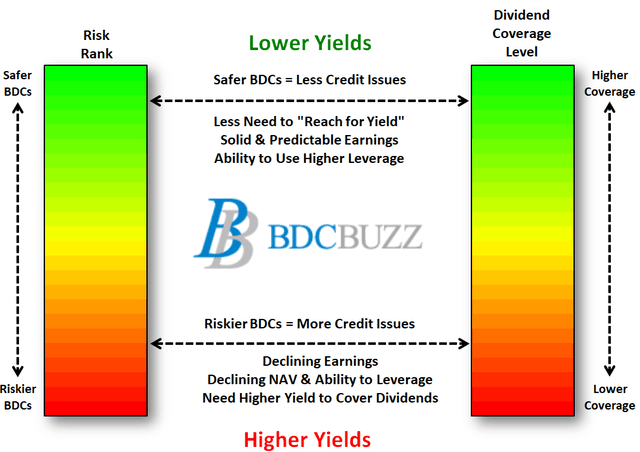
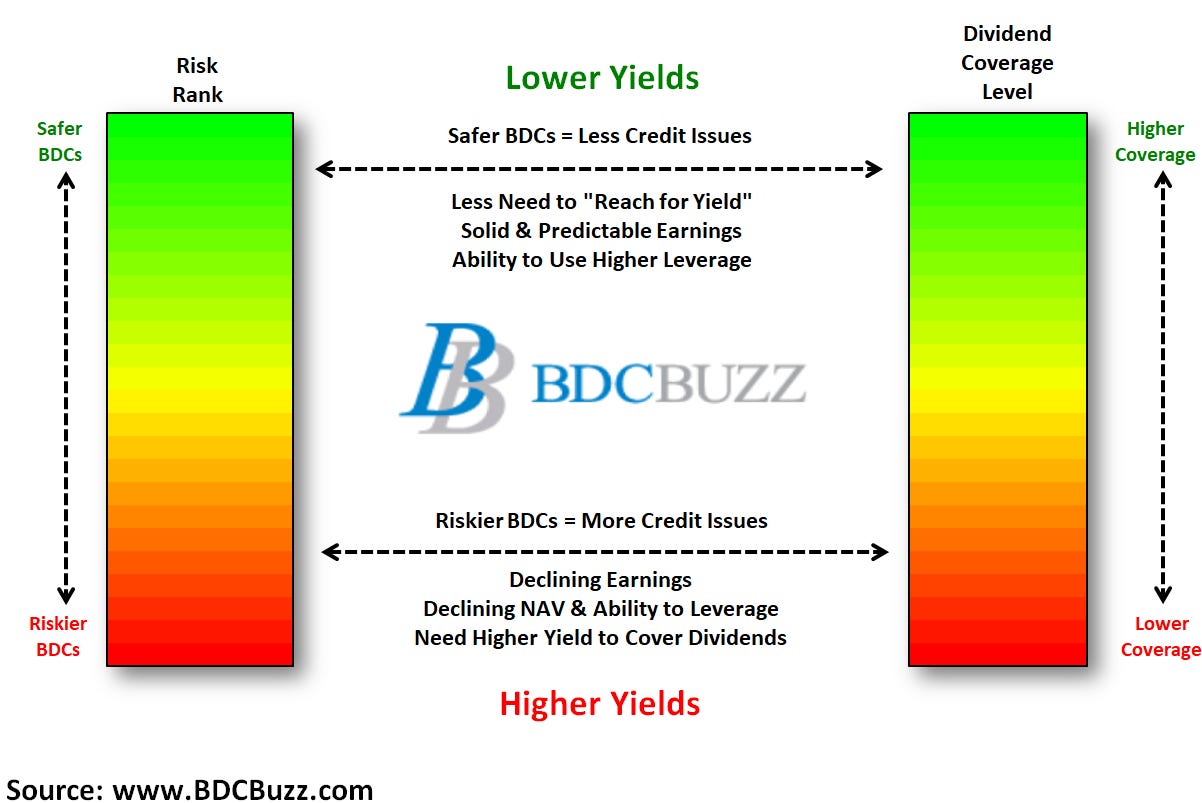
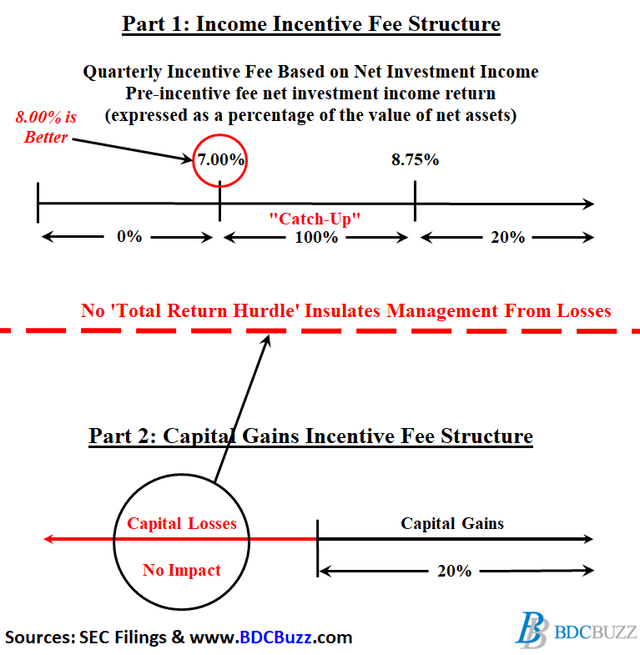
The older incentive fee structures can incentivize management to take on increased risk with investors’ capital. Management benefits from higher yields (through higher income incentive fees) with less risk related to future credit issues because capital losses are not included when calculating income incentive fees. This could encourage management to take higher risks (for increased yields) due to being insulated from potential capital losses when calculating the income portion of the incentive fees as shown in the diagram below. Ultimately, management could receive higher fees during periods of declining NAV per share, resulting in lower total returns to shareholders.
Many of the newer fee structures have a ‘total return’ hurdle taking into account realized/unrealized losses when calculating income incentive fees for management, with a look-back feature to keep management on the hook for the performance of investments over the long term.
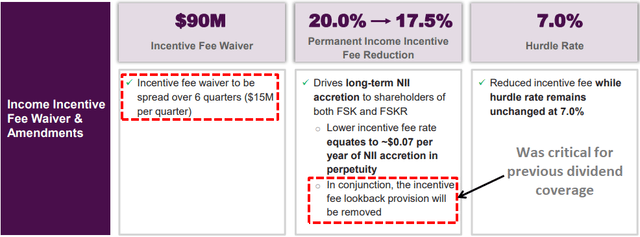
Unfortunately, many of the higher risk BDCs do not have total return hurdles including Prospect Capital (PSEC) and more recently FS KKR Capital (FSK) which removed this feature as discussed earlier this month in “FS KKR Capital: Dividend Decrease Coming“.
However, AINV has higher quality management that previously added this feature to their fee agreement and as mentioned on the recent call:
The total return requirement closely aligns the incentives of our manager with the interest of our shareholders.”
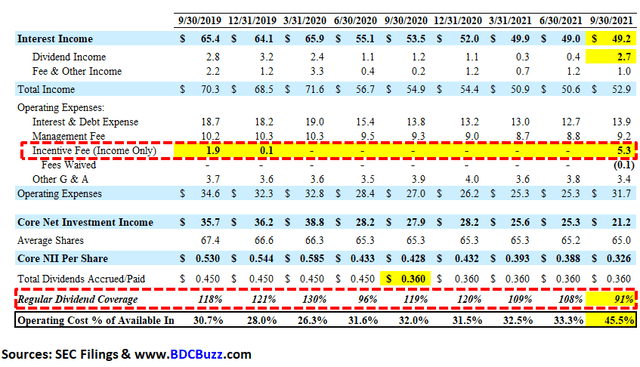
Since 2018, AINV has covered its dividend only due to no incentive fees paid driven by the total return hurdle and previous realized/unrealized losses. However, the company is now paying full incentive fees with a meaningful impact on dividend coverage as discussed later.
Net investment income for the quarter reflects a full incentive fee. Prior to the September quarter, AINV had not paid any incentive fee since the quarter ended December 2019. As a reminder, AINV’s incentive fee on income includes a total return hurdle with a rolling 12 quarter look back. Given the reversal of unrealized losses during the look back period, the manager earned a full 20% incentive during the quarter.”
Source: AINV Earnings Call
AINV Risk Profile Update
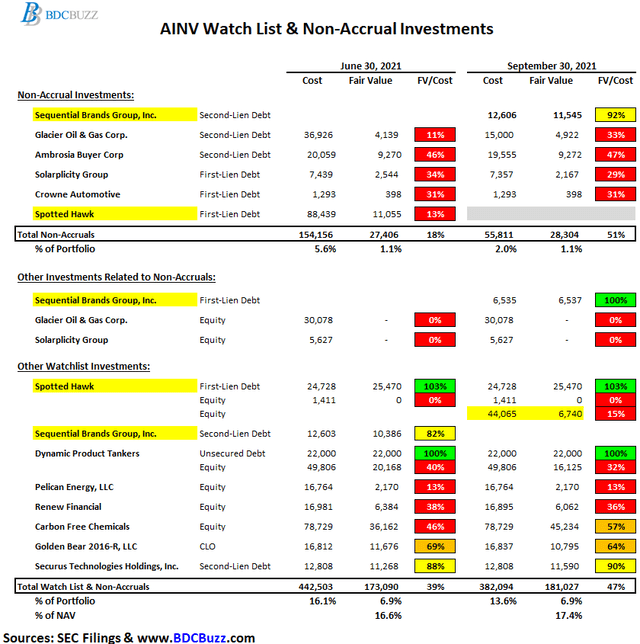
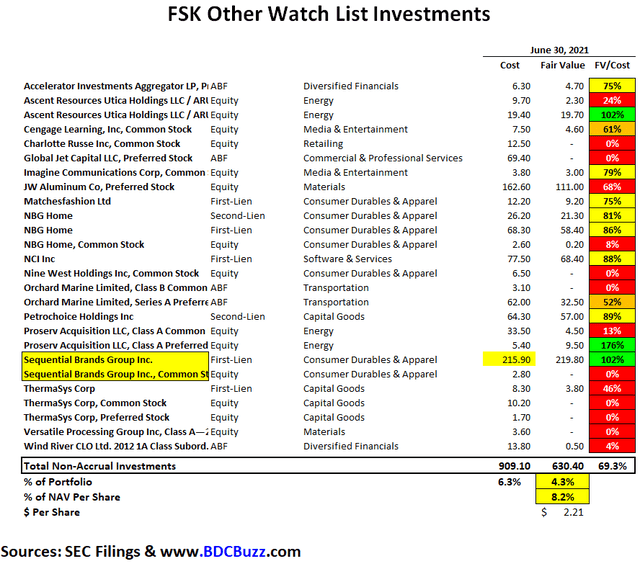
During calendar Q3 2021, its second-lien position in Sequential Brands Group, Inc. was added to non-accrual status but marked up during the quarter due to likely being resolved during Q4 2021:
Our second lien position in Sequential Brands was placed on non-accrual status during the quarter. Sequential Brands owns managers and licenses, a portfolio of consumer brands in the active and lifestyle categories. The company filed for Chapter 11 bankruptcy in August and is seeking an orderly liquidation of the brands in this portfolio. Our second lien position was marked at 92 at the end of September compared to 82 at the end of June. The mark at the end of September reflects the liquidation process and the resolution of our current position, which is expected to occur in the December quarter. At the end of September investments on non-accrual status totaled $28 million, or 1.1% of the total portfolio at fair value.”
Source: AINV Earnings Call
Sequential Brands is also held by FS KKR Capital (FSK) which is another higher-risk BDC and discussed this investment on its recent earnings call:
On November 3, the judge approved the sales without objections. We expect closing for the various sales to occur before November 14, proceeds leave to pay back a 100% of the DIP loans, we, and another lender provided fund a wind down reserve and provide a recovery on our loan. Pursuant to the contemplated transactions, we expect to receive a combination of cash, as well as newly structured debt and equity in the buyer of the active division.”
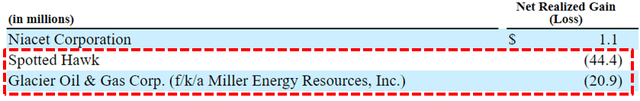
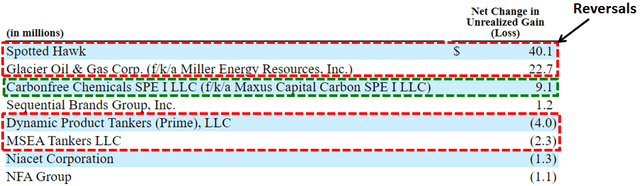
As predicted in the previous report there were additional realized losses of $65 million or $1.00 per share due to its non-accrual investments in Spotted Hawk and Glacier Oil & Gas. AINV has been working to restructure its first-lien position in Spotted Hawk which was converted to equity with no additional impact to its NAV per share and no longer on non-accrual status.
During the quarter Spotted Hawk completed restructuring of its balance sheet our second lien position tranche A was converted to equity in our third lien position tranche B was cancelled. Both of these positions were previously on non-accrual status. The valuation of our investment in Spotted Hawk was not impacted by this restructuring.”
Source: AINV Earnings Call
Source: AINV SEC Filing
Non-accruals remain around 1.1% of the portfolio fair value due to adding Sequential Brands offset by restructuring Spotted Hawk and Glacier Oil & Gas as mentioned earlier. Again, there will likely be continued realized losses over the coming quarters including previously discussed investments some of which are included in the following table. These investments alone account for $201 million or $3.11 per share of previous unrealized losses but still account for almost 7% of the total portfolio fair value and 17.4% of NAV per share.
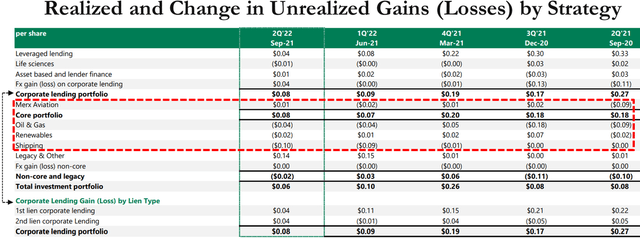
Net asset value (“NAV”) per share increased by $0.05 or 0.3% (from $16.02 to $16.07) mostly due to Carbonfree Chemicals (same as previous quarter) as well as accretive share issuances partially offset by shipping investments (same as previous quarter) Dynamic Product Tankers and MSEA Tankers and not adequately covering the dividends (missing by $0.034 per share).
We ended the quarter with net asset value per share of $16.07, up $0.05 or 0.3%, driven by our corporate lending portfolio, which continues to perform well as well as the accretive impact of stock buybacks. We’re in the September quarter or corporate lending, portfolio had a gain of $5 million or $0.08 per share partially offset by $1.3 million or $0.02 per share on non core and legacy assets. The net loss on non core and legacy assets reflects net losses on oil and gas renewables and shipping investments, partially offset by a gain on carbon-free legacy investments.”
Source: AINV Earnings Call
Source: AINV SEC Filing
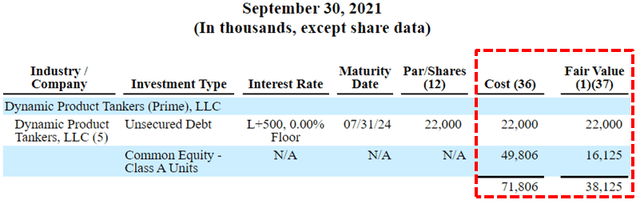
Same as the previous quarter, the largest markdown was its equity position in Dynamic Product Tankers which is a shipping business 85% owned by AINV (since 2015) discussed in previous reports. As shown below, AINV currently has a $22 million subordinated loan due July 2024 at a very low rate of LIBOR +500 basis points and continues to mark down its equity position currently 32% of cost accounting for almost $34 million or $0.52 per share of unrealized losses.
Source: AINV SEC Filing
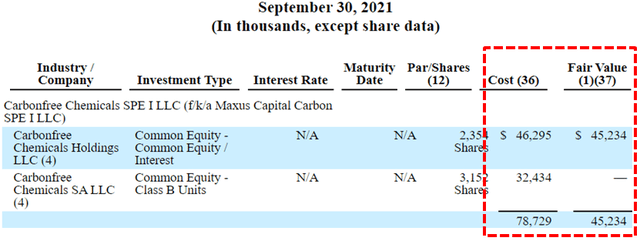
Also discussed in previous reports, AINV restructured its first-lien loans to Carbonfree Chemicals and now owns 27% of the company. The equity portion has been marked up during the recent quarters and is now valued at 57% of cost but needs to be watched as it could result in higher (or lower) NAV over the coming quarters. Carbonfree produces proprietary technologies that capture and reduce carbon emissions by producing chemicals such as limestone and baking soda for sale or for long term storage and could benefit from the current administration.
Management discussed on the recent call:
Regarding carbon-free, as a reminder, our investment in carbon-free consists of an investment in the company’s proprietary carbon capture technologies and an investment in the company’s chemical plant. Carbon-free is benefiting from strong interest in carbon capture, utilization and storage as part of broader ESG trends. We believe carbon-free is a leader in this space, as evidenced by partnerships announced during the quarter, which demonstrate market acceptance for its technology.”
Source: AINV Earnings Call
Source: AINV SEC Filing
Source: AINV Earnings Presentation
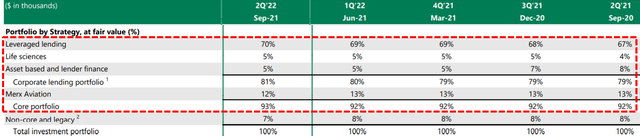
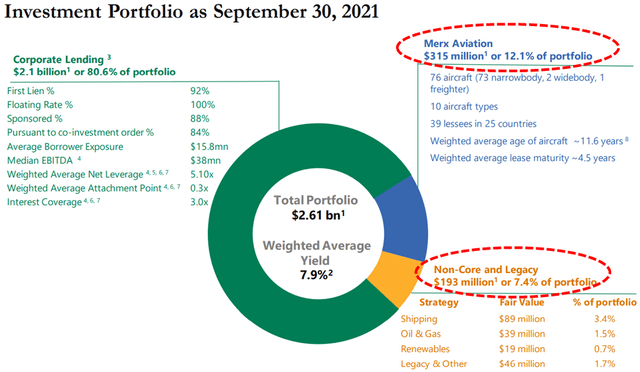
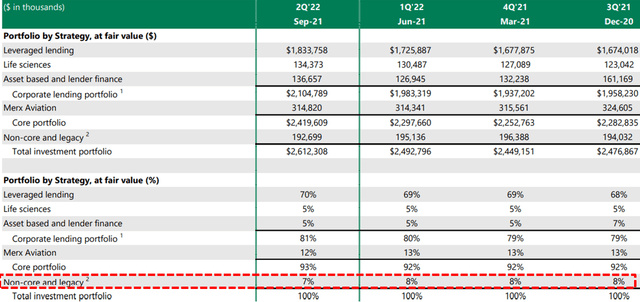
Since 2016, the company has been repositioning the portfolio into safer assets including reducing its exposure to oil & gas, unsecured debt, and CLOs. The “core strategies” portion of the portfolio remains around 92.6% of all investments and includes Merx:
We continue to make good progress increasing our exposure to first lien floating rate corporate loans, while reducing our exposure to junior capital and non-core positions. Repayments during the quarter included the exit to second lien investments, as well as a small partial pay down from one of our shipping investments. We remain focused on reducing our exposure to the remaining non-core assets, while ensuring an optimal outcome for our shareholders.”
Source: AINV Earnings Call
Source: AINV Earnings Presentation
Source: AINV Earnings Presentation
Its aircraft leasing through Merx Aviation remains the largest investment and is around 12% of the portfolio and was discussed on the call including “the level of lease revenue generated from our fleet has stabilized” and “continues to benefit from a growing servicing business which has increased in value over time”:
Moving to Merx. The overall air traffic environment appears to be improving, particularly in the US. We’re optimistic that demand for air traffic will continue to grow with the ongoing rollout of the vaccine and the lifting of travel restrictions. Furthermore, the aircraft leasing market will continue to be an important and growing percentage of the world fleet, as airlines will increasingly look at third-party balance sheets to finance their operating assets. Specific to our investment, as Howard mentioned, we believe Merx has successfully navigated the significant disruption caused by the COVID-19 pandemic. The level of lease revenue generated from our fleet has stabilized. We have worked through our exposure to airlines that have undergone restructurings. We have been able to remarket aircraft during the period with long term leases or sales. And Merx continues to benefit from a growing servicing business which has increased in value over time. Given the stabilization of Merx, during the quarter we recast at $4.5 million of Merx equity into debt, and as Howard mentioned, AINV received $6.9 million of interest income from Merx during the September quarter, $2.1 million more than last quarter. Merx remains focused on remarketing aircraft that are due to come off lease via extensions, with existing lessees releasing to other airlines on long term leases or sales. During the September quarter, Merx sold two aircraft and signed lease extensions for six aircraft. Our lease maturity schedule is well staggered. We believe Merx’s portfolio compares favorably with other major lessors in terms of asset, geography, age, maturity and lessee diversification. Merx’s portfolio is skewed towards the most widely used types of aircraft, which means demand for Merx’s fleet is anticipated to be resilient. Merx’s fleet primarily consists of narrow body aircraft serving both US and foreign markets. The Apollo aviation platform will continue to seek to opportunistically deploy capital. To be clear, Merx has focused on its existing portfolio, and is not seeking to materially grow its balance sheet portfolio.”
Source: AINV Earnings Call
Management was also asked about the impacts of inflationary pressure on its portfolio companies:
Q. “There’s some inflationary pressures and wage pressures, what’s the biggest risk economically as you’re thinking about as you’re deploying capital?”
A. “We’ve talked about over an extended period of time, the best defense to that is sort of granularity and diversity. So, that — like any of these risks don’t expose you across the portfolio. It’s why we’ve always said like one of the key aspects is to have a very wide funnel, have a diversity of products, and be able to be as selective as you can be in a market like this. It’s a very benign environment this minute. But you can see all sorts of things that could potentially come your way. So, we take a very — we take portfolio construction very seriously. And then on individual credits, try to look out at the specific risks we see coming to see how they can absorb.”
Source: AINV Earnings Call
AINV Dividend Coverage Update
Author’s Note: The following information was provided to subscribers along with 3 quarters of financial projections using base, best, and worst-case assumptions to test the sustainability of the current dividends.
On November 4, 2021, the Board declared a distribution of $0.31 per share plus a supplemental distribution of $0.05 per share payable on January 6, 2022, to shareholders of record as of December 20, 2021. Investors should expect dividend coverage to “fluctuate” over the coming quarters but management is committed to paying the regular quarterly distribution of $0.31 plus the supplemental distribution of $0.05 through March 31, 2022, as discussed on the recent call:
The board has declared a base distribution of $0.31 per share, and a supplemental distribution of $0.05 per share, both distributions are payable on January 6 2022, to shareholders as a record on December 20 2021. I’d like to remind everyone that as we’ve indicated previously, we intend to declare a quarterly based distribution of $0.31 per share, and a quarterly supplemental distribution of $0.05 per share for at least one more quarter.”
Source: AINV Earnings Call
As mentioned earlier, the distributions have been covered only through fee waivers and not paying the full incentive fees. However, the company is now paying full incentive fees with a meaningful impact on dividend coverage as predicted in previous reports.
Net investment income for the quarter reflects a full incentive fee. Prior to the September quarter, AINV had not paid any incentive fee since the quarter ended December 2019. As a reminder, AINV’s incentive fee on income includes a total return hurdle with a rolling 12 quarter look back. Given the reversal of unrealized losses during the look back period, the manager earned a full 20% incentive during the quarter. The total return requirement closely aligns the incentives of our manager with the interest of our shareholders.”
Source: AINV Earnings Call
AINV’s recurring interest income has recently declined to its lowest level over the last 15 years and is now below $50 million.
The quarter-over-quarter decline in interest income was attributable to the pace of the investment activity and a relatively higher yield on repayments versus fundings.”
Source: AINV Earnings Call
There was an additional $65 million of realized losses in calendar Q3 2021 due to its non-accrual investments in Spotted Hawk and Glacier Oil & Gas as discussed later. It is important to note that AINV has experienced over $760 million ofrealized losses over the last ~9 years which is around $11.75 per share using the current number of shares. A good portion of AINV’s previous and recent losses was due to higher amounts of exposure to cyclical sectors including extended stay hotels and oil/energy. However, other BDCs also had larger amounts of oil/energy exposure with much stronger NAV performance during the same period.
During calendar Q3 2021, AINV repurchased 450,953 shares at a weighted average price per share of $13.09, inclusive of commissions, for a total cost of $5.9 million. From October 1, 2021, through November 3, 2021, the company repurchased another 308,005 shares at a weighted average price per share of $13.30 for a total cost of $4.1 million. Since the inception of the share repurchase program, the company has repurchased 14,559,137 shares at a weighted average price per share of $16.15 for a total cost of $235.1 million, leaving a maximum of almost $15 million available for future purchases.
In July 2021, the company issued $125 million of 4.50% Notes due July 16, 2026, which increased the overall cost of borrowings but strengthened the balance sheet and is taken into account with the updated projections:
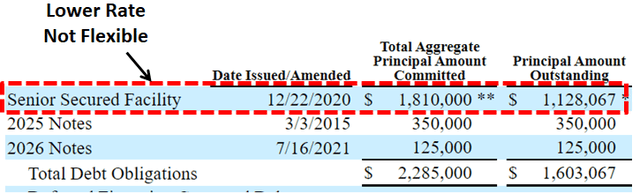
The increase in interest expense reflects both the growth in the portfolio, as well as an increase in our funding costs. As a reminder, in July, we issued $125 million of five year 4.5% unsecured notes, which drove the increase in our weighted average cost of funding from 3.08% to 3.2% quarter over quarter. Importantly, unsecured debt increase to 30% of our outstanding debt at the end of September, up from 24% last quarter.”
Source: AINV Earnings Call
However, it should be pointed out that having 70% of your borrowings consisting of secured credit facilities is not flexible relative to most higher quality BDCs. This is important if there is another market meltdown and BDCs have to temporarily mark down assets driving many issues including coverage ratios and borrowing covenants. Especially given that AINV currently has the highest leverage ratio (during good times). Also, as AINV refinances its balance sheet into more unsecured notes it will drive up its overall borrowing rates putting additional pressure on dividend coverage. Not ideal and needs to be watched.
Also taken into account is additional guidance from management on the recent call including:
Fee and prepayment income totaled $1.7 million dollars for the quarter. Although these sources of income can fluctuate from quarter-to-quarter, we expect to generate approximately $3.5 million of fee and prepayment income per quarter on average. As an illustration, in a March 2021 and June 2021 quarters, fee and prepayment income totaled $3.9 million and $5.9 million respectively.”
“We continue to focus on monetizing underlying assets, specifically Spotted Hawk, dynamic, MC and Chiron. Taken together these assets and a few others account for approximately $230 million of fair value and generate only $16 million of annual income, redeploying those assets that are approximate on euro yield to generate an incremental $2 to $3 million of annual net investment income.”
“We continue to generate incremental cash proceeds from the portion of our non-core assets that are non-generating income. For every $10 million of cash we generate from these non-income producing assets, we can generate approximately $650,000 of annual net investment income, or approximately $0.01 per share. In this regard, we have generated incremental cash each quarter and are very focused on executing some more significant process in the coming — progress in the coming quarters.”
Source: AINV Earnings Call
Management has guided for portfolio growth using increased leverage which is already the highest in the sector at 1.52 debt-to-equity (net of cash) compared to the average BDC currently around 0.96.
Given this solid level of activity, our investment portfolio grew and our net leverage ratio increased to 1.52 times at the end of September, right in the middle of our target leveraged range of 1.40 times to 1.60 times. As we look ahead, we are confident in our ability to grow our portfolio and operate within our target leverage range, given the tremendous need for creative and flexible private capital.”
Source: AINV Earnings Call
Previously, AINV was considered a ‘Level 4’ dividend coverage BDC implying that a dividend reduction was imminent mostly related to needing higher leverage as well as the reliance on fee waivers to cover the quarterly dividend. On August 6, 2020, the company announced a decrease in the regular quarterly dividend per share from $0.45 to $0.31.
From previous call: “Turning to our distribution, in light of the challenges and uncertainty created by the COVID-19 pandemic and our plans to further reduce the funds leverage, we have reassessed the long-term earning power of the portfolio and included that as a prudent to adjust the distribution at this time. We believe that distribution level should reflect the prevailing market environment and be aligned with the long-term earnings power of the portfolio. Going forward in addition to a quarterly based distribution, the company’s Board expects to also declare supplemental distribution and an amount to be determined each quarter.”
Over the coming quarters, AINV could be downgraded depending on the progress of rotating out of “non-earning and lower-yielding assets” and improved results/income from its investment in Merx Aviation.
Management mentioned that the $2.1 million dividend income received in calendar Q3 2021 will likely fall back to previous levels and is taken into account with the updated projections:
We believe Merx has successfully navigated this challenging period. As a result, AINV earned more income from Merx during the September quarter compared to recent quarters. As a result of the stability we expect to continue to see from Merx, during the recorder, we recap the capital structure and receive $6.9 million of interest income from Merx during the September quarter, $2.1 million more than last quarter. We earned a $2 million dividend from MSEA Tankers during the September quarter, we expect to earn approximately $1 million on average going forward, a level consistent with prior periods.”
Source: AINV Earnings Call
Source: AINV Earnings Presentation
Article Summary & Recommendations
Assess investor profile
Set target prices based on expected risk and dividends paid
Purchase additional shares during market volatility
First of all, please assess whether you are a “trader” and a “buy and hold” investor. The difference is how long you plan to hold certain investments, your overall appetite for risk, and expected returns. Traders typically have a higher risk tolerance but also expect higher returns. Personally, I am a buy and hold longer-term investor but continue to buy each time the market pulls back constantly reinvesting my dividends building positions in higher quality BDCs that easily outperform due to having higher quality management. I currently have 18 BDC positions some of which have been discussed in my recent public articles. I will try to cover the remaining positions in upcoming articles.
As mentioned earlier, most BDCs have recently issued very low rate unsecured notes and refinanced their balance sheets taking some short-term hits but locking in some strong quarters coming up. Q4 is typically the busiest for portfolio turnover driving higher fees and prepayment-related income which has been discussed on many of the recent earnings calls. There is a good chance that is why BDC prices have continued higher. Also, most of my ‘Level 1’ dividend coverage BDCs have recently announced dividend increases and/or supplemental/special dividends.
As for AINV, please do your due diligence including setting target prices using the portfolio detail shown in this article (at a minimum) as well as financial dividend coverage projections over the next three quarters as discussed earlier. AINV is a higher risk BDC due to previous and upcoming realized losses as well as not ideal sector exposures (similar to FSK) but management is actively working to clean up the portfolio (seems to be taking a very long time in my opinion). The company is likely trying to maximize shareholder value and at least has an incentive fee structure that partially aligns management with the shareholders.
AINV trades at an 18% discount to NAV currently paying $0.36 per share of quarterly dividends which is an 11% annual yield compensating investors for a not-so-certain future of upcoming dividends and/or realized losses. Not my cup of tea and would much rather own a BDC trading at a premium to NAV with a lower cost of capital and a lower dividend yield (before taking into account upcoming dividend increases).
What Can I Expect Each Week With a Paid Subscription?
Each week we provide a balance between easy to digest general information to make timely trading decisions supported by the detail in the Deep Dive Projection reports (for each BDC) for subscribers that are building larger BDC portfolios.
Monday Morning Update – Before the markets open each Monday morning we provide quick updates for the sector including significant events for each BDC along with upcoming earnings, reporting, and ex-dividend dates. Also, we provide a list of the best-priced opportunities along with oversold/overbought conditions, and what to look for in the coming week.
Deep Dive Projection Reports – Detailed reports on at least two BDCs each week prioritized by focusing on ‘buying opportunities’ as well as potential issues such as changes in portfolio credit quality and/or dividend coverage (usually related). This should help subscribers put together a shopping list ready for the next general market pullback.
Friday Comparison or Baby Bond Reports – A series of updates comparing expense/return ratios, leverage, Baby Bonds, portfolio mix, with discussions of impacts to dividend coverage and risk.
This information was previously made available to subscribers of Premium BDC Reports. BDCs trade within a wide range of multiples driving higher and lower yields mostly related to portfolio credit quality and dividend coverage potential (not necessarily historical coverage). This means investors need to do their due diligence before buying including setting target prices using the portfolio detail shown in this article (at a minimum) as well as financial dividend coverage projections over the next three quarters as discussed earlier.
The following information was previously provided to subscribers of Premium BDC Reports along with:
TPVG target prices/buying points
TPVG risk profile, potential credit issues, and overall rankings. Please see BDC Risk Profiles for additional details.
TPVG dividend coverage projections (base, best, worst-case scenarios). Please see BDC Dividend Coverage Levels for additional details.
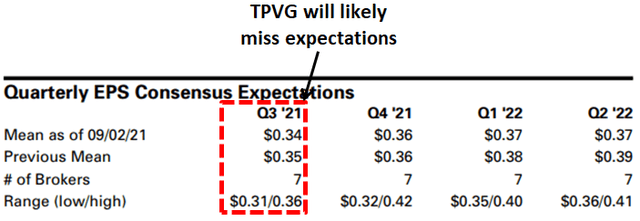
TPVG Potential Earnings Miss for Q3 2021
There is a chance that TPVG will miss upcoming earnings expectations for Q3 2021 due to the following which are taken into account with the updated projections and discussed later in this report:
Lower prepayment-related income.
Previous lower leverage and underinvested portfolio.
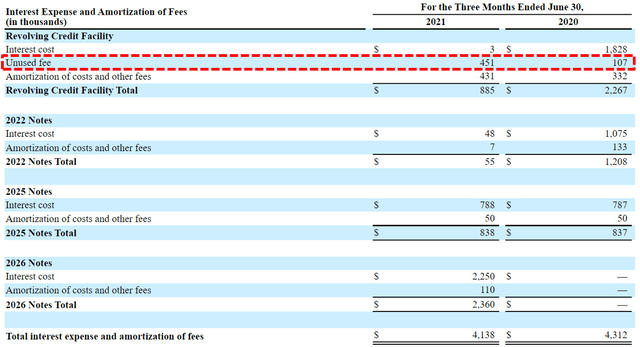
Underutilization of its lower cost credit facility resulting in higher “unused fees” and higher blended borrowing rates.
As shown below, TPVG paid $451,000 of unused credit facility fees in Q2 2021 which impacted earnings by around $0.015 per share. As the company uses higher leverage by utilizing the lower cost credit facility it will have a meaningful impact on earnings through portfolio growth and lower fees.
Given the current market with increased merger/SPAC activity, I am expecting TPVG to continue to be underleveraged, supporting the regular dividend using the previous spillover, and less likely to pay a supplemental in 2021.
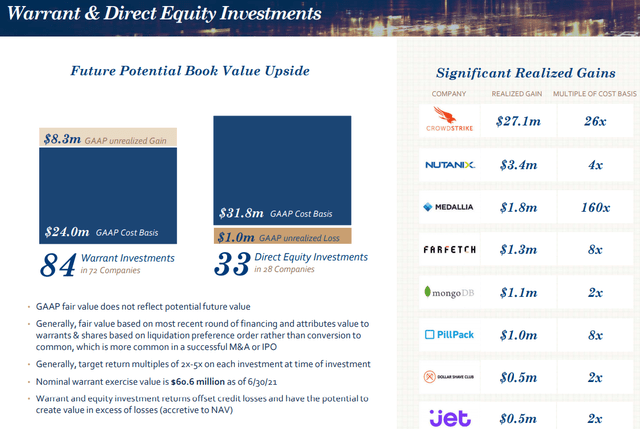
“As you can see there hasn’t been a slowdown in exit activity within our portfolio, in fact, we continue to have more than it does in TPVG portfolio companies actively exploring IPOs, SPAC mergers or M&A which if consummated could unlock substantial additional value for our shareholders from our equity and warrant portfolio.”
Of course, there is always a good chance that there will be some significant realized gains from many of its equity positions but these would likely be used to pay additional supplemental dividends in 2022. On the recent earnings call management mentioned continued gains from its equity/warrant positions including Revolut Ltd as discussed later that will likely drive an increase in NAV per share for Q3 2021:
“Although we have not completed our fair value process for Q3 we estimate TPVG’s equity and warrant investments to be valued between $10 million and $20 million, up from $1.8 million as of Q2 or an increase between $0.25 and $0.60 per share to net asset value. While still unrealized realized gains, this is another great development in the TPVG portfolio, but more importantly, not the only one that we believe will deliver meaningful gains as we have many portfolio companies and our heads down and doing great things. Clearly, we are excited by the outlook for both unrealized and realized gains on the equity and warrant portfolio which position us to provide shareholders with capital gains and to grow net asset value but we’re also pleased with the solid credit outlook and the strong yield profile for the portfolio.”
“During the second quarter, we also received warrants valued at $2.2 million in seven portfolio companies in conjunction with our debt commitments as compared to receiving warrants valued at $1.6 million in 13 companies last quarter. This increase demonstrates that we are capturing more equity upside potential from our portfolio companies, while still raising the bar on yield. During the quarter, Talkspace completed their SPAC merger and as at the end of the quarter, we have a total unrealized gain of 600,000 based on our warrant and equity positions in the company even though the company never drew on their deadline and there unfunded commitment expired, unused. This brings TPVG’s totaled to three successfully completed SPAC mergers, we also have five portfolio companies with the announced SPAC mergers and process. Bird, Enjoy, Inspur auto, and Sonder all announced their SPAC in Q2, and live learning technologies announced its back during the first quarter. Our cost basis in equity and warrants in these five companies totals $1.7 million with a fair value of $3 million as of Q2. Generally, we do not mark up our investments in these type of situations until merger exchange ratios are announced. And then we further discount the fair values given the uncertainty associated with their completion.”
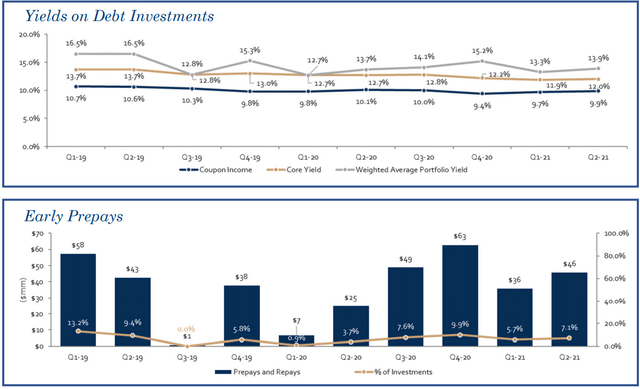
As discussed in previous reports, TPVG’s dividend coverage needs to be assessed on an annual basis due to the lumpy nature of earnings from successful portfolio companies prepaying loans. This results in certain periods of higher prepayment fees driving higher earnings often followed by lower earnings due to being underleveraged and not having a fully invested portfolio.
Previous call: “I would like to remind everyone that while prepayments are a natural part of our venture lending model, it does come with a great deal of uncertainty. One of the other aspects of prepayment activity is that the origination vintage of alone that prepays really does matter. Given the nature of income acceleration when a loan prepays, the characteristics of income changes, the longer the loan remains outstanding, for example, should alone repay or prepay in its first year, we would generally recognize a comparatively higher level of income.”
This is what happened in Q1/Q2 2021 driving interest income well below previous levels as the company continues to experience higher repayments (mostly due to investing in successful portfolio companies) but not as much prepayment-related income resulting in reduced dividend coverage mostly due to “lower weighted average principal outstanding on our income-bearing debt investment portfolio”.
“Our earnings were impacted by the significant prepay activity we’ve experienced over the past several quarters on our overall portfolio size, despite strong new commitments, growing investment funding and stable core portfolio yield is in the past. We believe any shortfall is temporary and will be more than made up during the rest of the year as the fundamentals of our industry.”
As of June 30, 2021, the company’s unfunded commitments totaled $163.5 million and through August 4, 2021, had closed $15.7 million of additional debt commitments, funded $18.2 million in new investments offset by $18.2 million of prepayments driving $0.4 million of accelerated income. However, management is expecting lower prepayments combined with a strong pipeline of new investments and signed term sheets that should drive portfolio growth in Q3/Q4 2021 taken into account with the updated projections.
“As we look to the second half of this year in terms of prepayment activity from our core equity raises we’re seeing a little more balance from portfolio companies that are fundraising or that are closing fund-raises, they’re either waiting to pay off the debt, they’re either not paying off the debt or we’re talking with them about creative ways to keep the debt outstanding which we think will then translate into meaningful portfolio growth. Our large pipeline strong levels of signed term sheets increasing commitment growth, higher utilization rates, and meaningful levels of unfunded commitments are great indicators for near-term portfolio growth, which we believe will enable us to cover the distribution on a quarterly basis this year, but we’re not going to force portfolio growth unnaturally.”
“The most notable progress is a continued rise we are seeing in signed term sheets, which was one of the highest quarterly totals in TPVG’s history. Additionally, our pipeline increased 50% over last quarter and is more than doubled since a year ago. We have substantial liquidity to meet this increased demand and we’re on course to achieve the growth targets we outlined for the second half of the year and drive consistent long-term growth of investment income in net asset value. So far we have funded over $18 million of new loans here in the third quarter. Consistent with prior guidance, we expect gross fundings for Q3 and Q4 to come in between $100 million and $150 million per quarter, which is supported by our pipeline, our backlog of signed term sheets, high utilization rates of new commitments at close, sizable unfunded commitments as well as the pattern of our portfolio companies drawing on existing unfunded commitments towards the second half of the year.”
Q. “In your comments, did you say that you expect the quarterly EPS to cover the dividend in the second half?”
A. “I didn’t say that. What I was what our trend will be is to originate to get to a level where it’s sustainable. So, we clearly need to get to the $100 million, $150 million in the third and fourth quarter. And then we’re on track for doing that.”
Last month, the Board reaffirmed its quarterly distribution of $0.36 per share for Q3 2021, and dividend coverage will continue to improve partially due to the recent/previous reductions in borrowing rates as well as growing the portfolio using leverage from its credit facility.
“During the second quarter, the company recorded a one-time $681,000 or $0.02 per share net realized loss on extinguishment of debt. This was the result of the full redemption on April 5th of our baby bonds. With this redemption complete, we expect a positive effect to earnings as we continue to lower our cost of capital going forward.”
“The most notable progress is a continued rise we are seeing in signed term sheets, which was one of the highest quarterly totals in TPVG’s history. Additionally, our pipeline increased 50% over last quarter and is more than doubled since a year ago. We have substantial liquidity to meet this increased demand and we’re on course to achieve the growth targets we outlined for the second half of the year and drive consistent long-term growth of investment income in net asset value.”
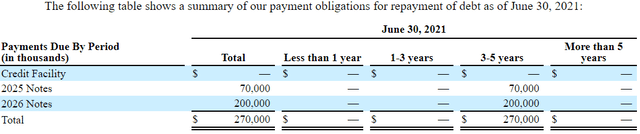
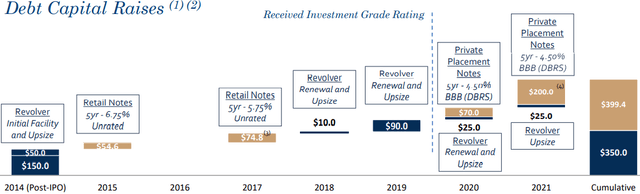
On March 1, 2021, TPVG closed a private offering of $200 million 4.50% institutional unsecured notes due 2026, and used a portion of the proceeds to redeem its 5.75% Baby Bond (TPVY) lowering its overall borrowing rates. Leverage remains low due to previous early repayments driving a debt-to-equity ratio of 0.59 net of cash giving the company plenty of growth liquidity. It should be noted that TPVG is one of the only BDCs currently with 100% unsecured borrowings giving the company much more flexibility over the coming quarters:
TPVG Risk Profile Quick Update
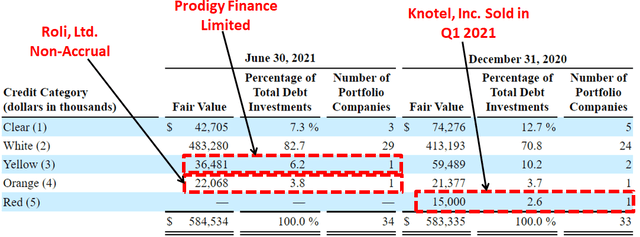
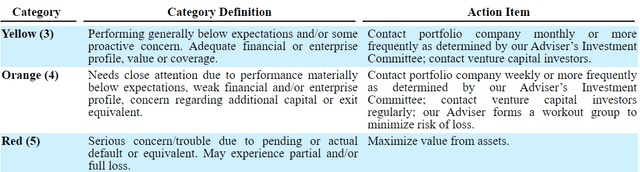
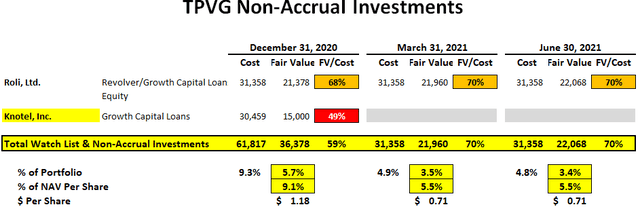
TPVG maintains a credit watch list with portfolio companies placed into one of five categories, with Clear, or 1, being the highest rating and Red, or 5, being the lowest. Generally, all new loans receive an initial grade of White, or 2. Knotel was its only Red (5) and was sold during Q1 2021, Roli, Ltd. is its only Orange (4) and remains on non-accrual status, and Prodigy Finance Limited is its only Yellow (3) and needs to be watched. Please see the description of categories and discussion of Prodigy and Roli below.
“Moving on to credit quality, the credit outlook for our portfolio remains strong with 90% of our debt investments in our top two categories, consistent with Q1, no obligor’s were added to categories, three, four and five, and no obligor’s were placed on non-accrual during the second quarter. In fact, the weighted average investment ranking of our debt investment portfolio improved to 2.06 compared to 2.11 as at the end of Q1. During the quarter, one company was upgraded from category 3 to category 2 as a result of completing a financing, leaving only one company in category 3 which is Prodigy finance in international graduate student lending company. During Q2 Prodigy paid down $5 million on outstanding loans to us and we’re pleased to report that here in Q3, Prodigy completed its first securitization issuing $228 million of investment-grade asset-backed securities and are remaining loans will now switch from PIK interest to cash pay interest. Based on these and other developments that Prodigy, we expect to upgrade them to category 2 here in Q3. Our one category 4 portfolio company really continues to be our only loan on non-accrual and our mark was flat with last quarter prior to currency fluctuations.”
Roli, Ltd. was discussed on a previous call:
“If you look at the value accreted quarter-over-quarter for ROLI, so it’s not out of the woods, but if you’ve seen some very favorable product reviews, and some awards that they won for their product in Q4. So we continue to be balanced, but we feel again, conditions continued to improve at ROLI.”
Revolut Ltd announced the closing of an $800 million private equity raise at a $33 billion valuation driving an estimated fair value range of TPVG’s equity and warrant investments of approximately $10 million to $20 million, up from a combined fair value of $1.8 million at June 30, 2021. As mentioned earlier this will likely drive an increase in NAV per share for Q3 2021:
“Revolut, as an example, recently announced the closing of an $800 million equity round at a $33 billion valuation. Positive trends and our excitement in these technology sectors, if you can’t tell, continues. We foresee substantial equity fundraising activity in the venture capital industry as a whole and within our portfolio in particular. It’s a testament to our portfolio’s quality. We believe future venture lending opportunities are large and plentiful given today’s environment. This robust industry-wide equity financing activity continues to create demand for debt to compliment or top off an equity raise in some cases. “Although we have not completed our fair value process for Q3 we estimate TPVG’s equity and warrant investments to be valued between $10 million and $20 million, up from $1.8 million as of Q2 or an increase between $0.25 and $0.60 per share to net asset value.”
During Q2 2021, Bird Rides, Inc., Enjoy, Inc., Inspirato LLC and Sonder, Inc. announced plans to go public through SPAC mergers and Groop Internet Platform, Inc. (Talkspace) closed its SPAC merger.
During Q1 2021, Hims & Hers, Inc. and View, Inc. closed their SPAC mergers and GROOP Internet Platform, and Live Learning Technologies announced plans to go public through SPAC mergers.
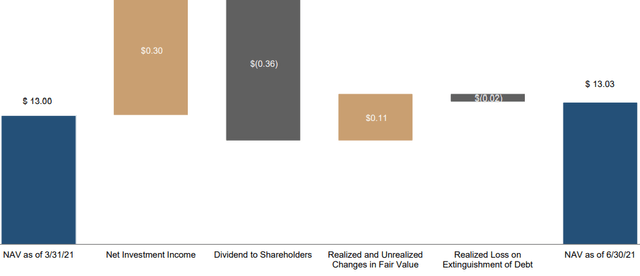
For Q2 2021, TPVG’s net asset value (“NAV”) per share increased slightly by 0.2% mostly due to portfolio unrealized gains partially offset by losses related to redeeming its Baby Bond as discussed earlier as well as under-earning the dividend.
“Net unrealized gains on investments for the second quarter were $3.2 million or $0.10 per share, resulting primarily from favorable fair value adjustments on debt investments of $1.9 million on warrant and equity investments of $800,000 and favorable changes in foreign exchange rates of $500,000. During the second quarter, the company recorded a one-time $681,000 or $0.02 per share net realized loss on extinguishment of debt. This was the result of the full redemption on April 5th of our baby bonds.”
What Can I Expect Each Week With a Paid Subscription?
Each week we provide a balance between easy to digest general information to make timely trading decisions supported by the detail in the Deep Dive Projection reports (for each BDC) for subscribers that are building larger BDC portfolios.
Monday Morning Update – Before the markets open each Monday morning we provide quick updates for the sector including significant events for each BDC along with upcoming earnings, reporting, and ex-dividend dates. Also, we provide a list of the best-priced opportunities along with oversold/overbought conditions, and what to look for in the coming week.
Deep Dive Projection Reports – Detailed reports on at least two BDCs each week prioritized by focusing on ‘buying opportunities’ as well as potential issues such as changes in portfolio credit quality and/or dividend coverage (usually related). This should help subscribers put together a shopping list ready for the next general market pullback.
Friday Comparison or Baby Bond Reports – A series of updates comparing expense/return ratios, leverage, Baby Bonds, portfolio mix, with discussions of impacts to dividend coverage and risk.
This information was previously made available to subscribers of Premium BDC Reports. BDCs trade within a wide range of multiples driving higher and lower yields mostly related to portfolio credit quality and dividend coverage potential (not necessarily historical coverage). This means investors need to do their due diligence before buying including setting target prices using the portfolio detail shown in this article (at a minimum) as well as financial dividend coverage projections over the next three quarters as discussed earlier.
The following information was previously provided to subscribers of Premium BDC Reports along with:
FSK target prices/buying points
FSK risk profile, potential credit issues, and overall rankings. Please see BDC Risk Profilesfor additional details.
FSK dividend coverage projections (base, best, worst-case scenarios). Please see BDC Dividend Coverage Levels for additional details.
This update discusses FS KKR Capital (FSK) which I have not written much about recently as I typically try to cover BDCs with increasing dividends supported by a history of strong credit performance. FSK does not fit this category which is why I sold my very small position in 2018 when it was trading under the symbol FSIC for the reasons discussed in “Why I Sold This 11.1% Yielding BDC“. It should be noted that FSK continues to seriously underperform the average BDC, especially over the last 18 months as shown in the total return table in a previous public article “BDCs Vs. REITs: Comparing Returns For Higher-Yield Investors” even after taking into account this current environment that I would consider to be “risk-on” where higher risk BDCs such as FSK, PSEC, BKCC, PTMN, PFX, FCRD, LRFC, CCAP, and AINV do well. I typically do not cover these BDCs as they are the first to drop during volatility due to higher-risk portfolios that would likely not perform well during a recessionary environment.
FSK Advisory Fee Agreement
I’m not going to cover the entire history of portfolio mergers (FSIC, CCT, FSK, FSKR) that have created the current company but they have all had their share of credit issues often invested in the same or similar assets. Obviously, these are now referred to as ‘legacy assets’ and current management is working through them.
Dan Pietrzak, Chief Investment Officer and Co-President of FSK, said, “The combination creates a premier BDC lending franchise with approximately $15 billion in assets. With our portfolio diversification, enhanced access to capital markets, and over $3 billion of available investment capacity, we believe we are well-positioned as a leading lender to upper middle market borrowers.”
Historically, FSK has covered its dividend only due to no incentive fees paid driven by the ‘total return hurdle’ from previous realized/unrealized losses. However, the total return hurdle or ‘look back’ provision was removed as a part of the latest merger agreement between FSK and FSKR.
Instead, FS/KKR has agreed to waive $90 million of incentive fees spread evenly over the first six quarters following the closing. This waiver equates to $15 million per quarter. It is important to note that the company would have paid almost $90 million in incentive fees over the previous five quarters without the look-back provision which is almost $18 million per quarter. However, that is based on 20.0% income incentive fees compared to 17.5% but also only for FSK. The merger doubled the size of the company with similar holdings and credit issues implying that the $15 million per quarter could be insufficient if there are continued/additional credit issues. Please keep in mind that FSKR’s NAV per share declined by almost 30% over the last three years.
Source: FSK Investor Presentation
It is important to note that if there are additional rounds of credit issues shareholders will not be protected leaving management to earn full incentive fees even during periods when the BDC/management under-performs. The fee waivers are temporary but this change is permanent which is one of the reasons that this BDC trades at a discount relative to most.
Operating Cost as a Percentage of Available Income
As a part of assessing BDCs, it’s important to take into account expense ratios. BDCs with lower operating expenses can pay higher amounts to shareholders without investing in riskier assets.
“Operating Cost as a Percentage of Available Income” is one of the many measures that I use which takes into account operating, management, and incentive fees compared to available income.
“Available Income” is total income less interest expense from borrowings and is the amount of income that is available to pay operating expenses and shareholder distributions.
As discussed earlier this month in “Conservative Portfolio Safely Paying Investors 7.3%“, many BDCs have been temporarily waiving fees or have fee agreements that take into account previous capital losses that are ending this year. The following table shows the average adjusted operating cost ratios for each BDC over the last four quarters without the benefit of temporary fee waivers with examples for GBDC and PSEC. It should be noted that the ratio for FSK is based on the previous fee agreement.
Portfolio Credit Quality (Quick Update)
My primary concern for FSK is the higher amount of cyclical exposure including retail, capital goods, real estate, energy, and commodities that account for around 25% of the total portfolio. The portion of the portfolio that was originated under the FS management is of particular concern. It also has many of the same exposures in its SCJV which is almost 10% of the portfolio. There is a good chance that many of FSK’s equity positions in these sectors have been benefiting from the recent recovery that could reverse at some point.
Source: SEC Filing
Also, many of the companies in FSK’s portfolio are more likely to be impacted by supply chain issues as well as “inflationary pressures” and rising input costs especially labor. On the August 2021 earnings call management mentioned that it views these issues as “transitory” and “supply chain disruptions to be resolved over the ensuing quarters”:
The Fed’s comments in July regarding their belief of the transitory nature of many of the inflationary pressures currently affecting certain industries dovetails with our own views, as we expect many issues caused by COVID-related supply chain disruptions to be resolved over the ensuing quarters.”
Source: FSK Earnings Call
During Q2 2021, FSK placed its first-lien loan from ATX Networks on non-accrual status but will likely be back on accrual during Q3 2021 and is taken into account with the updated projections. It should be noted that this investment was marked 8% over cost as of June 30, 2021, as shown in the following table.
During the second quarter, we placed one investment on non-accrual, ATX Networks. ATX design radio frequency, optical and other video networking equipment used primarily by cable operators. The company’s earnings have been negatively impacted by lower cable company capex spend. We owned $80 million of the $227 million first lien term loan marked at 64% of cost as of June 30, down from 69% of cost as of March 31. The company, a group of first lien lenders holding more than two-thirds of the first lien term loan, and other parties in the capital structure have made significant progress on a resolution of ATX’s breach of its Q1 financial covenant, and we expect the transaction resolving such breach to close in the third quarter. The anticipated impact of this potential transaction has been factored into the Q2 mark.”
Source: FSK Earnings Call
Total non-accruals currently account for around 4.7% of the portfolio at cost and 3.1% of the portfolio fair value but do not take into account the additional investments FSK has with these companies that account for another 1.9% of the portfolio at cost and 1.1% of the fair value. Also, there are quite a few investments that remain on its ‘watch list’ including Sequential Brands Group which filed for bankruptcy on August 31, 2021. However, there is a good chance that there will be minimal impact to NAV per share for the upcoming reported quarter but will likely impact earnings.
The Company determined that, as a result of the significant debt on its corporate balance sheet, it was no longer able to operate its portfolio of brands. Accordingly, in conjunction with the filing, the Company will pursue the sale of all or substantially all of its assets under Section 363 of the U.S. Bankruptcy Code. In connection with this in-court process, Sequential will be obtaining $150 million in debtor-in-possession (“DIP”) financing from its existing Term B Lenders. The Company expects this new financing, together with cash generated from ongoing operations, to provide ample liquidity to support its operations during the sale process.”
Source: FSK Earnings Call
As shown in the following tables, the total amount of investments considered non-accrual or related as well as on the ‘watch list’ account for almost $1.3 billion or 8.5% of the portfolio fair value. This is close to the amount of investments that the company has identified with its ‘Investment Rating’ 3 and 4 which are considered “underperforming investments” with “some loss of interest or dividend possible” and/or “concerns about the recoverability of principal or interest”. It should be noted that these investments have a total cost basis of almost $1.9 billion or 13% of the total portfolio and could result in additional realized losses over the coming quarters. Also, if additional watch list investments are added to non-accruals status this would likely drive additional declines in NAV per share, earnings, and dividend coverage.
Please make sure that if you are subscribed to a service that provides you with BDC target prices they should also be providing the following level of portfolio detail as well as financial dividend coverage projections over the next three quarters as discussed in recent articles.
Source: SEC Filings
Comparison of Realized Gains/Losses
Gains or losses are said to be “realized” when an investment is actually sold or exited as compared to “unrealized” gains and losses due to an increase or decrease in the value of an investment that has not yet been sold. When a BDC incurs realized losses there is generally no way to reverse these losses but can potentially be offset by positive performance from other investments and/or over-earning the dividend.
Since 2014, FSK has experienced over $1 billion in realized losses which does not include in the realized losses from FSKR. This is more than almost every other BDC even when measured on a per-share basis as shown below. These losses were due to lower portfolio credit quality and the primary driver of NAV per share declines and two dividend cuts. It should be noted that FSK still has a meaningful portion of its portfolio in cyclical sectors and/or companies that are more likely to be impacted by supply chain issues as well as rising input costs especially labor. Many of these investments have been discussed in previous reports and some are discussed later
Changes in NAV Per Share
The following table shows the changes in NAV per share through June 30, 2021, as only a handful of BDCs have reported September 30, 2021, results as discussed later. Also, I am using a projected $0.60 per share of quarterly dividends for FSK compared to most services using $0.65 per share as discussed in the next section of this article.
FSK Dividend Discussion
There are many factors to take into account when assessing dividend coverage for BDCs including portfolio credit quality, realized losses, fee structures including ‘total return hurdles’ taking into account capital losses, changes to portfolio yields, borrowing rates, the amount of non-recurring and non-cash income including payment-in-kind (“PIK”). Most BDCs have around 2% to 8% PIK income and I start to pay close attention once it is over ~5% of interest income. Higher amounts of PIK is typically a sign that portfolio companies are not able to pay interest expense in cash and could imply potential credit issues over the coming quarters.
The amount of PIK interest income declined but still accounts for almost 14.0% of total interest income compared to 15.6% during Q1 2021. There is a chance that FSK could be downgraded over the coming quarters if there is another round of credit issues driving additional realized losses and higher PIK similar to previous quarters and responsible for dividend reductions.
Source: FSK Investor Presentation
Management continues to reduce the amount of non-income producing equity investments from 9.3% to 6.8% partially related to the recent merger with FSKR. Investors are hoping that management can continue to produce higher earnings with the current portfolio before the fee waivers roll-off which could include a larger portion invested in the SCJV shown as “Credit Opportunities Partners JV” in the following table:
Source: FSK Investor Presentation
On August 9, 2021, FSK declared a quarterly dividend of $0.65 for Q3 2021 which is an increase from the previous $0.60 due to higher-than-expected earnings for Q2 2021. Management has adopted a ‘variable dividend policy’ based on the NAV per share and expected earnings:
Consistent with our variable dividend policy of seeking to provide shareholders with an annualized 9% dividend yield on our NAV over time, we are committed to paying out additional levels of NII during quarters where our portfolio generates additional income. As a result, during the third quarter our dividend will be $0.65.”
Source: FSK Earnings Call
However, as discussed by management on the recent call, investors should expect $0.60 of quarterly dividends for the following quarters;
From a forward-looking dividend perspective, our third quarter dividend will be $0.65 per share, with the increase in this quarter’s dividend being tied directly to the additional net investment income we generated during the second quarter. All else being equal, given that we expect our third quarter adjusted NII to approximate $0.61 per share, we believe it is reasonable for investors to expect that should we achieve our adjusted NII guidance for the third quarter, that our fourth quarter dividend would be $0.60 per share; however, I should note that dividends are subject to the discretion of our board and applicable legal requirements, and this forward guidance, while intended to be helpful to investors, should not be interpreted as a formal dividend announcement.”
“Looking forward to the third quarter, while we expect our one-time fee and dividend income to return to a normalized level, we expect our adjusted NII to be $0.61 per share. Our recurring interest income on a GAAP basis is expected to approximate $275 million. We expect recurring dividend income associated with our joint venture to approximate $44 million. We expect other fee and dividend income to approximate $33 million during the third quarter.”
Source: FSK Earnings Call
The following information is from the Seeking Alphawebsite showing the current yield for FSK at 11.8% which is assuming $2.60 in annual dividends or $0.65 per quarter:
Source: Seeking Alpha
FSK announces dividends when it reports financial results in the second week of November and there will likely be investors disappointed with the lower dividend payment and could impact its stock price. It should be noted that one of the better analysts for the stock recently ‘adjusted’ the price target from $22.00 to $19.00 with an underweight rating last week. There is a chance that they are pricing in additional dividend decreases.
Source: Seeking Alpha
Summary & Q3 2021 BDC Earnings Season
I completely understand the lure of higher yields and trading below NAV but this is more like rolling the dice and hoping for a turnaround with credit quality and performance. If management truly believed this was the most likely scenario why did they remove the total return hurdle from the incentive fee agreement? That is called having “skin in the game” and aligning management and shareholder interests. I own many BDCs without total return hurdles but with much higher historical credit performance as well as management consistently doing the right thing often waiving fees during extraordinary circumstances. To be honest there are so many higher quality BDCs that I have covered over the last few months in previous articles why roll the dice on FSK when management is NOT willing to do the same?
One of the best times to purchase these stocks is just after they report results before other investors have a chance to digest the information. Many investors simply look at earnings or changes in NAV which does not tell the full story. BDCs have begun reporting calendar Q3 2021 results and investors should be ready to make changes to their portfolios.
Again, FSK will likely be announcing a lower dividend next week and there are likely some investors that will see it as a dividend cut especially given that many sites are currently using the $0.65 per share annualized.
What Can I Expect Each Week With a Paid Subscription?
Each week we provide a balance between easy to digest general information to make timely trading decisions supported by the detail in the Deep Dive Projection reports (for each BDC) for subscribers that are building larger BDC portfolios.
Monday Morning Update – Before the markets open each Monday morning we provide quick updates for the sector including significant events for each BDC along with upcoming earnings, reporting, and ex-dividend dates. Also, we provide a list of the best-priced opportunities along with oversold/overbought conditions, and what to look for in the coming week.
Deep Dive Projection Reports – Detailed reports on at least two BDCs each week prioritized by focusing on ‘buying opportunities’ as well as potential issues such as changes in portfolio credit quality and/or dividend coverage (usually related). This should help subscribers put together a shopping list ready for the next general market pullback.
Friday Comparison or Baby Bond Reports – A series of updates comparing expense/return ratios, leverage, Baby Bonds, portfolio mix, with discussions of impacts to dividend coverage and risk.
This information was previously made available to subscribers of Premium BDC Reports. BDCs trade within a wide range of multiples driving higher and lower yields mostly related to portfolio credit quality and dividend coverage potential (not necessarily historical coverage). This means investors need to do their due diligence before buying including setting target prices using the portfolio detail shown in this article (at a minimum) as well as financial dividend coverage projections over the next three quarters as discussed earlier.
QC Supply is a specialty distributor and solutions provider to swine and poultry markets and was the only investment added to non-accrual during Q2 2021. Total non-accrual investments decreased from 2.2% to 1.9% of fair value (2.9% of cost) of the total portfolio due to removing Sundance Energy.
Please note that ARCC has a very large portfolio with investments in 365 companies valued at over $17 billion so there will always be a certain amount of non-accruals.
As shown below, the company remains primarily invested in first and second-lien loans. Please keep in mind that many of these companies are larger middle market companies that will likely outperform in an extended recession environment. Not all first-lien and second-lien are created equal and I would expect many of ARCC’s second lien positions to outperform other BDC’s first-lien positions during worst-case scenarios.
Source: ARCC Earnings Presentation
Similar to most BDCs, ARCC has low exposure to cyclical sectors which is why they outperformed during the COVID-driven recession.
Source: ARCC Earnings Presentation
There was another improvement in the amount of ‘Investment Grade 2’ (from 11.8% to 9.4% of the portfolio) which indicates that the “risk to our ability to recoup the initial cost basis of such investment has increased materially since origination or acquisition, including as a result of factors such as declining performance and non-compliance with debt covenants; however, payments are generally not more than 120 days past due”.
ARCC Dividend Update
For Q2 2021, ARCC reported another exceptional quarter easily beating its best-case projections due to the highest level of quarterly originations in the company’s history coupled with much higher-than-expected capital structuring service fees and dividend income. ARCC remains a ‘Level 1’ dividend coverage BDC and the company announced an increase to the regular quarterly dividend from $0.40 to $0.41 per share for the third quarter.
Kipp deVeer, CEO: “We reported another quarter of strong core earnings, healthy portfolio performance, record NAV per share and our highest level of quarterly originations in the company’s history. Our company continues to operate with significant scale, sourcing and investment advantages that come from our nearly 17-year track record in the market. Based on our favorable outlook and strong competitive position, we increased our regular quarterly dividend to $0.41 per share.”
Source: ARCC Press Release
ARCC’s net asset value (“NAV”) per share increased by another 4.1% partially due to by issuing 7 million shares (accretive to NAV) through its at-the-market (“ATM”) equity distribution agreement (discussed later) as well as overearning the dividend but mostly due to unrealized portfolio gains.
Its portfolio yield (at cost) decreased from 7.9% to 7.7% due to new investments at lower yields. Through July 22, 2021, the company funded $430 million of new investments partially offset by $267 million of exits. There were additional net realized gains of around $59 million or $0.13 per share due to the exit of investments in Blue Angel and Mavis Tire Express Services.
Source: ARCC Earnings Presentation
ARCC continues to reduce its overall borrowing rates as well as laddering its maturities. On August 11, 2021, ARCC issued an additional $400 million of 2.875% notes due June 15, 2028, at a premium (102.696%) resulting in a yield-to-maturity of 2.435% which is an extremely low fixed rate for an unsecured note due 2028.
In April 2021, the company entered into amended/restated equity distribution agreements to issue and sell shares of its common stock up to $500 million. During the three months ended June 30, 2021, ARCC issued 7.0 million shares with net proceeds of $135 million or around $19.27 per share through its at-the-market (“ATM”) program.
The ATM is a nice tool to issue some creative equity, I mentioned that I really do think coming out of COVID in into this recovery that we gained market share. And we think that there’s a reason for us to grow the company based on the investment environment being attractive. And as Mike said, on the call, or on the prepared remarks him more than investable, I mean, pretty attractive. The amount of stock that we’re actually able to issue in the ATM is quite limited. But you know, the good news is we’re doing it on a creative basis. That’s low cost that allows us to continue to grow the business.”
Source: ARCC Earnings Call
In August 2021, ARCC completed a public equity offering of 12,500,000 shares of common stock at a price of $19.6667 per share resulting in net proceeds of approximately $245.4 million:
We used the net proceeds of the August 2021 Offering to repay certain outstanding indebtedness under our credit facilities. We may reborrow under our credit facilities for general corporate purposes, which include investing in portfolio companies in accordance with our investment objectives. In addition, in connection with the August 2021 Offering, we granted the underwriters an option to purchase an additional 1,875,000 shares of common stock, which option expires on September 1, 2021.
Source: ARCC Press Release
The equity offering was slightly accretive to NAV per share by around $0.04 per share depending on the number of total shares issued. I previously projected net proceeds of around $275 million which is relatively small compared to the $3.9 billion of new investments during Q2 2021 and the recent $1.35 billion of unsecured notes:
In June 2021, Ares Capital issued $850 million in aggregate principal amount of unsecured notes that mature on June 15, 2028, and bear interest at a rate of 2.875%.
In May 2021, Ares Capital issued an additional $500 million in aggregate principal amount of its existing unsecured notes that mature on July 15, 2025, and bear interest at a rate of 3.250%. These notes were issued at a premium that resulted in an effective yield of 2.0% for the Additional July 2025 Notes.
As of June 30, 2021, ARCC had leverage or debt-to-equity of around 1.10 net of cash and using ~$275 million of net proceeds would have a pro-forma impact reducing it to 1.03 which is closer to the average BDC currently around 0.95 as shown below and in the “Conservative Portfolio Safely Paying Investors 7.3%: Golub Capital” article. However, BDCs with higher quality portfolios can support higher leverage which includes ARCC that has a target range of 0.90 to 1.25:
While our leverage ratio will vary over time depending on activity levels, we will continue to work to operate within our stated target leverage range of 0.90 to 1.25 times.”
Source: ARCC Earnings Call
BDCs & Interest Rates
As discussed earlier this year in “Positioning Your Portfolio For Higher Interest Rates” interest rate fears are creeping back into the market again and BDCs mostly have floating rate investments coupled with fixed-rate borrowings. Higher interest rates generally drive higher net interest margins once the rate floors are met which is different for each BDC. The following information was provided by ARCC but to be completely honest I think it is too early to start assessing how rates will impact earnings per share. I have recently noticed some negative articles discussing BDCs and interest rates mostly written by contributors that are new to the sector without the benefit of how BDCs were impacted the last two periods of rate increases. BDCs are not CEFs and typically have more involved management that can quickly adjust balance sheets if/when needed. For now, most BDCs are selectively refinancing higher-cost debt taking into account maturities and rate trends as there is a careful balance to maximize ROE to shareholders. Management does not want to take out higher-cost debt too soon as they get hit with unamortized expenses as well as potentially hold out for lower rates and/or longer periods. ARCC management is masterful at this with an ever-evolving and impressive balance sheet that even at these levels will produce positive positive results no matter what happens with changes in the underlying interest rates as shown below. However, this does not take into account an additional $400 million of unsecured notes due 2028 at a yield-to-maturity of 2.435% issued in August 2021 as discussed later.
However, if management believes that rates will trend higher sooner they can easily start to shift the balance sheet to maximize well before rates start to rise. This should also be taken into account with BDCs currently using their credit lines with lower rates waiting to shift more into fixed-rate unsecured notes which will have a material impact on their interest rate sensitivities. This means please ignore other chicken-little contributors that have not been around the block when it comes to the BDC sector.
Another Dividend Increase?
As mentioned in recent articles, historical dividend coverage is not a good indicator of upcoming coverage for many reasons so please make sure that you’re getting this information before investing in BDCs.
First, you need to assess the overall risk profile and potential credit issues along with expected dividend coverage which is directly impacted by maintaining credit quality. Once you have established both of these you can then set target prices which I will discuss in another article. This is critical when deciding if and when you should be purchasing BDCs at these levels so please do your due diligence or find a service that provides proper research.
It’s best to keep up to date on information contained in the SEC filings as well as when BDCs start to report results starting next week with ARCC which is the first to report results. Also, please make sure that your service provides detailed financial projections for each of the BDCs that you plan to invest in.
I use a “Base” case projection along with “Best” and “Worst” cases over the next three quarters. I find that going out much further than three quarters is pointless as BDC balance sheets change constantly adapting for upcoming economic conditions as mentioned earlier. I typically do not provide financial projections in public articles but below is a quick example of the base case projections for ARCC taking into account the previously discussed information including the recent equity offering, changes to borrowing rates, and net interest margin as well as expected portfolio yield. I am projecting another dividend increase for Q1 2022.
Previous ARCC Purchases and Q3 2021 Reporting Schedule
BDC pricing can be volatile and timing is everything for investors who want to get the “biggest bang for their buck” but still have a higher-quality portfolio that will deliver higher-than-average returns over the long term. The “Annualized” return shown does not use a simple average but shows the actual compounding of annual returns. This is the true return each year. Please disregard the annualized total returns for 2020 purchases as the time frame is not long enough to accurately reflect.
As mentioned earlier, I currently have 17 BDC positions including ARCC which is my third-largest position as I continue to purchase additional shares including the most recent purchase as discussed in “Ares Capital Finally A Buy: Did You Miss It?“. Please note that ARCC had a stock price of $14.36 when that article came out which still would’ve been an excellent time to purchase additional shares.
The following chart shows my previous purchases of ARCC typically when its RSI is closer to 30. However, it should be noted that the best prices came shortly after an RSI of 30 was hit and then went lower.
One of the best times to purchase these stocks is just after they report results before other investors have a chance to digest the information. Many investors simply look at earnings or changes in NAV which often does not tell the full story. BDCs will begin reporting calendar Q3 2021 results next week starting with ARCC and investors should be ready to make changes to their portfolios.
What Can I Expect Each Week With a Paid Subscription?
Each week we provide a balance between easy to digest general information to make timely trading decisions supported by the detail in the Deep Dive Projection reports (for each BDC) for subscribers that are building larger BDC portfolios.
Monday Morning Update – Before the markets open each Monday morning we provide quick updates for the sector including significant events for each BDC along with upcoming earnings, reporting, and ex-dividend dates. Also, we provide a list of the best-priced opportunities along with oversold/overbought conditions, and what to look for in the coming week.
Deep Dive Projection Reports – Detailed reports on at least two BDCs each week prioritized by focusing on ‘buying opportunities’ as well as potential issues such as changes in portfolio credit quality and/or dividend coverage (usually related). This should help subscribers put together a shopping list ready for the next general market pullback.
Friday Comparison or Baby Bond Reports – A series of updates comparing expense/return ratios, leverage, Baby Bonds, portfolio mix, with discussions of impacts to dividend coverage and risk.
This information was previously made available to subscribers of Premium BDC Reports. BDCs trade within a wide range of multiples driving higher and lower yields mostly related to portfolio credit quality and dividend coverage potential (not necessarily historical coverage). This means investors need to do their due diligence before buying.
This article is an update to “I Bought Fidus Investment: 12% Yield And 35% Below Book” that hopefully convinced investors to start a position or buy more of Fidus Investment (FDUS) that has easily outperformed the S&P 500:
As mentioned in the previous article:
I believe that there’s a good chance for a total return potential of 30% or higher over the next 12 months.
The article provided the following rationale for expected returns including only the regular dividends paid plus price appreciation to $12.00 to $15.00 driving a total return between 30% to 60%.
Good News!
The stock is now $17.88 and the company has increased its regular dividend as well as paying special and supplemental dividends driving a total return approaching 90% after only 11 months. It should be noted that the article also discussed the reasons why I thought the company would increase and/or pay supplemental dividends which are discussed below as well.
For Q2 2021, FDUS easily beat its best-case projections covering 137% of its quarterly regular dividend due to lower-than-expected ‘Other G & A’ as well as an increase in origination, prepayment, and amendment fees, and higher dividend income due to increased levels of distributions received from equity investments.
Edward Ross, Chairman/CEO: “Our portfolio performed well in the second quarter, generating a 15% increase in adjusted NII year over year. As a result of this solid operating performance along with portfolio fair value appreciation, NAV reached $17.57 per share. Looking ahead, our healthy liquidity places Fidus in a very strong position to carefully build our portfolio of debt investments in lower middle market companies with resilient business models and positive long-term outlooks. Consistent with our track record of managing the business for the long term and deliberate investment selection, we intend to continue to emphasize quality over quantity while remaining focused on capital preservation and generating attractive risk adjusted returns.
Source: FDUS Q2 2021 Earnings Announcement
FDUS Equity Positions & Realized Gains
Most dividend coverage measures for BDCs use net investment income (“NII”) which is basically a measure of earnings. However, some BDCs achieve incremental returns typically with equity investments that are sold for realized gains often used to pay supplemental/special dividends.
FDUS has equity investments in almost 86% of its portfolio companies which is primarily responsible for net asset value (“NAV” or book value) growth of over 14% in the last 4 quarters and continued realized gains and dividend income to support special/supplemental dividends paid over the last 8 years.
Source: FDUS Q2 2021 Investor Presentation
During Q2 2021, there was another $2.2 million or $0.09 per share of realized gains mostly due to Wheel Pros as discussed in the previous report. During the previous quarter, FDUS had net realized gains of $3.2 million or $0.13 per share due to exiting other equity positions including Software Technology, Rohrer, and FDS Avionics.
Source: SEC Filing
On July 26, 2021, FDUS exited its debt and equity investments in Worldwide Express Operations, which was acquired by Worldwide Express resulting in additional realized gains of approximately $3.0 million or $0.12 per share. However, these gains will be partially be offset by a $1.0 million realized loss related to the exit of its debt and equity investments in Hilco Technologies on July 16, 2021.
Subsequent to the quarter end, Hilco Technologies sold. We took control of Hilco in the second quarter and exchanged a $10.3 million debt investment for an equity investment in a new holding company. In conjunction with the sale subsequent to quarter end, we received payment in full on our residual debt and converted equity investment and realized a net loss of approximately $1.0 million of our original equity investment in the company. Due to the Hilco restructuring and exchange of debt for equity, approximately $0.6 million of interest income was converted into dividend income.”
There is the potential for significant realized gains related to the exit of certain equity investments including Pfanstiehl, Inc., Pinnergy, Ltd., and Global Plasma Solutions which were among the largest markups in 2020. If these investments were sold at the fair value as of June 30, 2021, would imply potential realized gains of $66.6 million or $2.73 per share which would likely drive a significant increase in supplemental dividends over the coming quarters. Also, these investments currently account for 9.4% of the portfolio fair value and could be reinvested into income-producing assets driving higher earnings and a potential increase in the regular dividend.
We have equity investments in approximately 85.5% of our portfolio company with an average fully diluted equity ownership of 7.4%. So we do have an expectation for additional realizations and quite frankly, on both the debt and the equity side of things, primarily driven by M&A and so. I think the outlook for realizing some of the portfolio is very positive from that perspective and we would expect that to continue and we are a lot of companies that are pretty right if you will for M&A or some type of transaction. So I view the outlook from a natural perspective to be very good. When I look at the companies we control, we control a couple of companies today and so and then we have impact on some other investments where, maybe the sponsors not in total control of the situation or if it would be a negotiation, if you will, amongst ourselves and other shareholders. I wouldn’t say we’re looking to go, sell those investments right now because there’s a good outlook. But at the same time, so as I think about things, it’s for a little long in equity today, just on a percentage basis. So there’s a balance you got to strike there because I don’t want to sell too early.”
Source: FDUS Q2 2021 Earnings Call
Comparison of Changes in NAV Per Share
The following table is ranked by changes in NAV per share over the last five years with most of the BDCs ranked higher having a larger portion of the portfolio invested in equity positions. Please keep in mind that some of these BDCs could easily experience NAV declines during a recessionary period as equity positions are marked back down (deflated). BDCs with higher amounts of first-lien positions have a much more stable NAV but also do not participate in the higher returns during periods such as this. Hopefully, these BDCs will be selectively trimming their equity positions (also known as harvesting) and reinvesting into income-producing assets improving dividend coverage and stabilizing NAV in case of an economic downturn.
Please note that many of the higher quality BDCs have been paying large special and supplemental cash dividends which directly impacts NAV (negatively). These BDCs will be discussed in this series of articles.
FDUS Leverage & Portfolio Yield
Management is targeting a debt-to-equity ratio (leverage) of 1.00 which I have taken into account with the updated projections:
Q. “Just remind us where you plan to take the business from a regulatory leverage perspective.”
A. “I think we have said one-to-one especially given the complexion of our portfolio, which was weighted more towards junior debt. As you know that the portfolio is changing or the complexion of the portfolio is changing to more first lien originations and the exit of some of the second lien investments just from, just as an in natural course, should I say? So hopefully that’s helpful, but that’s how we’ve kind of thought about it as, very comfortable around the one-to-one, but we have increased flexibility today due to the complexion of the portfolio changing.”
Source: FDUS Q2 2021 Earnings Call
Also taken into account is slightly lower portfolio yield but continued fee income from portfolio activity including new originations and prepayments:
“Yields are 12% to 12.2% for us on the debt portfolio. If they were to move, I would say it probably moved down a little bit just due to yield environment and competition. I don’t expect any major swings there, but that’s kind of the, where we are today and from a competitive standpoint. So until still yields start to move forward, I would expect that there may be some very modest drifting down, that makes sense.”
Q. “On fee income note, can be rather volatile quarter to quarter, but maybe in 2022 is activity moderates, would you expect 2022 fee income to be below 2021 levels?”
A. “There’s no change in strategy from our perspective that we would expect originations to continue to be healthy in 2022 and thus there would be something income with that. We also think there’ll be some repayments, but as you heard today, think one of the six investments we had repayment penalties so not all of them have. I mean they all have them, but they expire usually after a couple of three years. So, but I would expect at least whether we match the same level of fees in 2022 versus 2021, I don’t know, but I don’t expect it to be dramatically lower at this point at all. I wouldn’t, I don’t foresee that.”
Source: FDUS Q2 2021 Earnings Call
As shown in the following table, FDUS has lower leverage (debt-to-equity) combined with higher dividend coverage over the last four quarters. I have not included the dividend coverage averages for FCRD and PTMN because I do not cover these BDCs due to having higher risk portfolios and they are thinly traded. I cover NEWT but it has a very different business model as discussed in “Newtek Business Services: Initiating Coverage“.
AINV, MRCC, and FSK have recently had higher dividend coverage only due to not paying incentive fees related to previous capital losses. Dividend coverage will decline once these companies start paying incentive fees. Also, BDCs such as SUNS with lower leverage have access to growth capital to improve dividend coverage and are likely just taking a cautious approach to rebuild their portfolios during the economic recovery.
Summary
FDUS has adopted a dividend strategy that includes an easily sustainable regular dividend as well as a variable portion to pay out the excess earnings as needed (similar to other BDCs) and was discussed on the recent call:
As a reminder, the board has devised a formula to calculate the supplemental dividend each quarter, under which 50% of the surplus and adjusted NII over the base dividend from the prior quarter, distributed to shareholders. For the third quarter, I am pleased to report that we are increasing the base dividend at $0.32 per share, and the surplus is $0.06 per share. In addition, we will pay a special dividend in Q3 of $0.04 per share. Therefore on August 2, 2021, the board of directors declared a base quarterly dividend of $0.32 per share, a supplemental quarterly cash dividend of $0.06 per share, and especial dividend of $0.04 per share.”
Source: FDUS Q2 2021 Earnings Call
On August 2, 2021, the Board increased its regular quarterly dividend from $0.31 to $0.32 per share, plus a supplemental dividend of $0.06 per share, and a special dividend of $0.04 per share for Q3 2021. FDUS has around $1.04 (previously $0.98) per share of spillover income (or taxable income in excess of distributions) that can be used for additional supplemental dividends.
I am expecting additional increases in the regular dividend plus continued supplemental/special dividends through the use of higher leverage and additional realized gains from equity positions combined with its generous 8% hurdle rate which is applied to “net assets” to determine “pre-incentive fee net investment income” per share before management earns its income incentive fees. As shown in the following table, the company will likely earn around $0.351 per share each quarter before paying management incentive fees covering around 110% of the previously increased dividend which is ‘math’ driven by an annual hurdle rate of 8% on equity. It is important to keep in mind that FDUS could earn less than $0.351 per share but management would not earn an incentive fee for that quarter as shown in the ‘worst case’ financial projections.
What Can I Expect Each Week With a Paid Subscription?
Each week we provide a balance between easy to digest general information to make timely trading decisions supported by the detail in the Deep Dive Projection reports (for each BDC) for subscribers that are building larger BDC portfolios.
Monday Morning Update – Before the markets open each Monday morning we provide quick updates for the sector including significant events for each BDC along with upcoming earnings, reporting, and ex-dividend dates. Also, we provide a list of the best-priced opportunities along with oversold/overbought conditions, and what to look for in the coming week.
Deep Dive Projection Reports – Detailed reports on at least two BDCs each week prioritized by focusing on ‘buying opportunities’ as well as potential issues such as changes in portfolio credit quality and/or dividend coverage (usually related). This should help subscribers put together a shopping list ready for the next general market pullback.
Friday Comparison or Baby Bond Reports – A series of updates comparing expense/return ratios, leverage, Baby Bonds, portfolio mix, with discussions of impacts to dividend coverage and risk.
This information was previously made available to subscribers of Premium BDC Reports. BDCs trade within a wide range of multiples driving higher and lower yields mostly related to portfolio credit quality and dividend coverage potential (not necessarily historical coverage). This means investors need to do their due diligence before buying.
This update discusses New Mountain Finance (NMFC) which continues to have a relatively higher dividend yield that is consistently covered, with a defensively positioned portfolio and management that exhibits higher quality indicators including responsiveness to personal requests for information, waived management fees, look-back feature for the capital gains portion of the incentive fee. However, NMFC does not have a best-of-breed fee structure due to income incentive fees not taking into account realized or unrealized losses. Management has “committed to paying quarterly dividends of at least $0.30 over the next seven quarters” through fee waivers.
“New Mountain was built with defensive growth industries and risk control in mind long before COVID hit. The great bulk of NMFC’s loans are in areas that might best be described as repetitive, tech-enabled business services such as enterprise software. Our companies often have large installed client bases of repeat users who depend on their service day-in and day-out. These are the types of defensive growth industries that we think are the right ones at all times, and particularly attractive in difficult times.”
The primary reason that NMFC is a ‘Tier 3’ is mostly due to needing higher amounts of leverage to cover the current dividend as well as previously realized losses of around $91 million over the last ~8 years which is around $0.94 per share using the current share count. However, NMFC’s net asset value (NAV or book value) has only declined by around $0.73 per share (since 2012) partially due to offsetting unrealized gains as well as over-earning the dividends. But of course, NMFC reduced its quarterly dividend from $0.34 to $0.30 starting in Q2 2020 as predicted in previous reports. At the time, the company had spillover or undistributed taxable income (“UTI”) which is typically used for temporary dividend coverage issues. Please do not rely on UTI as an indicator of a ‘safe’ dividend.
There is a chance that NMFC will be upgraded to ‘Tier 2’ over the coming quarters. I will be looking for continued improvement in credit quality including no new non-accruals, increased NAV per share, and realized gains mostly from Edmentum, Inc. (as discussed in this report). More importantly, I will be looking for earnings results closer to the ‘best case’ projections that take into account continued lower borrowing rates, and rotation out of equity positions into income-producing debt positions as discussed in this update.
NMFC Insider Purchases
Steve Klinsky, Founder, CEO and Chairman: “Together, New Mountain professionals have invested over $480 million personally into NMFC and New Mountain’s credit activities. I and management remain as NMFC’s largest shareholders. We have continued to add to our personal positions in the last 12 months and Rob, John, and I have never sold a share.”
NMFC Dividend Coverage Update
On May 4, 2021, NMFC entered into a fee waiver agreement and the Investment Adviser agreed to reduce the base management fees not exceed 1.25% of gross assets through December 31, 2022. Also, management has “committed to paying quarterly dividends of at least $0.30 over the next seven quarters” through additional fee waivers. There is a good chance that management would extend the fee waivers if the company was not covering its dividend but management seems confident that would not be needed.
“We implemented a dividend support program for at least until December 31, 2022, by pledging to charge no more than 1.25% management fee on all assets. For that period, we also pledged to reduce our incentive fee if needed to support the $0.30 per share dividend. We do not currently anticipate needing to use this pledge, but want shareholders to have greater confidence in the dividend.”
Contributing to its dividend coverage is the generous 8% hurdle rate which is applied to “net assets” to determine “pre-incentive fee net investment income” per share before management earns its income incentive fees. As shown in the following table, the company will likely earn around $0.267 per share each quarter before paying management incentive fees covering around 89% of the quarterly dividend which is ‘math’ driven by an annual hurdle rate of 8% on equity. It is important to keep in mind that NMFC could earn less than $0.267 per share but management would not earn an incentive fee for that quarter and the calculation is based on the net asset values from the previous quarter.
Over the next six quarters management is working to improve earnings through lowering its borrowing rates, increasing returns including from its Senior Loan Programs, and rotating the portfolio out of equity positions and non-income-producing assets:
“Equity portfolio with things like Edmentum, Benevis and UniTek and we actually believe there is tremendous potential in those names to create real economic value, but of course for every dollar that’s in a non-yielding piece of equity at non-cash and non-income yielding piece of equity that obviously is a dollar that’s not earning NII in the quarter. Our outlook continues to brighten for those names, and from a timing perspective. The timing of those uncertain right like will you because it’s a lumpy will you exit one of those and convert that into cash, that’s redeployed in NII generative traditional debt securities we just don’t know.”
Subsequent to June 30, 2021, NMFC sold around 34% of its equity position in Edmentum, Inc. which is a good thing for shareholders as management can reinvest the proceeds into other assets with higher income. As shown in the following table, NMFC’s investment is currently valued at over $154 million and accounts for 5.0% of the portfolio. NMFC received total proceeds of almost $48 million and realized gain of around $21 million or $0.22 per share.
“After quarter end, we monetized a portion of our position in Edmentum at an attractive gain, and we remain optimistic about potential gains at other existing portfolio companies. We sold approximately 34% of our equity position to Vistria and their co-investors at that same value, which will show as realized in Q3. We could have rolled our entire position. But we did think it was important to take some chips off the table. The value has grown so meaningfully, it just gets uncomfortable. And there was definitely demand in the newer investor group, even at this higher valuation. But it’s important just from a diversity standpoint, because you use it once and you never know what’s going to happen, right. The twin goals of one, de-risking and monetizing and bringing some cash in that can earn NII as opposed to equity on the one hand versus not selling too early and what I think is an incredibly strong cyclical winner with great execution capabilities.”
It should be noted that NMFC has historical net realized losses and might not need to pay out the gains to shareholders. Management was asked on the recent call and mentioned “we’ll have much more to say on that after the end of the third quarter”:
Q. “On Edmentum, it looks like this puts you in a undistributed earnings situation in some way. I don’t know if it’s how the split is between the ordinary and capital income, but if you can give any color on that, and most importantly, will you be able to retain the spillover or is that something that you’re – will this push you into a higher undistributed income situation?”
A. “It’s a great question and we’re still running the accounting on that as the third quarter evolves. And we’ll have much more to say on that after the end of the third quarter.”
Management has guided for increased amount repayments over the coming quarters which will likely drive lower leverage and has been taken into account with the updated projections:
“Page 23 shows the strength of our new deal activity since the end of the quarter, reflecting the active market that I mentioned in my opening comments. So far in the quarter, we have committed to new investments of $229 million consisting mostly of high quality private financings offset by $151 million of repayments yielding net originations of $78 million. Given the active deal environment, we do have a long list of companies on our repayment watch list, which we believe could be exiting our portfolio throughout the next quarter. These loan repayments represent a material source of cash to fund both our commitments and forward pipeline of new deals.”
There will likely be additional onetime income including accelerated OID related to the prepayments that could drive results closer to the ‘best case’ projections:
Q. “Should we expect potentially an increase in accelerated OID or fees associated with these prepayments that could increase the portfolio yield of these in the near term or are these kinds of more longer dated assets where some of those accelerated fees have kind of already run off?”
A. “There will be a lot of repayments on existing assets. And that’s life as a lender and especially life as a lender that tries to target really quality assets. We do feel very confident, that we can very successfully fill any gaps that are left from repayments, or prepayments, et cetera. And I think on the point around accelerated OID and just extra income that comes from prepayments, that is definitely true. And it’s a mixed bag. Some are going to be longer lived assets and some are going be shorter lived assets. And so I think as velocity is our friend when it comes to releasing a certain amount of modest income. So, that is – I would call it a modest tailwind.”
As discussed in the previous report, management is working to improve its net interest margins by reducing borrowing expenses. In June 2021, the company extended and reduced the borrowing rates on its NMFC Credit Facility. The company redeemed its 5.75% Baby Bond “NMFCL” on March 8, 2021, using the proceeds from its recent private placement of $200 million of 3.875% notes due 2026. These notes were also used to redeem its 5.31% unsecured notes due May 2021.
“On June 4, we amended and extended our NMFC credit facility pushing out our maturity to 2026, while decreasing our applicable spread materially by 40 basis points.”
On May 5, 2021, NMFC and SkyKnight Alpha entered into an agreement to establish a joint venture, NMFC Senior Loan Program IV (“SLP IV”) transferring/contributing 100% of their membership interest in SLP I and SLP II to SLP IV. The purpose of the joint venture is to invest primarily in senior secured loans issued by portfolio companies within its “core industry verticals”. Also, the SLP IV entered into a $370 million revolving credit facility with Wells Fargo at LIBOR plus 1.60% per annum.
Management has guided for a debt-to-equity ratio of 1.20 to 1.25 less cash and excluding SBA borrowings and is taken into account with the updated ‘base case’ projections:
“Page 14 shows that we continue to manage our statutory leverage ratio at a very comfortable level. Gross debt for the first quarter increased by $68 million, but the increase in net asset value of $48 million resulted in a relatively flat statutory leverage ratio of 1.19 times. We continue to have a number of portfolio companies currently in active sale processes. The anticipated culmination of which will give us additional financial flexibility to either reinvest or further delever. Our intention remained to manage the business at a statutory leverage ratio, net of cash of 1.0 to 1.25 times.”
As discussed in previous reports and shown in the table below, NMFC has limited downside and potential upside to rate increases similar to most BDCs:
“As you can see, the vast majority of our assets are floating rate loans, while our liabilities are 55% fixed rate and 45% floating rate. NMFC’s current bounce sheet mix offers our shareholders consistent and stable earnings in all scenarios where LIBOR remains under 1%. If base rates rise above 1% as the economy normalizes or accelerates, there is meaningful upside to NMFC’s net investment income. For example, assuming our current investment portfolio and existing liability structure, if LIBOR reaches 2%, our annual NII would increase by 8.4% or $0.10 per share. At 3% LIBOR, earnings would increase by 19% or $0.23 per share. We believe this positive interest rate optionality offers meaningful value to our shareholders.”
On January 4, 2021, NMFC announced that its Board authorized an extension of its $50 million share repurchase program “to be implemented at the discretion of NMFC’s management team”. Unless further extended by NMFC’s board of directors, the Company expects the repurchase program to be in place until the earlier of December 31, 2021, or until $50 million worth of NMFC’s outstanding shares of common stock have been repurchased.
For Q2 2021, NMFC hit best-case projections covering its dividend simply due to the previously discussed fee waivers. There was a slight decline in its portfolio yield offset by increased portfolio growth and dividend income but leverage remains. Around 95% of dividend coverage is from recurring sources which is an increase from previous quarters.
“95% of total investment income is recurring and cash income remains strong at 80% this quarter. We believe this consistency shows the stability and predictability of our investment income.”
What Can I Expect Each Week With a Paid Subscription?
Each week we provide a balance between easy to digest general information to make timely trading decisions supported by the detail in the Deep Dive Projection reports (for each BDC) for subscribers that are building larger BDC portfolios.
Monday Morning Update – Before the markets open each Monday morning we provide quick updates for the sector including significant events for each BDC along with upcoming earnings, reporting, and ex-dividend dates. Also, we provide a list of the best-priced opportunities along with oversold/overbought conditions, and what to look for in the coming week.
Deep Dive Projection Reports – Detailed reports on at least two BDCs each week prioritized by focusing on ‘buying opportunities’ as well as potential issues such as changes in portfolio credit quality and/or dividend coverage (usually related). This should help subscribers put together a shopping list ready for the next general market pullback.
Friday Comparison or Baby Bond Reports – A series of updates comparing expense/return ratios, leverage, Baby Bonds, portfolio mix, with discussions of impacts to dividend coverage and risk.
This information was previously made available to subscribers of Premium BDC Reports. BDCs trade within a wide range of multiples driving higher and lower yields mostly related to portfolio credit quality and dividend coverage potential (not necessarily historical coverage). This means investors need to do their due diligence before buying.
On October 17, 2017, Oaktree Capital (OAK) took over management from Fifth Street Asset Management as the investment advisor to OCSL formerly known as Fifth Street Finance (FSC), and OCSI, previously known as Fifth Street Senior Floating Rate (FSFR).
On November 29, 2017, OCSL announced calendar Q3 2017 results including a 14% decline in net asset value (“NAV”) per share (from $7.17 to $6.16).
On February 8, 2018, OCSL announced a 32% decrease in the quarterly dividend (from $0.125 to $0.085).
Over the last ~3.5 years, NAV has increased back to $7.22 and the quarterly dividend is $0.145.
It should be noted that over the last 14 quarters OCSL has covered the dividend by an average of 127%. This means that management was purposely over-earning the dividend (underpaying the shareholders) which was responsible for around $0.40 per share of NAV growth/reflation.
In March 2021, OCSL closed its merger with Oaktree Strategic Income (OCSI). In connection with the merger agreement, Oaktree has agreed to waive $750,000 of base management fees payable in each of the eight quarters following the closing.
For the quarter ended June 30, 2021, OCSL easily covering its quarterly dividend by 144% due to higher prepayment fees and accelerated OID mostly from William Morris Endeavor:
Adjusted net investment income per share was $0.19, up from $0.14 for the prior quarter, driven by higher adjusted investment income that included higher prepayment fees and OID acceleration. We received $171 million from paydown and exits in the quarter. This included our position in William Morris Endeavor, which generated $7 million of prepayment income that contributed to earnings.”
I am expecting continued improvement in OCSL’s earnings over the coming quarters through the use of higher leverage (portfolio growth), continued rotation into higher yield investments, accretive impacts from the merger including fee waivers as well as higher returns from its Kemper and Glick joint ventures.
We remain focused on positioning the portfolio for an improved yield by rotating out of lower-yielding investments and into higher-yielding proprietary loans. We made good progress on this in the third quarter, exiting $39 million of these types of investments. As of quarter end, $142 million of senior secured loans priced at or below LIBOR plus 4.5% remained in the portfolio, including approximately $67 million of loans that we acquired in the OCSI merger. Our new investments during the quarter came in at attractive yields which means there is significant improvement in yield on that portion of the portfolio that can be realized over time. We exited some low-yielding investments and made further progress on exiting noncore investments, monetizing $19 million across 3 equity positions. Noncore investments represented just 6% of the portfolio at fair value at quarter end. The weighted average yield on our new debt investment commitments was an attractive 9.2% and compares favorably to the average yield of 6.1% on investments that we exited.”
We also have the opportunity to further optimize both of our joint ventures. We can accomplish this by selectively rotating out of lower-yielding investments into higher-yielding ones as well as increasing leverage at the JVs. We made good progress on this front in the quarter, growing the JV portfolios by $36 million. The Kemper JV had $387 million of assets invested in senior secured loans to 57 companies. This compared to $352 million of total assets invested in 55 company’s last quarter. Leverage at the JV was 1.4x at quarter end, up slightly from 1.3x in the March quarter. Given the strong balance sheet and earnings power at the Kemper JV, OCSL received a $450,000 dividend this quarter. We anticipate we will receive a dividend in this amount going forward. The Glick JV had $148 million of assets at June 30. These consisted of senior secured loans to 38 companies. Leverage at the JV was 1.1x at quarter end. OCSL subordinated note in the Glick joint venture totaling $55 million continues to be current. We expect to receive ongoing coupon interest and principal repayments of approximately $1.3 million per quarter on a run rate basis going forward.”
On May 11, 2021, OCSL announced that it had priced $350 million of 2.700% of unsecured notes due January 15, 2027, taken into account with my updated projections. OCSL had growth capital available given its historically low leverage with a debt-to-equity ratio of 0.79 (net of cash) as of June 30, 2021.
Another opportunity for us to increase ROE is by deploying more leverage at the portfolio level. As of June 30, our net leverage was below the low end of our long-term target of 0.85 to 1.00. We would expect to continue to enhance returns as we make incremental investments and deploy higher leverage.”
On August 5, 2021, OCSL announced a $0.145 per share for Q3 2021, up 11.5% from the prior quarter paid on September 30, 2021, to stockholders of record on September 15, 2021.
Armen Panossian, CEO and CIO: “The third quarter was highlighted by strong earnings and continued robust portfolio performance. Adjusted net investment income was $0.19 per share, up 58% from the same quarter a year earlier. This reflected new origination activity at attractive yields over the prior year and the successful exit of one of our opportunistic investments made in the wake of the pandemic. NAV grew again this quarter to $7.22 per share, a 1.8% increase from March 31, 2021, as the portfolio continues to perform well and our credit quality remains excellent.”
As mentioned earlier, OCSL’s earnings will continue to improve through the use of higher leverage, continued rotation into higher yield investments, accretive impacts from the merger including fee waivers as well as higher returns from its joint ventures. Even after taking into account the recent increase in the regular quarterly dividend from $0.130 to $0.145 per share, OCSL is still paying less dividends as a % of NAV (equity/book value) than the average BDC. The average BDC pays around 9.3% of NAV per share in distributions each year which would be around $0.168 per share per quarter for OCSL (using the current NAV of $7.22). I am currently projecting additional dividend increases to $0.16 per quarter or $0.64 annually which would imply a dividend yield of 8.8% based on the current price of $7.24 (as of August 26, 2021).
As shown in the following table, OCSL has lower leverage (debt-to-equity) combined with higher dividend coverage over the last four quarters. I have not included the dividend coverage averages for FCRD and PTMN because I do not cover these BDCs due to having higher risk portfolios and they are thinly traded. I cover NEWT but it has a very different business model as discussed in “Newtek Business Services: Initiating Coverage“.
AINV, MRCC, and FSK have recently had higher dividend coverage only due to not paying incentive fees related to previous capital losses. Dividend coverage will decline once these companies start paying incentive fees. Also, BDCs such as SUNS with lower leverage have access to growth capital to improve dividend coverage and are likely just taking a cautious approach to rebuild their portfolios during the economic recovery.
What Can I Expect Each Week With a Paid Subscription?
Each week we provide a balance between easy to digest general information to make timely trading decisions supported by the detail in the Deep Dive Projection reports (for each BDC) for subscribers that are building larger BDC portfolios.
Monday Morning Update – Before the markets open each Monday morning we provide quick updates for the sector including significant events for each BDC along with upcoming earnings, reporting, and ex-dividend dates. Also, we provide a list of the best-priced opportunities along with oversold/overbought conditions, and what to look for in the coming week.
Deep Dive Projection Reports – Detailed reports on at least two BDCs each week prioritized by focusing on ‘buying opportunities’ as well as potential issues such as changes in portfolio credit quality and/or dividend coverage (usually related). This should help subscribers put together a shopping list ready for the next general market pullback.
Friday Comparison or Baby Bond Reports – A series of updates comparing expense/return ratios, leverage, Baby Bonds, portfolio mix, with discussions of impacts to dividend coverage and risk.
This information was previously made available to subscribers of Premium BDC Reports. BDCs trade within a wide range of multiples driving higher and lower yields mostly related to portfolio credit quality and dividend coverage potential (not necessarily historical coverage). This means investors need to do their due diligence before buying.
Golub Capital is considered a lower risk BDC for many reasons including its higher credit quality portfolio of mostly lower yield first-lien and one-stop loans with strong covenant and security protections in mostly non-cyclical sectors. Also, the portfolio is well diversified with very low concentration risk and with an average investment size of less than 0.4% of the portfolio and the top 10 accounting for around 16%.
Source: GBDC Earnings Presentation
GBDC Conservative Management and Fee Structure
It should be noted that GBDC is for lower yield investors with conservative management, lower yield portfolio investments, and investor-friendly fee structure including a base management fee of 1.375% of average adjusted gross assets (compared to 1.50% to 2.00%, for most) excluding cash and cash equivalents. GBDC’s fee structure includes a “total return hurdle” which means that its incentive fee structure protects total returns to shareholders by taking into account capital losses when calculating the income portion of the fee. Also, incentive fees are only paid after the hurdle rate is reached, requiring a minimum return on net assets of 8% annually. However, GBDC currently is below the 8% hurdle so management was not paid an incentive fee for the quarter ended June 30, 2021, as discussed later.
During the early stages of the COVID crisis, management took various measures to strengthen the balance sheet including a ‘rights offering’ as well as reducing the quarterly dividend from $0.33 to $0.29 per share. As shown in the previous chart 100% of GBDC’s loans are at floating rates which were impacted as the Fed reduced rates.
To be completely honest I think the rights offering was not needed as GBDC already had relatively lower leverage/stronger asset coverage coupled with higher quality assets (to support higher leverage). However, management was likely just taking a conservative approach not knowing the full extent of the impacts of the pandemic on its portfolio companies which might need additional capital drawing on the unfunded commitments which was a large concern at the time.
Source: GBDC Earnings Presentation
On May 14, 2020, GBDC announced the final results of its transferable rights offering, which entitled holders of rights to purchase one share of common stock for every right held at a subscription price of $9.17 per share.
Along with most of my subscribers, I took full advantage of the offering easily outperforming the S&P 500 over the last 17 months:
Operating Cost as a Percentage of Available Income
As a part of assessing BDCs, it’s important to take into account expense ratios. BDCs with lower operating expenses can pay higher amounts to shareholders without investing in riskier assets.
“Operating Cost as a Percentage of Available Income” is one of the many measures that I use which takes into account operating, management, and incentive fees compared to available income.
“Available Income” is total income less interest expense from borrowings and is the amount of income that is available to pay operating expenses and shareholder distributions.
Many BDCs have been temporarily waiving fees or have fee agreements that take into account previous capital losses that are ending this year. The following table shows the average adjusted operating cost ratios for each BDC over the last four quarters without the benefit of temporary fee waivers with examples for GBDC and PSEC.
GBDC Dividend Coverage
I’m expecting improved dividend coverage for GBDC over the coming quarters for many reasons including portfolio growth through increased leverage, lower borrowing rates, and improved net interest margins, as well as recent/continued increases in its net asset value (“NAV”) per share.
The following table shows the “pre-incentive fee net investment income” per share beforemanagement earns income incentive fees based on “net assets.” GBDC will likely earn around $0.30 per share each quarter before paying management incentive fees which is “math” driven by an annual hurdle rate of 8% on equity. It’s important to note that the calculation is based on the net asset values from the previous quarter.
As mentioned earlier, GBDC is currently below the 8% hurdle so management was not paid an incentive fee for the quarter ended June 30, 2021. As you can see in the following table, GBDC’s earnings/NII per share has been improving even with similar amounts of total income mostly due to lower incentive fees paid to management as NAV continues to increase as discussed later in this report.
GBDC Leverage and Portfolio Growth
BDCs with higher quality portfolios can support higher leverage. Around 96% of GBDC’s portfolio is bank-like quality debt positions at much lower yields than typical BDCs:
Source: SEC Filing
The following table shows each BDC ranked by its debt-to-equity ratio net of cash along with its portfolio mix. The “Other” column includes everything that is NOT first or second-lien secured debt. I typically do not cover most of the higher-risk BDCs for many reasons but mostly because these are NOT typically buy-and-hold investments. PTMN, FSK, FCRD, PSEC, and OXSQ have higher risk portfolios due to higher amounts of non-secured debt, joint ventures, senior loan programs, CLOs, and/or equity positions that all carry much higher external leverage.
Many of the BDCs with lower leverage also have lower dividend coverage over the last four quarters including GBDC. I’m expecting improved dividend coverage for many BDCs as leverage increases as well as higher amounts of first-lien positions (to support higher leverage).
Management is expecting higher portfolio growth over the coming quarters partially due to lower amounts of prepayments:
Q. “I know you guys were just slightly below the low end of your hurdle rate this quarter and therefore, did not earn the incentive fee. I’m just curious, are you OK with, I guess, operating around that area kind of right at or even below the low end of your hurdle, or would you – is the goal to essentially generate an ROE that’s maybe above that 8%. I’m just trying to get your thoughts around the hurdle rate.”
A. “I think this quarter was a bit of an anomaly because the degree of repayments was as high as it was. My expectation is that we’re going to see growth in the size of the portfolio that in turn will grow net investment income and will give us more pre-incentive fee net investment income. I think when we look backwards, we’ll see this quarter as a bit of an anomaly in the respect that you’re mentioning. I think it’s good for shareholders, if we can operate in or above the catch-up as opposed to below the catch-up, provided we can do so without taking too much credit risk.”
“Let’s look together at page 12 of the presentation and the second line in the table, exits and sales of investments. And you can see that the June 30, 2021 quarter at $583.5 million is the outlier on this chart. It’s literally more than twice the December 31 quarter, 1.5 times the March 31 quarter. So, if you ask me to make a prediction, my prediction is that we will not see a sustained level of exits and sales of investments at the June 30th level. Over time, in my experience, our assets tend to have a weighted average life between 2.5 and 3 years. The $583.5 is effectively a weighted average life that’s closer to 2. I think we’re going to be able to continue to make good progress on originations. I think exits and sales will moderate, and we’ll start seeing some portfolio growth.”
On Oct. 7, 2021, GBDC priced $200 million of notes due 2026 (YTM of 2.667%) and $100 million of notes due 2024 (YTM of 1.809%). These are excellent fixed rates for flexible unsecured borrowings due 2026 and 2024.
It’s important to note that GBDC has not announced the note offering on its website and there was no press release as of the writing of this article and this information was only available through the associated SEC filings which included:
As of October 4, 2021, we had approximately $2.6 billion of debt outstanding, approximately $1.2 billion of which was unsecured senior indebtedness (represented by the 2024 Notes, the Existing Notes, and the 2027 Notes) that will rank equal to the Notes, approximately $954.7 million of which was indebtedness secured by substantially all of the assets of our subsidiaries and that will be structurally senior to the Notes, and approximately $472.1 million of which was indebtedness secured by substantially all of our assets and that will be effectively senior to the Notes. As of October 4, 2021, we had no amounts outstanding under the debentures of the SBIC Fund, or the SBA Debentures.”
Source: SEC Filing
This information is important as is it implies that GBDC had an active calendar Q3 2021 with plenty of portfolio growth that I have taken into account with the updated financial projections. As shown in the table below, GBDC had $2.1 billion in debt outstanding and $154 million in cash (as of June 30, 2021) which is above the average cash balance of around $30 million for the previous quarters. This implies that GBDC had portfolio growth of around 10% or $400 million to $500 million which would be its largest quarter of net originations (after taking into account repayments) but of course we do not have the amount of cash available and other items that could temporarily impact the amount debt. However, there’s a very good chance that GBDC had an excellent quarter with significant portfolio growth for improved earnings over the coming quarters.
As shown in the table below, $2.6 billion in debt would be meaningfully higher than previous quarters:
Why Is This Information Important?
Great question and the easy answer is “a meaningful improvement in dividend coverage” over the next two quarters. How meaningful? This is where you need to do your own due diligence to assess the impacts on dividend coverage. Obviously, you’re busy and maybe do not have time to put together a financial projection which is why many people use various research services that cover BDCs which can be difficult to find. Especially services focused on BDCs as they are very different from other income-oriented investments.
First of all, you need a service that will keep you up to date on information contained in the SEC filings as well as when BDCs start to report results which is starting next week. Please make sure that your service provides detailed financial projections for each of the BDCs that you plan to invest in because historical coverage is not a good indicator of upcoming coverage. For each BDC I use a “Base” case projection along with “Best” and “Worst” cases over the next three quarters. I find that going out much further than three quarters is pointless as BDC balance sheets change constantly adapting for upcoming economic conditions.
I typically do not provide financial projections in public articles but below is a quick example of the ‘base case’ projections for GBDC taking into account the previously discussed information as well as the rest of the information provided in this article including changes to borrowing rates, net interest margin, and management fee agreement.
Again, historical dividend coverage is not a good indicator of upcoming coverage for many reasons including access to growth capital and temporary fee waivers (discussed earlier) so please make sure that you’re getting this information before investing in BDCs.
GBDC Improved Net Interest Margin
Similar to all BDCs, management is working to reduce borrowing rates including the recently issued notes and lower-cost credit facilities. On Aug. 3, 2021, GBDC issued $350 million of unsecured notes at 2.050% (yield-to-maturity of 2.274%) due in 2027 using a portion of the proceeds to redeem $189 million of notes with a weighted average interest rate of 3-month LIBOR + 2.44%. This is an excellent fixed rate for flexible unsecured borrowings due 2027. In April 2021, the company amended its revolving credit facility with Morgan Stanley reducing the interest rate on borrowings to 1-month LIBOR + 2.05% from 1-month LIBOR + 2.45%.
Source: GBDC Earnings Presentation
On August 3rd, we issued $350 million of unsecured notes, which bear a fixed interest rate of 2.05% and mature on February 15, 2027, bringing unsecured debt up to approximately 50% of GBDC’s total funding mix. The $350 million issuance of new unsecured notes mature in February 2027 and have a fixed interest rate of 2.05%, the lowest coupon ever achieved by a BDC at the time.”
Source: GBDC Earnings Call
Source: GBDC Earnings Presentation
As shown in the following chart, the net interest margin (green line) increased to 5.1% due to the continued decline in the weighted average cost of borrowings.
This graph summarizes portfolio yields and net investment spreads for the quarter, focusing first on the light blue line. This line represents the income yield or the actual amount earned on our investments, including interest and fee income, but excluding the amortization of upfront origination fees and the GCIC purchase price premium. The income yield decreased by 10 basis points to 7.4% for the quarter ended June 30, 2021. The investment income yield or the dark blue line, which includes the amortization of fees and discounts, also decreased by 10 basis points to 7.9% during the quarter. Our weighted average cost of debt, or the aqua blue line, decreased by 20 basis points to 2.8%, primarily due to the early redemption of $165 million in higher-priced SBIC debentures in the prior quarter. Our net investment spread, the green line, which is the difference between the investment income yield and the weighted average cost of debt, increased by 10 basis points to 5.1%.”
Source: GBDC Earnings Call
Source: GBDC Earnings Presentation
What Can I Expect Each Week With a Paid Subscription?
Each week we provide a balance between easy to digest general information to make timely trading decisions supported by the detail in the Deep Dive Projection reports (for each BDC) for subscribers that are building larger BDC portfolios.
Monday Morning Update – Before the markets open each Monday morning we provide quick updates for the sector including significant events for each BDC along with upcoming earnings, reporting, and ex-dividend dates. Also, we provide a list of the best-priced opportunities along with oversold/overbought conditions, and what to look for in the coming week.
Deep Dive Projection Reports – Detailed reports on at least two BDCs each week prioritized by focusing on ‘buying opportunities’ as well as potential issues such as changes in portfolio credit quality and/or dividend coverage (usually related). This should help subscribers put together a shopping list ready for the next general market pullback.
Friday Comparison or Baby Bond Reports – A series of updates comparing expense/return ratios, leverage, Baby Bonds, portfolio mix, with discussions of impacts to dividend coverage and risk.
This information was previously made available to subscribers of Premium BDC Reports. BDCs trade within a wide range of multiples driving higher and lower yields mostly related to portfolio credit quality and dividend coverage potential (not necessarily historical coverage). This means investors need to do their due diligence before buying.