Previous Quick Market Updates:
Relative Strength Index or RSI is an indicator that I use after I already know which BDCs I would like to purchase, but waiting for a good entry point. Please see the definition from Investopedia as well as the discussion of net interest rate spreads
The following is a quick update that was previously provided to subscribers of Premium Reports along with target prices, dividend coverage and risk profile rankings, credit issues, earnings/dividend projections, quality of management, fee agreements, and my personal positions on all business development companies (“BDCs”) please see Deep Dive Reports.
Quick BDC Market Update:
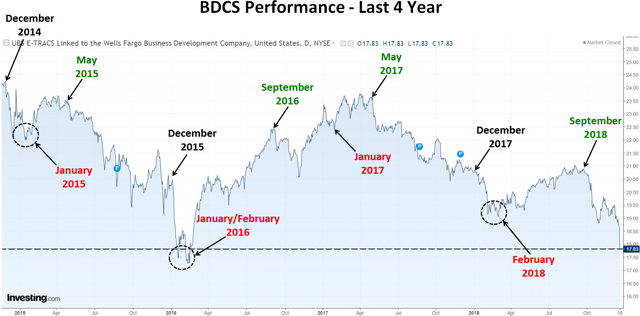
As predicted in previous updates, the BDC sector continues to pull back and as shown in the chart below, BDCS is now near the previous lows from January/February 2016. The following are three mostly likely general market scenarios and what I will be doing in each case:
- ‘Dead cat bounce’ where stock prices start to rebound but then continue down. In this scenario, I will be making select purchases and then waiting to make meaningful purchases of many BDCs likely in January/February 2019.
- Continued market declines through January/February 2019 where I will be waiting for the selling pressures to abate before making multiple purchases.
- A solid round of good news regarding interest rate policy and the economy driving a full rebound back to previous levels where I will be making meaningful purchases on the way back up.
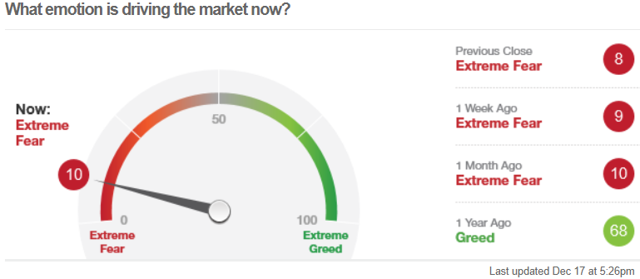
As shown in the chart below, the average BDC stock price typically declines from December through January/February and then rallies through May or September. Clearly this could be coincidence but BDCs are largely retailed-owned and pricing often does not follow the fundamentals which are strong as most companies are beating expectations, with higher NII/NAV and special dividends. There have been a handful of BDCs reporting new credit issues including MRCC, FSIC, TCRD but I view these idiosyncratic. There is a good chance that I will be holding off on making significant purchases until January but could make smaller individual purchases over the coming weeks. I am expecting continued lower BDC prices partially due to tax-loss harvesting and then retail investor fear-related selling. These are the “chicken little” sellers fearing the worst and selling when they should be buying.
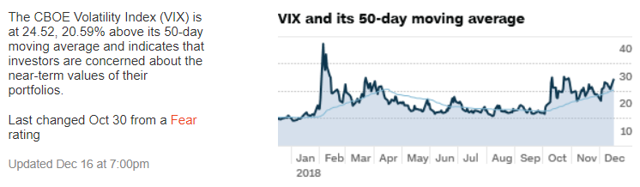
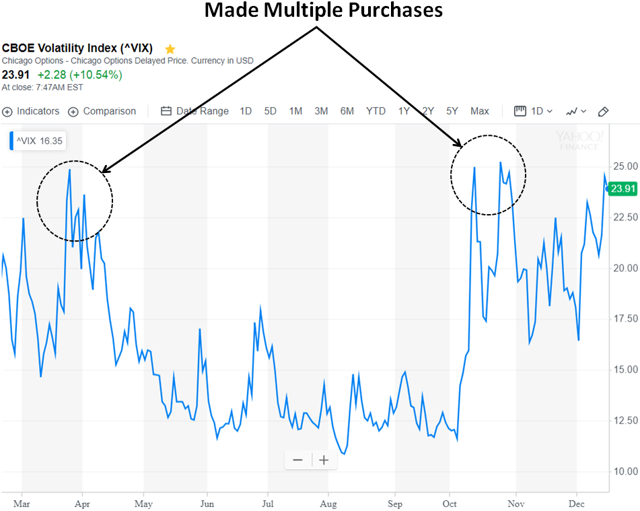
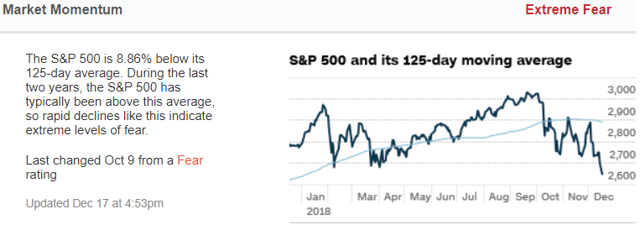
S&P Volatility Index:
As shown below, the volatility index is approaching levels where I like to make multiple purchases similar to earlier this year discussed in the BDC Buzz Positions report.
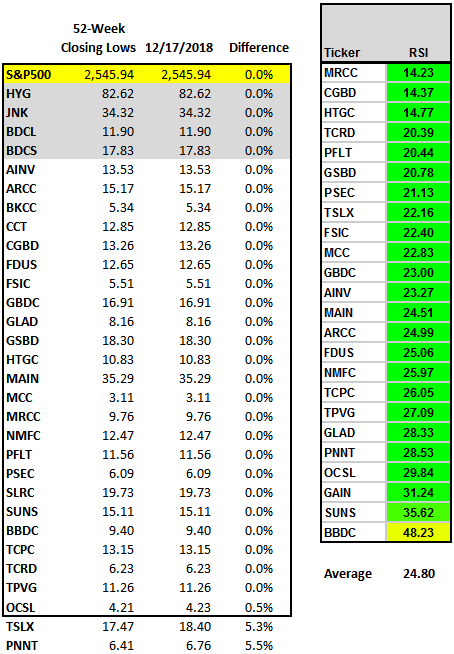
Stocks Near New Lows:
The following table shows the current pricing for each BDC compared to the closing lows over the last 52 weeks. As you can see, most companies are trading at new lows as well as the S&P 500 and high-yield corporate bond ETFs such as the iShares iBoxx $ High Yield Corporate Bond ETF (HYG) and the SPDR Barclays High Yield Bond ETF (JNK). Also, the average RSI is now below 25 indicating that BDCs are seriously oversold.
Current BDC Yields:
As mentioned in previous updates, we have recently experienced windows of wider interest rate spreads for non-investment grade debt and higher quality BDCs typically have much higher portfolio growth during these periods as they take advantage of higher market yields. This drives counter-intuitive pricing and is usually the time when investors are discounting pricing for BDC stocks.
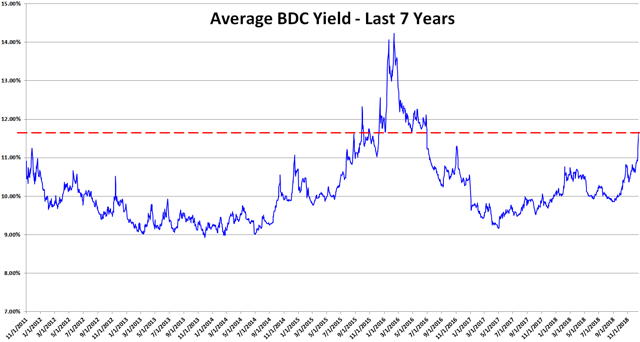
The average BDC yield is around 11.7% which is much higher-than-average over last seven years:
Are BDCs Overbought or Oversold?
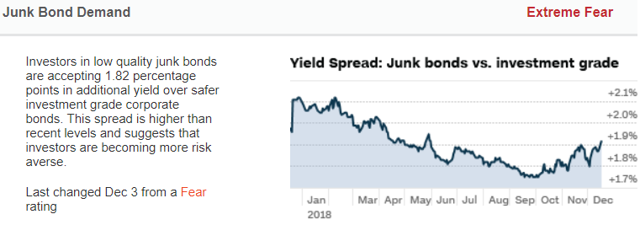
I closely watch the yield spreads between BDCs and other investments including the ‘BofA Merrill Lynch US Corporate B Index’ (Corp B) that has increased from 6.36% to 7.57% since October 1, 2018. This is meaningful for many reasons but mostly due to indicating higher yields expected by investors for non-investment grade debt that will likely result in higher portfolio yields over the coming quarters as discussed earlier.
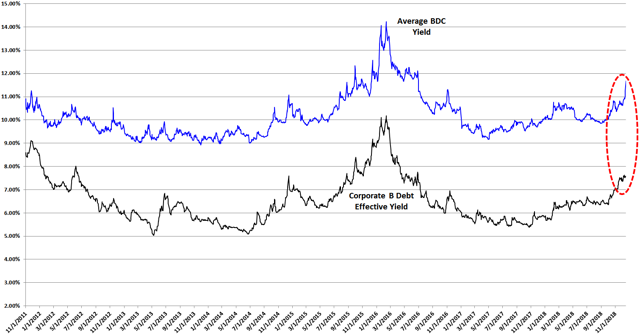
Yield spreads are important to monitor as they can indicate when a basket of investments is overbought or oversold compared to other yield-related investments. However, general market yields can change at any time. Also, spreads change depending on perception of risk and these are only averages that then need to be assigned a range for assessing individual investments/BDCs. BDCs can be volatile and timing is everything for investors that want to get the “biggest bang for their buck” but still have a higher quality portfolio that will deliver consistent returns over the long-term. As you can see, the average BDC yield is still trending higher:
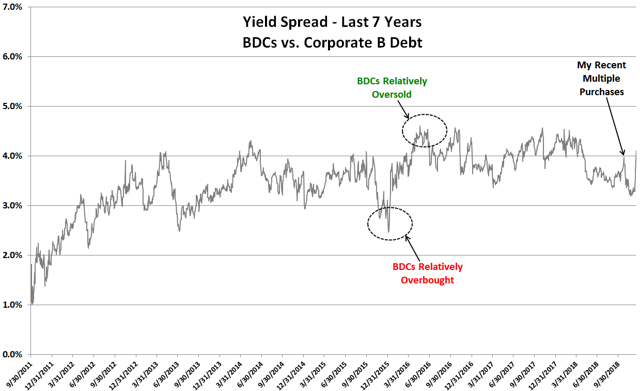
The following chart uses the information from the previous chart showing the average yield spread between BDCs and Corp B. I consider BDCs oversold when the yield spread approaches 4.0% higher and overbought when it is closer to 3.0%. As shown in the chart below, my recent purchase of multiple BDCs in October 2018 was the last time the yield spread was 4.0% but is now again these levels. The average BDC is currently yielding around 11.68% compared to Corp B at 7.57% for a current yield spread of 4.1% and I will be making purchases of individual BDCs over the next few weeks as discussed earlier and in the Upcoming BDC Buzz Purchases: December 2018 report.
For BDC target prices, dividend coverage and risk profile rankings, credit issues, earnings/dividend projections, quality of management, fee agreements, and my personal positions on all BDCs please see Premium Reports.
Saved as a favorite, I love your web site!