Previous Quick Market Update:
The following is a quick update that was previously provided to subscribers of Premium Reports along with target prices, dividend coverage and risk profile rankings, credit issues, earnings/dividend projections, quality of management, fee agreements, and my personal positions on all business development companies (“BDCs”) please see Deep Dive Reports.
Quick BDC Market Update:
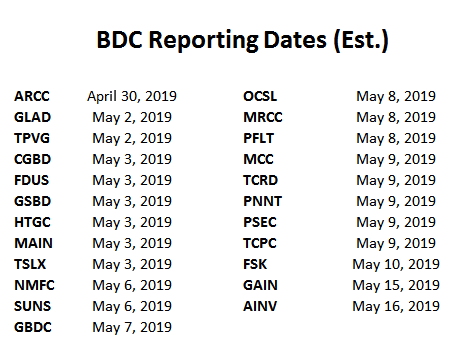
- BDCs will begin reporting Q1 2019 results later this month. Please see reporting schedule below.
- As predicted in previous updates, BDC prices rebounded strongly in Q1 2019.
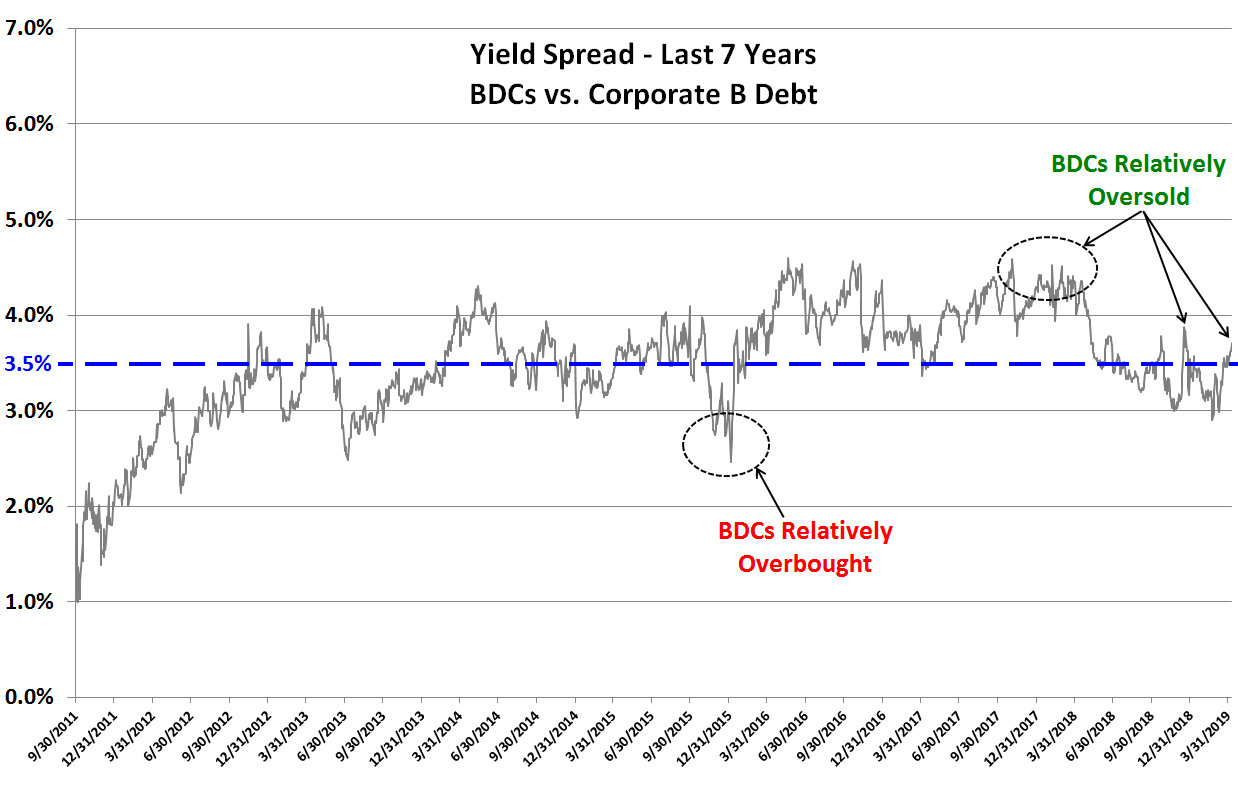
- I closely watch the yield spreads between BDCs and other investments including the ‘BofA Merrill Lynch US Corporate B Index’ (Corp B). I consider BDCs oversold when the yield spread is 4.0% higher and overbought when it is 3.0% lower.
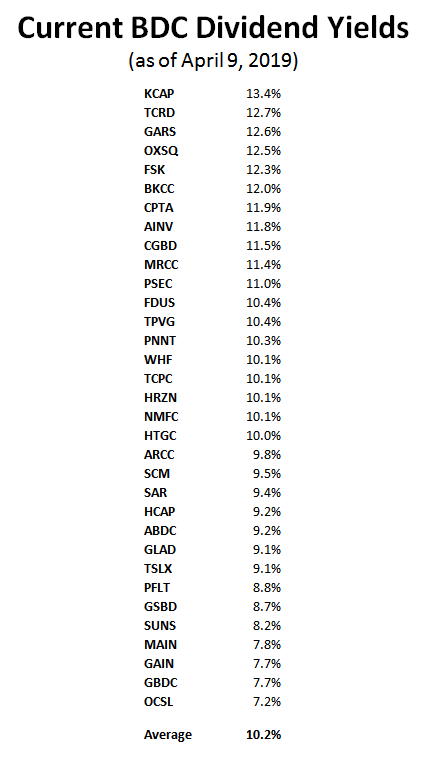
- The average BDC dividend yield is now over 10.2% and 3.7% higher than Corp B implying that the BDC sector is heading into oversold territory.
- BDC fundamentals remain strong including a healthy U.S. economy, low market defaults and most BDCs focused on protecting shareholder capital with first-lien assets with protective covenants as discussed in many Deep Dive reports.
Estimated BDC Reporting Schedule
Are BDCs Overbought or Oversold?
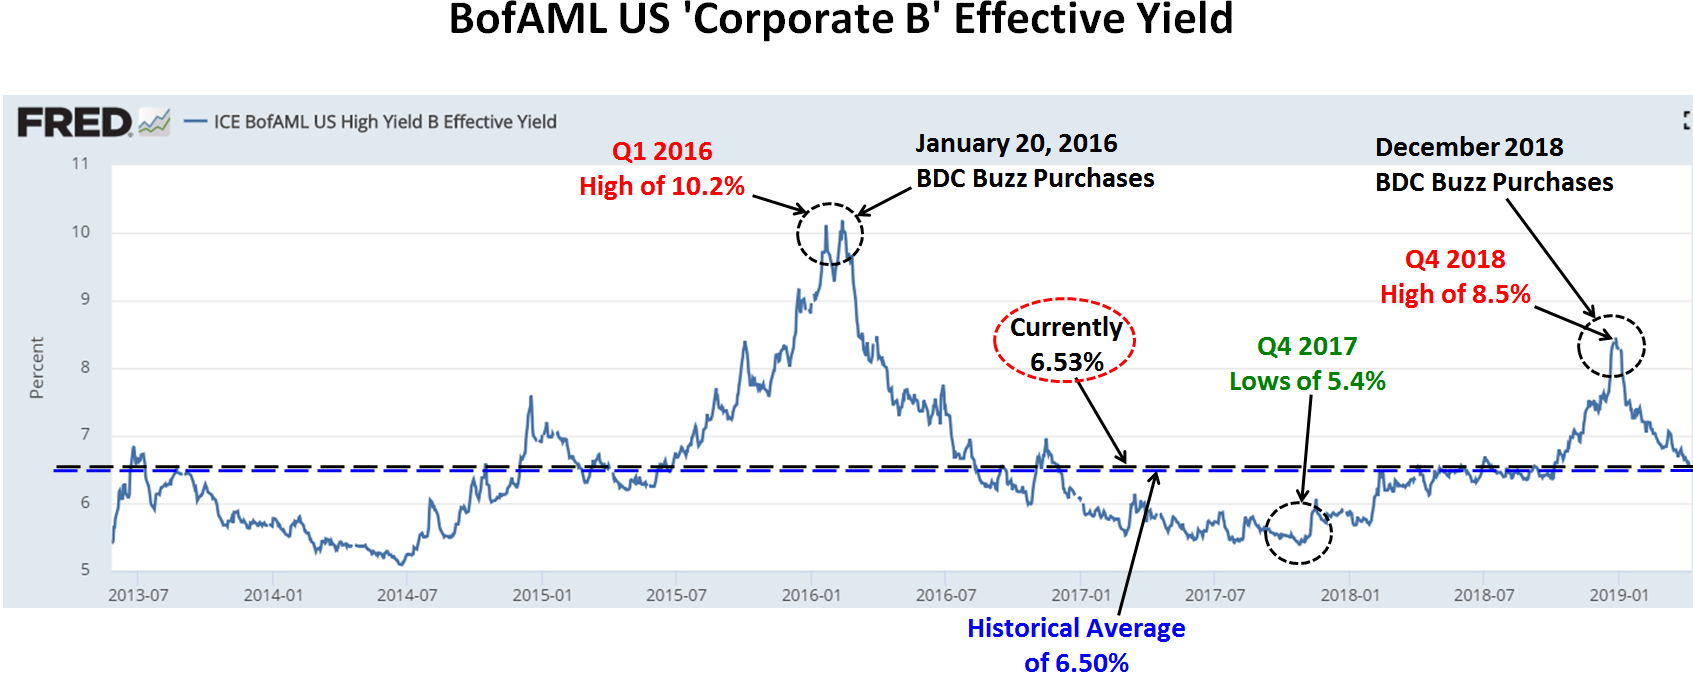
Business Development Company (“BDC”) pricing is closely correlated to yield spreads including other non-investment grade debt and ‘BofA Merrill Lynch US Corporate B Index’ (Corp B). As shown in the chart below, I typically make multiple purchases when Corp B effective yields rise including January/February 2016, when the markets experienced similar concerns of slowing Chinese growth and increased energy sector defaults driving higher yield expectations, especially for non-investment grade debt (Junk bonds suffer a rare negative return in January).
Also shown in the chart below, is the recent pullback in Corp B yields which is/was driving higher BDC pricing this year.
Yield spreads are important to monitor as they can indicate when a basket of investments is overbought or oversold compared to other yield-related investments. However, general market yields can change at any time. Also, spreads change depending on the perception of risk and these are only averages that then need to be assigned a range for assessing individual investments/BDCs. BDCs can be volatile and timing is everything for investors that want to get the “biggest bang for their buck” but still have a higher quality portfolio that will deliver consistent returns over the long-term.
I closely watch the yield spreads between BDCs and other investments including the ‘BofA Merrill Lynch US Corporate B Index’ (Corp B) that recently increased from 6.36% on October 1, 2018, to 8.45% on December 26, 2018. However, as discussed earlier, these yields have been declining in 2019 and are currently around 6.53% (compared to the historical average of 6.50%). This is meaningful for many reasons but mostly due to indicating higher (or lower) yields expected by investors for non-investment grade debt.
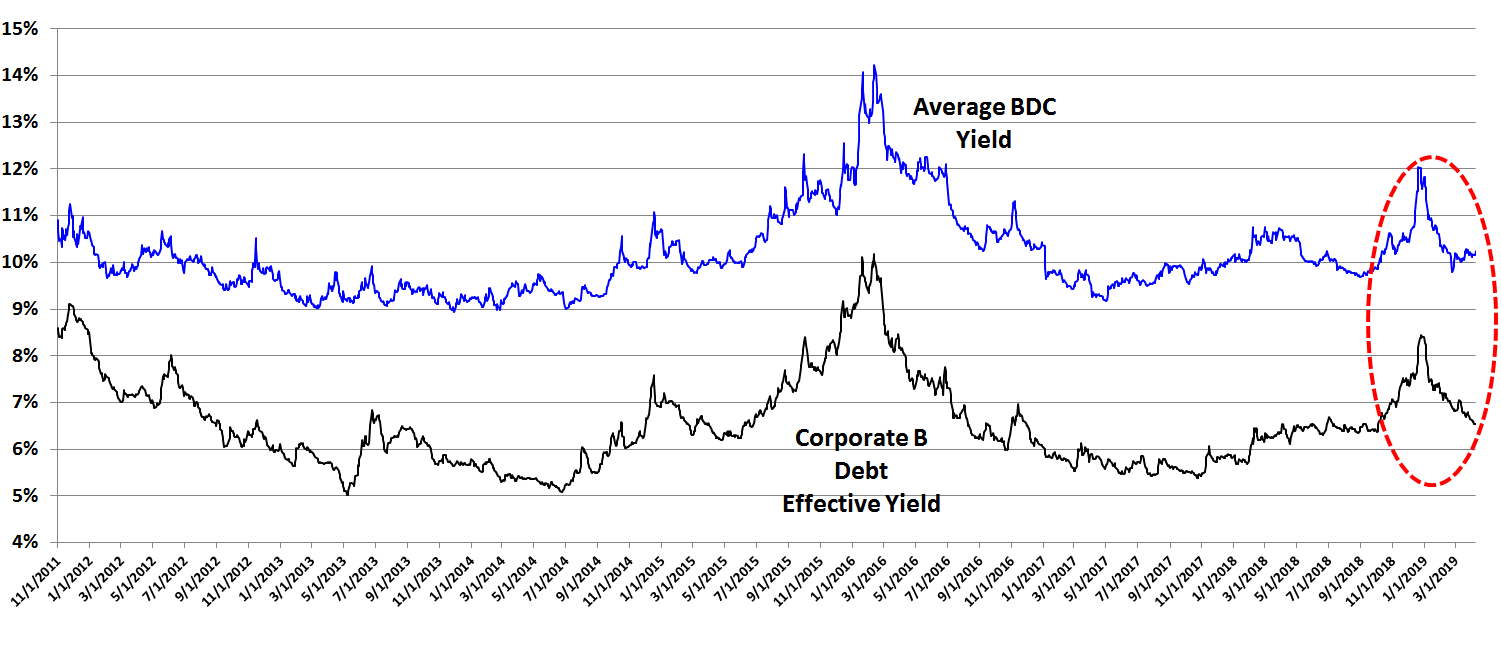
The following chart uses the information from the previous chart showing the average yield spread between BDCs and Corp B. I consider BDCs oversold when the yield spread is 4.0% higher and overbought when it is 3.0% lower.
As shown in the chart below, the BDC sector is heading into oversold territory as the current yield spread is slightly over 3.7% (the difference between 10.2% for BDCs and 6.5% for Corp B). Please see the table at the end of this update for a list of current BDC yields.
Establishing a Range of Yields for BDCs:
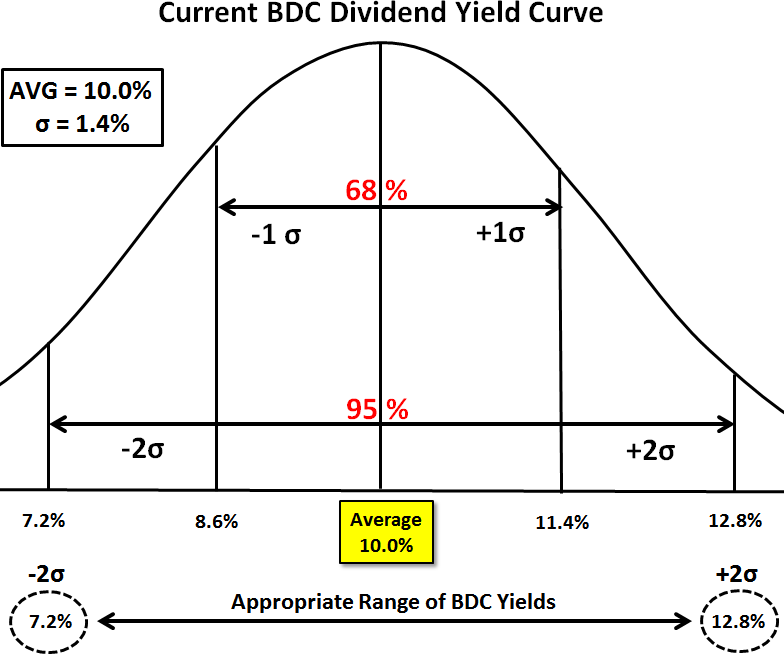
Initially, I start with a baseline average yield that is driven by various comparable investment spreads. As shown in the first chart, the average historical yield of the ‘BofA Merrill Lynch US Corporate B’ index is around 6.5% with an average BDC yield spread of 3.5% implying an expected average BDC yield of 10.0%. I use the “standard deviation” or [σ] of the current BDC yields to develop an appropriate range. The following diagram shows a typical “bell curve” or normal distribution of results, with 95% represented within 2 standard deviations of the mean. The current standard deviation [σ] is around 1.4%. I use 2.0 σ to come up with a range that should accommodate around 95% of all BDCs which calculates to yields between 7.2% and 12.8% as shown in the diagram below.
Once I have established an appropriate yield range for BDCs, I assign a corresponding yield to each BDC using rankings of risk and dividend coverage. It is important for subscribers to understand that much more analysis goes into the pricing for each company.
For BDC target prices, dividend coverage and risk profile rankings, credit issues, earnings/dividend projections, quality of management, fee agreements, and my personal positions on all BDCs please see Premium Reports.
Analyzing BDCs: