The following is from the PNNT Quick Update that was previously provided to subscribers of Premium BDC Reports along with revised target prices, dividend coverage and risk profile rankings, potential credit issues, earnings/dividend projections, quality of management, fee agreements, and my personal positions for all business development companies (“BDCs”).

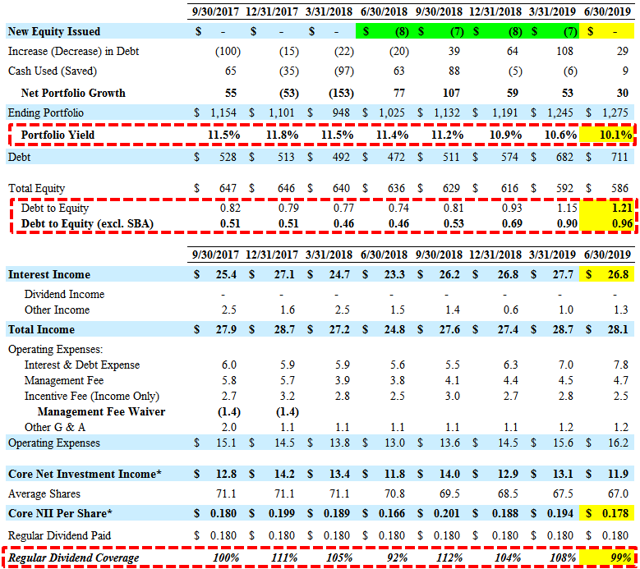
For calendar Q2 2019, PNNT reported just below its base case projections mostly due to lower-than-expected portfolio yield partially offset by higher ‘other income’. ‘Provision for taxes’ of $0.3 million is not included when calculating ‘Core NII’ resulting in net investment income (“NII”) per share of $0.178 and 99% coverage of the dividend.
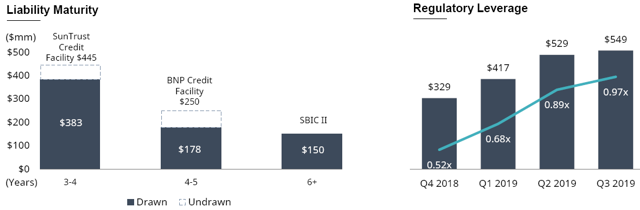
There was a meaningful decline in the overall portfolio yield from 10.6% to 10.1% as expected partly due to the previously discussed exit of its largest investment Parq Holdings in May 2019 that was yielding 14.6%. On February 5, 2019, shareholders approved the adoption of the modified asset coverage requirements allowing higher leverage and the advisor agreed to reduce the base management fee from 1.50% to 1.00% on gross assets that exceed 200%.
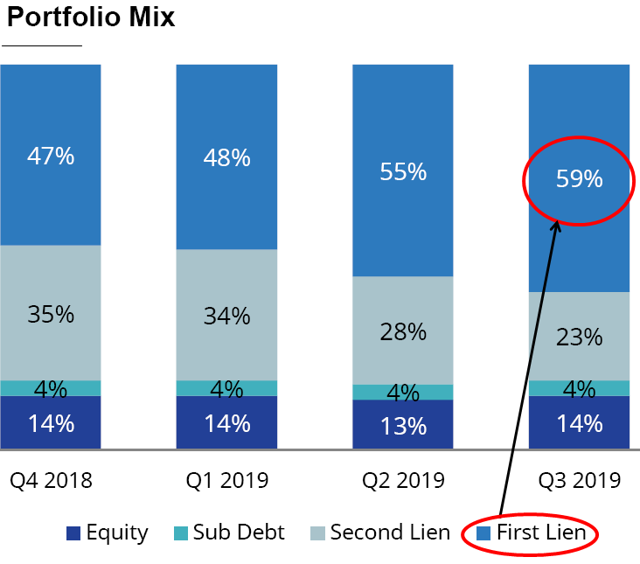
Art Penn, Chairman and CEO: “We are pleased that we are making substantial progress toward enhancing our portfolio by moving into more senior secured positions, which we believe will result in even more steady and stable coverage of our dividend over time. Additionally, our earnings stream will continue to improve based on a gradual increase in our debt to equity ratio, while maintaining a prudent debt profile.”
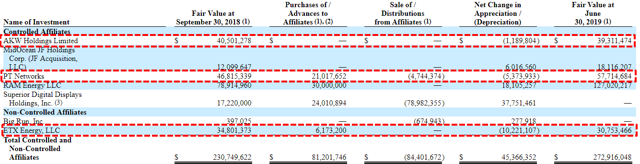
Net asset value (“NAV”) per share declined by $0.09 or 1.0% (from $8.83 to $8.74) due to multiple markups and markdowns during the quarter. Some of the largest markdowns were previously discussed companies including Hollander Sleep Products, ETX Energy and AKW Holdings Limited. Similar to PennantPark Floating Rate Capital (PFLT), its investment in Hollander Sleep Products, was previously added to non-accrual status and marked down by another $7.9 million during the recent quarter impacting NAV per share by almost $0.12.
PT Networks was also marked down and needs to be watched. Some of the largest markups included its investments MidOcean JF Holdings and RAM Energy (similar to the previous quarter). On June 14, 2019, Superior Digital Displays, LLC filed for Chapter 7 bankruptcy protection and is no longer reflected on the Schedule of Investments.
The following table only shows affiliate’ companies and includes changes over the last nine months:
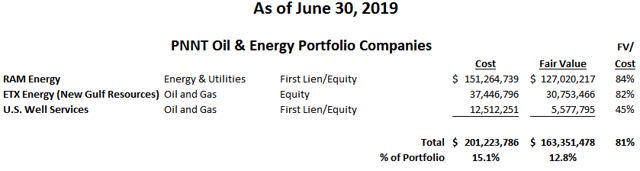
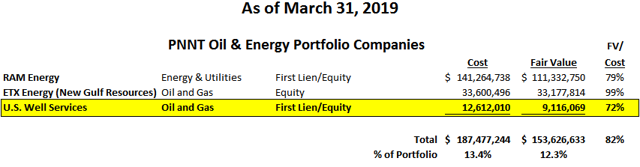
Energy, oil & gas exposure increased to 12.8% of the portfolio fair value (previously 12.3%) due to the previously discussed unrealized appreciation and an additional $10 million debt investment in RAM Energy.
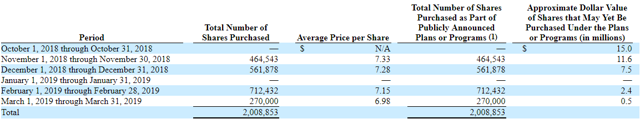
As expected, there were no additional share repurchases due to only around $0.5 million of availability. Previously, PNNT purchased 1 million shares during the three months ended March 31, 2019, at a weighted average price of around $7.10 per share or a 22% discount to its previously reported NAV per share.
Previous call: “We purchased $7 million of a common stock this quarter as part of our stock repurchase program, which was authorized by our board. We’ve completed our program and have purchased $29.5 million of stock. The stock buyback program is accretive to both NAV and income per share. The accretive effect of our share buyback was $0.03 per share.”
As shown below, equity investments are now around 14% of the portfolio and the company will likely continue to use higher leverage as it increases the amount of first-lien positions that now account for 59% of the portfolio (up from 40% five quarters ago).
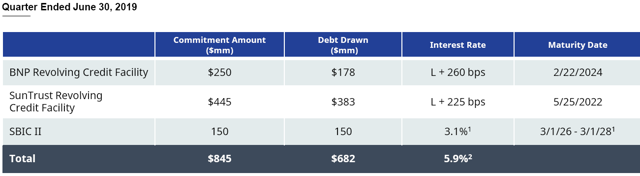
On January 31, 2019, PNNT announced the redemption of $250 million of its 4.50% 2019 Notes due October 1, 2019. The 2019 Notes were prepaid at 100% of the principal amount, plus accrued and unpaid interest through the payment date of March 4, 2019.
This information was previously made available to subscribers of Premium BDC Reports, along with:
- PNNT target prices and buying points
- PNNT risk profile, potential credit issues, and overall rankings
- PNNT dividend coverage projections and worst-case scenarios
- Real-time changes to my personal portfolio
To be a successful BDC investor:
- As companies report results, closely monitor dividend coverage potential and portfolio credit quality.
- Identify BDCs that fit your risk profile.
- Establish appropriate price targets based on relative risk and returns (mostly from regular and potential special dividends).
- Diversify your BDC portfolio with at least five companies. There are around 50 publicly traded BDCs; please be selective.