The following is from the HTGC Update that was previously provided to subscribers of Premium BDC Reports along with revised target prices, dividend coverage and risk profile rankings, potential credit issues, earnings/dividend projections, quality of management, fee agreements, and my personal positions for all business development companies (“BDCs”).

HTGC Update Summary:
- HTGC hit its best-case projections for Q3 2019 covering its dividend by 116% mostly due to higher onetime income and lower-than-expected ‘Employee Compensation’.
- HTGC announced a Q3 2019 supplemental dividend of $0.03 per share and guided for “larger supplemental distribution once we finalize year-end numbers early next year.”
- As predicted, NAV per share decreased by 2.0% or $0.21 (from $10.59 to $10.38) mostly due to unrealized losses from publicly traded equity positions (discussed later) and not related to credit quality
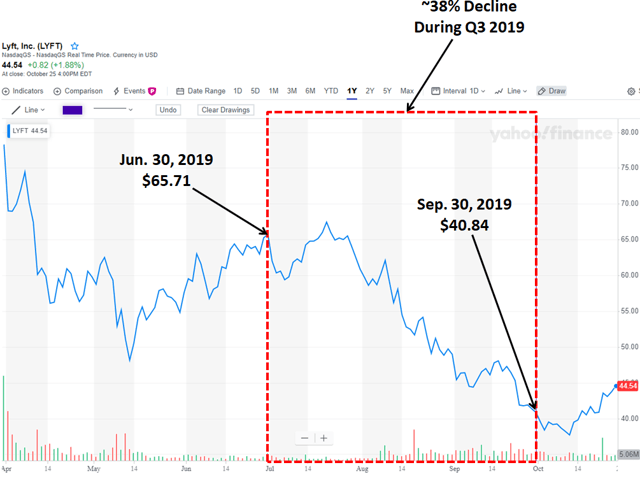
- LYFT declined by 38% during Q3 2019 which resulted in around $5 million of unrealized losses during the quarter. However, LYFT recently raised full-year revenue guidance and posted better-than-expected earnings for its third quarter.
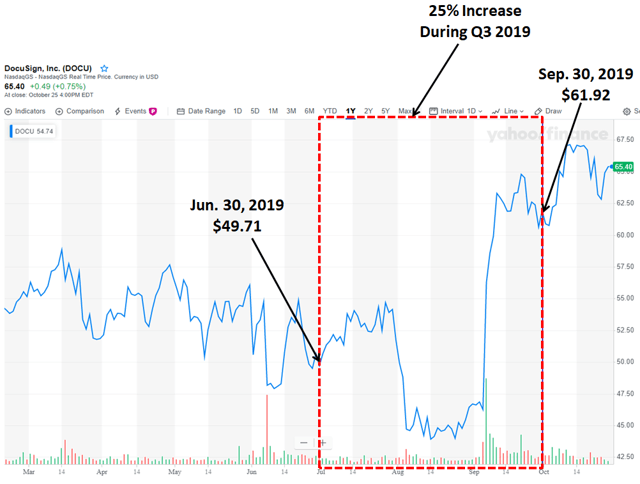
- During Q3 2019, HTGC sold 115,316 shares of DocuSign, Inc. (DOCU).
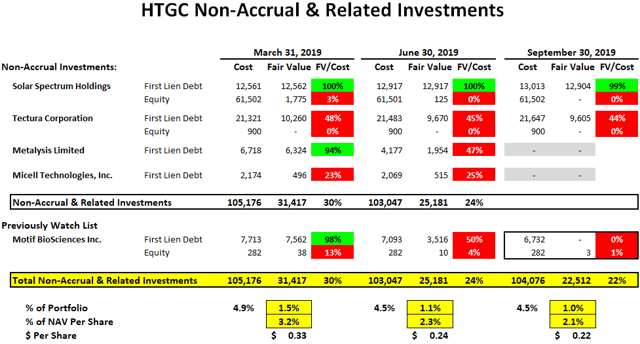
- Non-accruals decreased slightly due to exiting Metalysis Limited and Micell Technologies, Inc. during the quarter.
- However, Motif BioSciences Inc. was previously considered a ‘watch list’ investment and added to non-accrual status during Q3 as well as marked down another $3.2 million.
HTGQ Q3 2019 Update
Hercules Capital (HTGC) hit its best-case projections for Q3 2019 covering its dividend by 116% mostly due to higher fee income and lower-than-expected ‘Employee Compensation’. Distributable net operating income (“DNOI”) was $0.39 per share (previous quarter was $0.40). As discussed in the previous report, HTGC’s ‘Core Yield’ has started to decline from previous levels but is not a concern.
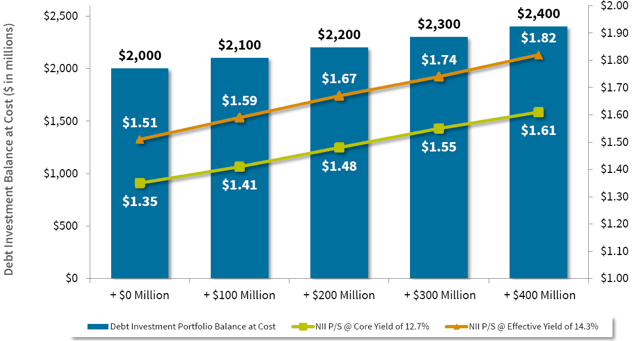
“Our effective and core yields in the third quarter were 13.4% and 12.4% respectively, compared to 14.3% and 12.7% in the second quarter. The primary driver for the decrease in the effective yield was due to the lower early payoffs, the core yield reduced due to the two fed rate cuts in the quarter with the July cut being the main driver.”
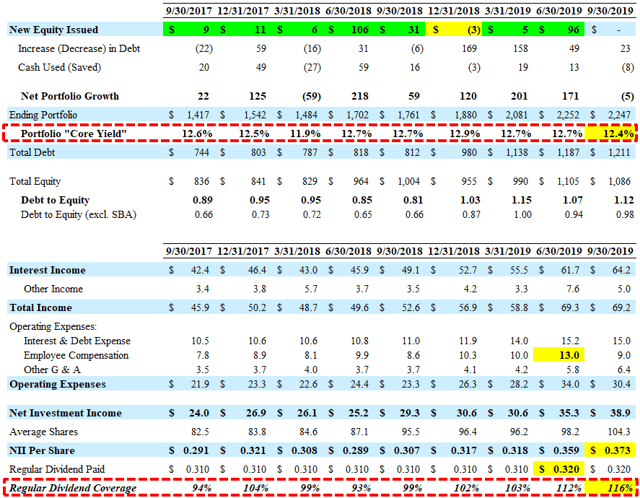
As predicted, NAV per share decreased by 2.0% or $0.21 (from $10.59 to $10.38) mostly due to unrealized losses from publicly traded equity positions (discussed later) and not related to credit quality as discussed on the recent call:
“During the quarter our NAV decreased by $0.21 per share to $10.38 per share, largely related to unrealized depreciation attributable to market volatility impacting the fair value of our investment portfolio. I think the important thing to note that of the $25.5 million of unrealized depreciation, the vast majority of that was in the sort of the public book from the mark-to-market perspective. Only $2.5 million of it was attributable to the unrealized piece from the credit perspective, which is a pretty immaterial amount on a quarterly basis and we really haven’t seen any further degradation subsequent to the 930 marks that would lead us to believe that there’s further erosion with respect to valuations in our portfolio subsequent to quarter end.
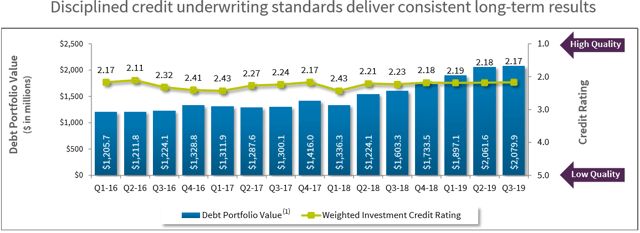
As of September 30, 2019, 84.8% of its debt investments were in a senior secured first-lien position. Non-accruals decreased slightly due to exiting Metalysis Limited and Micell Technologies, Inc. during the quarter. However, Motif BioSciences Inc. was previously considered a ‘watch list’ investment and added to non-accrual status during Q3 2019 as well as marked down another $3.2 million:
—————–
As discussed in the previous HTGC Deep Dive report, there have recently been declines in the public stock prices for some of its equity positions including Lyft, Inc. (LYFT), TransMedics Group, Inc. (TMDX) and BridgeBio Pharma, Inc. (BBIO). As shown in the following chart, the stock price for LYFT declined by 38% during Q3 2019 which resulted in around $5 million of unrealized losses during the quarter. However, LYFT recently raised full-year revenue guidance and posted better-than-expected earnings for its third quarter. HTGC’s management has discussed selling/monetizing its equity holdings:
“When we made those equity investments, we talked about the fact that when they approached a certain target price ranges that we would look to monetize and exit the positions. Most of those private investments came with lockup provisions, which have either just expired or are in the process of expiring over the next several quarters. And if the stocks appreciate to levels that are within our target price ranges, in the ordinary course, will look to monetize and capture some of the gains that we currently have from an unrealized perspective, if you turn them into realized gains again assuming that the stocks remain where they currently are.”
During Q3 2019, HTGC sold 115,316 shares of DocuSign, Inc. (DOCU) which had a 25% increase in stock price during Q3 2019 and was likely sold as discussed on a previous call:
Previous call: “We’re actually a big believer in DocuSign, as a product which led us to make the equity investment in the company. But, we’re not looking to just kind of sell it right away, I think it’s a great company I think it has a lot more legs for growth associated with it. But we are also now the hedge funds. So we’re not – we don’t get paid by holding on to long positions as an internally managed BDC. So once we’ve the threshold, we will liquidate the position.”
“Credit quality on the debt investment portfolio improved slightly in Q3, with a weighted average internal credit rating of 2.17 as compared to 2.18 in Q2. Our rated one-credits as a percentage of our overall investment portfolio went down slightly to 11.4% in Q3 from 12.4% in Q2, largely driven by payoffs of several rated one-credits that we were anticipating. Our rated two-credits as a percentage of our overall investment portfolio increased to 64% in Q3, from 63.9% in Q2 and our rated four and rated five credits decreased to 1.5% in Q3 from 3.6% in Q2, making up less than 2% of our investment portfolio at fair value.”
As discussed in previous reports, there will likely be “potential dividend increases or supplemental dividend distributions” and on October 29, 2019, the Board declared a second quarter supplemental cash distribution of $0.03 per share.
“With our total investment portfolio at $2.3 billion at cost and our debt investment portfolio at $2.1 billion at cost, our NII per share in Q3 generated 116% coverage above our quarterly based distribution of $0.32 per share. In addition to our quarterly based distribution of $0.32 for Q3, we also declared a supplemental distribution of $0.03 per share. In the aggregate, this brings our total distributions to shareholders for Q1, Q2 and Q3 to $1.02, representing a 7% increase from the same period a year ago.”
“We are also fortunate to have been able to grow our undistributed spill-over to an estimated $62 million or $0.59 per share, subject to final tax filings in 2019. Subject to market conditions and sustained financial performance, we hope to be in position to potentially declare a larger supplemental distribution once we finalize year-end numbers early next year.”
After closing $241 million in new debt and equity commitments in Q3 2019, HTGC has pending commitments of $36 million in signed non-binding term sheets outstanding as of October 29, 2019. Since the close of Q3 2019 and as of July 29, 2019, HTGC has funded almost $118 million of existing commitments.
“Since the close of Q3 and as of October 29, Hercules has already closed an additional $191 million of new commitments and we have pending commitment of an additional $36 million in singed, non-binding term sheet. Year-to-date through October 29, our closed new debt and equity commitments are at $1.4 billion.”
HTGC Liquidity and Capital Resources:
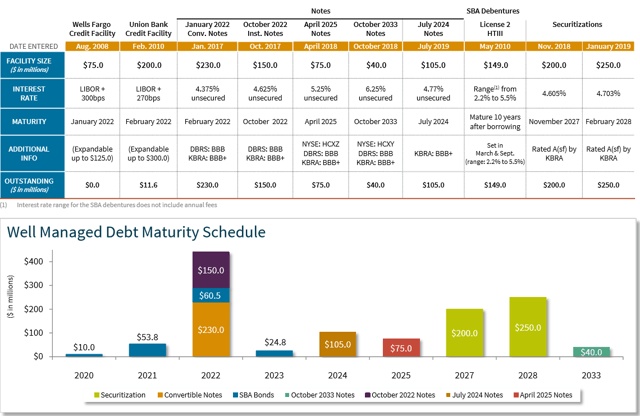
HTGC ended Q3 2019 with $284 million in available liquidity, including $21 million in unrestricted cash and cash equivalents, and $263 million in available credit facilities. On July 16, 2019, HTGC issued $105 million of senior unsecured notes to qualified institutional investors in a private placement with a fixed interest rate of 4.77% and are due on July 16, 2024, and will reduce borrowing costs as in the previous report.
“At the end of the quarter, our GAAP and regulatory leverage was 111.5% and 97.8% respectively, which increased compared to the second quarter due to the private placement in July and continued growth. We continue to manage the business to ensure that we remain below our 2019 communicated leverage sealing of 125%.”
On June 17, 2019, the Company completed a public offering of common stock, including the over-allotment option, totaling 5,750,000 of common stock for net proceeds, before expenses, of $70.5 million, including the underwriting discount and commissions of $2.2 million. During Q3 2019, the company did not issue any additional shares under its equity ATM program. As of October 28, 2019, around 10.7 million shares remain available for issuance and sale. Shareholders previously approved the reduced asset coverage ratio allowing higher leverage effective December 7, 2018. The company intends to have target leverage (debt-to-equity) ratio range of 0.95 to 1.25 and will likely use the ATM program to maintain leverage while growing the portfolio.
HTGC Equity & Warrant Portfolio
Hercules held equity positions in 53 portfolio companies with a fair value of $148.4 million and a cost basis of $201.0 million as of September 30, 2019. On a fair value basis, 29.0% or $43.4 million is related to existing public equity positions.
Hercules held warrant positions in 118 portfolio companies with a fair value of $18.9 million and a cost basis of $34.1 million as of September 30, 2019. On a fair value basis, 26.0% or $5.0 million is related to existing public warrant positions.
This information was previously made available to subscribers of Premium BDC Reports, along with:
- HTGC target prices and buying points
- HTGC risk profile, potential credit issues, and overall rankings
- HTGC dividend coverage projections and worst-case scenarios
- Real-time changes to my personal portfolio
To be a successful BDC investor:
- As companies report results, closely monitor dividend coverage potential and portfolio credit quality.
- Identify BDCs that fit your risk profile.
- Establish appropriate price targets based on relative risk and returns (mostly from regular and potential special dividends).
- Diversify your BDC portfolio with at least five companies. There are around 50 publicly traded BDCs; please be selective.