The following is from the TSLX Deep Dive that was previously provided to subscribers of Premium BDC Reports along with revised target prices, dividend coverage and risk profile rankings, potential credit issues, earnings/dividend projections, quality of management, fee agreements, and my personal positions for all business development companies (“BDCs”).
TSLX Dividend Coverage Update:
TSLX has covered its regular dividend by an average of 139% over the last four quarters, growing undistributed taxable income and capital gains to $1.60 per share.
“At September 30 our estimated spillover income was approximately $1.60 per share. We will continue to evaluate the best way to comply with this requirement in conjunction with our distribution policy.”
Previous call: “If we believe there is sustainable increase in the earnings power of the business by operating in our target leverage range for an extended period of time, then we would look to resize our base dividend in context of the underlying earnings power of the business to ensure we’re optimizing cash distribution and satisfying risk related distribution requirements. We will continue to monitor undistributed taxable income and gains closely as part of our ongoing review of our distribution strategy.”
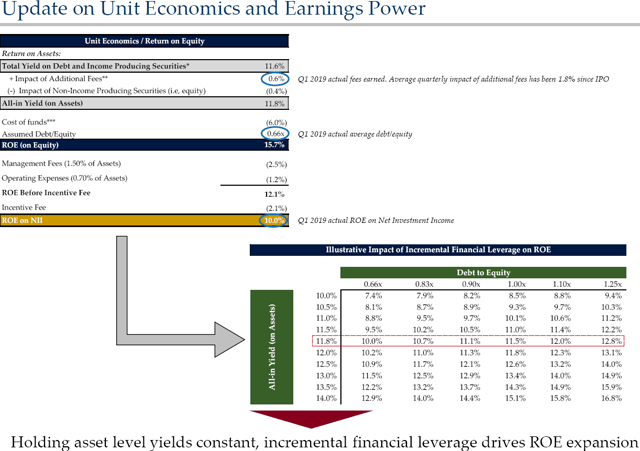
TSLX announced a special/supplemental dividend of $0.08 per share payable in December and annualized ROE for the third quarter 2019 was 13.3% and 11.0% on a net investment income and a net income basis, respectively.
“At the beginning of the year we communicated an annualized ROE target of 11% to 11.5% based on our expectations for net asset-level yields cost of funds and financial leverage. Year to date we’ve generated an annualized ROE on net investment income and net income of 11.8% and 14.6% respectively.

There will likely be around $0.13 per share of realized gains related to the exit of its preferred equity investment in Validity, Inc. that will be used to support upcoming supplemental dividends. This investment was discussed on the previous call:
Previous call: “We continue to hold our convertible preferred equity investment and updated the fair value mark to reflect the valuation from the recent equity investment. We expect to realize our investment at current fair value mark in the near term. If realized, any gains on our equity position at the time of exit would be unwound from the balance sheet and recognized into net income, but won’t flow through to NII.”

As discussed in previous reports (and previous public article), Ferrellgas Partners (FGP) remains its largest investment and is currently valued at almost $6 million over cost or $0.08 per share and will likely drive additional fee income and realized gains. On January 9, 2020, FGP announced updates to its intention to voluntarily delist from the NYSE and expects that its common shares will trade on the OTC as (“FGPR”). However, its Senior Secured Credit Facility with TSLX is secured with substantially all of the assets of the operating partnership and its subsidiaries, and Ferrellgas Partners’ and the general partner’s partnership interests in the operating partnership, and contains various affirmative and negative covenants and default provisions, as well as requirements with respect to the maintenance of specified financial ratios and limitations on the making of loans and investments.
Previous call: “Ferrellgas is a publicly traded distributor of propane with an enterprise value of $2.3 billion. The company has a defensive core business with high return on invested capital and a strong management team but faced refinancing difficulties given the challenging regulatory environment for banks. Due to our ability to provide a fully underwritten financing solution through co-investments from affiliated funds we were able to structure a first lien last out position at a low attach point of 0.2X at a low net leverage of 1.7X with highly attractive adjusted returns.”
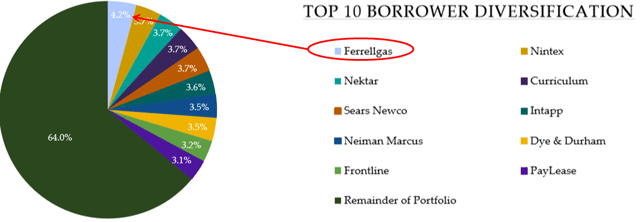
FGP was put on notice of default and previously announced an amendment that includes a waiver of that default, likely driving additional fee income for TSLX in Q4 2019. There is litigation (not including TSLX) from the company’s ESOP trustee and this investment was discussed on the recent call:
“I would like to comment on a recent development for one of our portfolio companies Ferrellgas. This October the company disclosed in its 10-K filing that it is currently in a disagreement with us as the agent on a senior secured credit facility regarding various technical defaults including the going-concern qualification in the company’s most recent audited financial statements report. We continue to work closely with the management on finding a solution.”
“We’ve tried and will continue to try to work with the company and the management team and their advisors on the solution. We would refer people to the litigation in Kansas for more details including the countersuit filed by the company’s employee — a company’s employee’s trustee Great Bank on October 24th for details of the Ferrellgas story. We believe what’s really unfortunate here is that there’s been approximately $2.3 billion of equity value eroded since the company’s peak market cap in September of 2014 representing approximately $600 million of employee plan assets related to the ESOP. This is detailed in that Great Bank countersuit. Obviously it’s a live situation which is fluid. As it related to the mark the mark is actually below the implied call protection that would be contractually owed to us upon a refi if the company chooses to refi us. The company’s capital structure is pretty public. We feel pretty well positioned in the capital structure approximately 2.5x levered. The company has $230 million of EBITDA and the market value of the company’s securities which is mostly unsecured debt outside of us is approximately $2 billion. There’s not much equity value by market cap. I think it’s $50 million to $60 million so we’re very well positioned in the capital structure. Obviously the arc of the Ferrellgas story again is unfortunate specifically as it relates to previous owners and the erosion of the equity value in plan assets although we feel pretty good about where we sit in the capital structure.”
It is important to understand that TSLX management continues to produce higher returns by investing in distressed companies through excellent underwriting standards that protect shareholders during worst-case scenarios including call protection, prepayment fees and amendment fees backed by first-lien collateral of the assets. Historically, higher returns have been partially driven by these strong financial covenants and call protections during periods of higher amounts of prepayments (discussed below) and worst-case scenarios (discussed at the end of this report). However, similar to previous reports, the base case projections do not include large amounts of fee and other income related to early repayments.
“Given our direct origination strategy, 99% of our portfolio by fair value was sourced through non-intermediated channels. At quarter end, we maintained effective voting control on 78% of our debt investments and averaged 1.9 financial covenants per debt investment consistent with historical trends. And we continue to have meaningful call protection on our debt portfolio as a way to generate additional economic should our portfolio get repaid in the near term.”

It also important to point out that the company is able to cover dividends with recurring sources as discussed by management on previous calls:
Previous call: “As we’ve said in the past, in environments where we receive elevated levels of prepayments and a decrease in our financial leverage ratio, we would expect elevated levels of other fees. However, if repayment activity were to decline, then we would expect to leg back into our target leverage ratio, contributing more rapidly to our interest and dividend income line.”
Management gave 2019 NII guidance of $1.77 to $1.85 which is likely conservative, similar to 2017/2018 guidance.
“Given the earnings power of our portfolio and our outlook for portfolio activity for Q4 we would expect to end full-year 2019 at the upper end of our previously shared NII per-share guidance of $1.77 to $1.85.”
For Q3 2019, TSLX beat best-case projections “driven by higher prepayment fees and accelerated amortization of upfront fees from unscheduled pay downs and higher commitment and agency fees”.
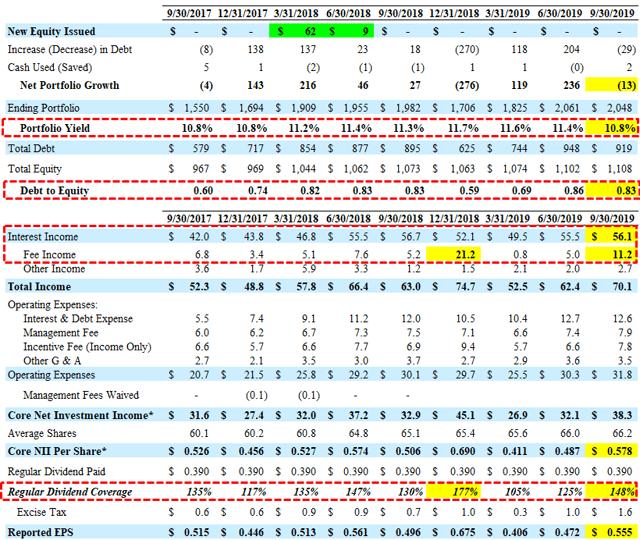
Repayments and exits during Q4 2018 drove its debt-to-equity to a four year low of 0.59 that has slowly increased to 0.83 in Q3 2019 as the company takes a “prudent approach to growth especially in today’s market”:
“Since we increased our target leverage range to 0.9x to 1.25x a little over 12 months ago upon the effectiveness of the lower minimum asset coverage requirement our average quarterly leverage has to date not reached the low end of our targeted range. This is a function of repayment activity in our portfolio as well as our prudent approach to growth especially in today’s market.”

The company still has $942 million of undrawn capacity on its revolving credit facility for additional portfolio growth.


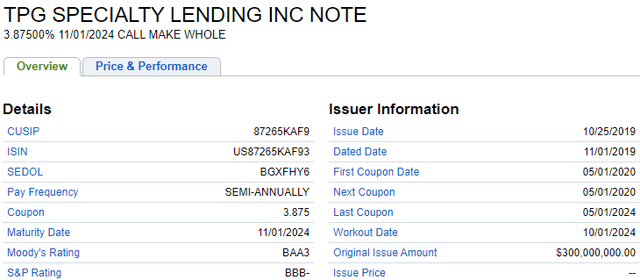
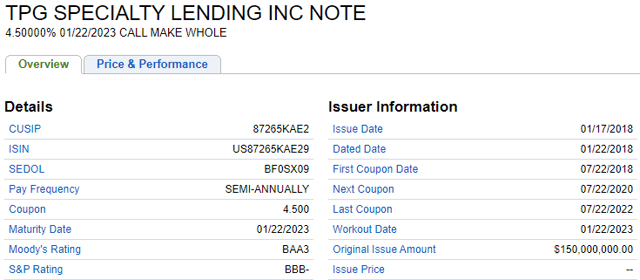
It should be noted that 100% of TSLX’s borrowings are at variable rates (based on LIBOR) but the company is adequately positioned for rising interest rates due to ‘match funding’ with 100% of debt investments at variable rates. TSLX continues to lower its cost of capital and on November 1, 2019, issued $300 million of unsecured 3.875% notes that mature on November 1, 2024, and are tradeable under CUSIP #87265KAF9.
“We issued $300 million of 3.875% 5-year unsecured notes. While the net proceeds were immediately used to repay outstanding amounts under our revolver the additional capital will also be used to effectively replace the $115 million of 4.5% convertible notes that mature in December as well as to provide incremental liquidity under our revolver.”

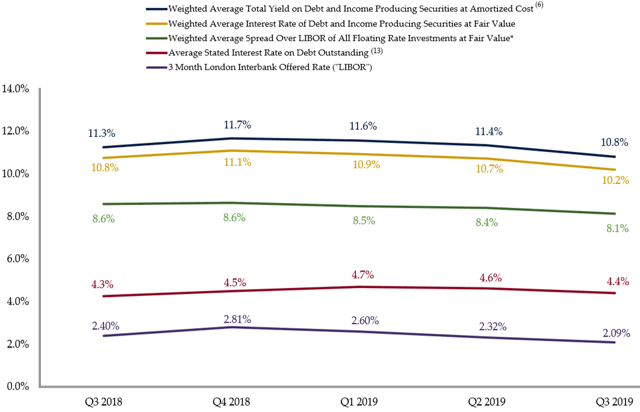
There was a meaningful decline in its portfolio yield (from 11.4% to 10.8 %) due to repayments from higher-yielding investments and new investments at lower yields as well as lower LIBOR:
“This quarter the weighted average total yield on our debt and income producing securities at amortized cost was 10.8% a decrease of 54 basis points from the prior quarter. Breaking this down 24 basis points was due to the decrease in LIBOR on our floating rate portfolio and 30 basis points was due to the impact of new versus exiting investments. This was an atypical quarter where a number of stronger yielding investments with a weighted average total yield of 12.7% were repaid. The weighted average total yield on new investments was lower at 10.4% and this was impacted by both the yield and the size of our Neiman ABL investment.”
—————–
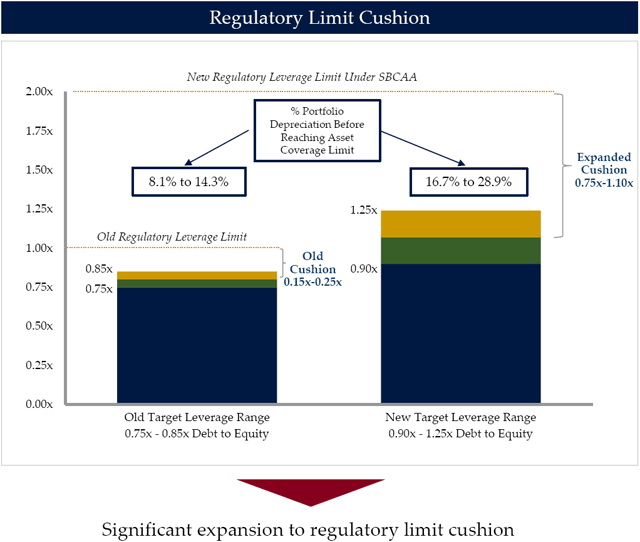
In October 2018, TSLX’s shareholders overwhelmingly approved the proposal to allow the company to increase leverage by approving the application to the company of a minimum asset coverage ratio of 150% effective October 9, 2018. TSL Advisers, LLC intends to waive a portion of the management fee in excess of an annual rate of 1.0% on assets financed with higher leverage and revised its target debt-to-equity range from 0.75-0.85 to 0.90-1.25.
“As we said in the past, in periods where we see a decrease in our financial leverage, we would expect elevated levels of other fees from repayment activity to support our ROEs. We believe our revised financial policy will allow us to drive incremental ROEs for our shareholders as we reached the higher end of our leverage target.”
—————–
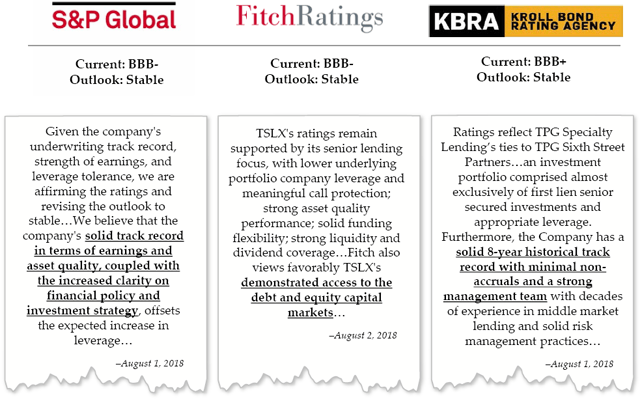
The following are the investment-grade ratings from Fitch, S&P, and Kroll under the new target leverage range of 0.90x-1.25x debt-to-equity.
—————–
TSLX Risk Profile Update:
TSLX has a history of selectively growing its portfolio using prudent amounts of leverage, onboarding higher-than-average credit quality first-lien investments at higher-than-market yields and providing better-than-average dividend coverage and returns to shareholders. As discussed earlier, TSLX has excellent underwriting standards that protect shareholders during worst-case scenarios including voting control, call protection prepayment fees and amendment fees backed by first-lien collateral of the assets.
“Given our direct origination strategy, 99% of our portfolio by fair value was sourced through non-intermediated channels. At quarter end, we maintained effective voting control on 78% of our debt investments and averaged 1.9 financial covenants per debt investment consistent with historical trends. And we continue to have meaningful call protection on our debt portfolio as a way to generate additional economic should our portfolio get repaid in the near term.”

“We continue to be late cycle minded with our exposure to non-energy cyclical industries at an all-time low of 3% of the portfolio at fair value. As a reminder, this figure excludes our retail asset based loan investments, which are supported by liquid collateral values and are not underwritten based on enterprise value, which tends to fluctuate.”
As of September 30, 2019, 100% of the portfolio was meeting all payment and covenant requirements. First-lien debt remains around 97% of the portfolio and management has previously given guidance that the portfolio mix will change over the coming quarters with “junior capital” exposure growing to 5% to 7%.


—————–
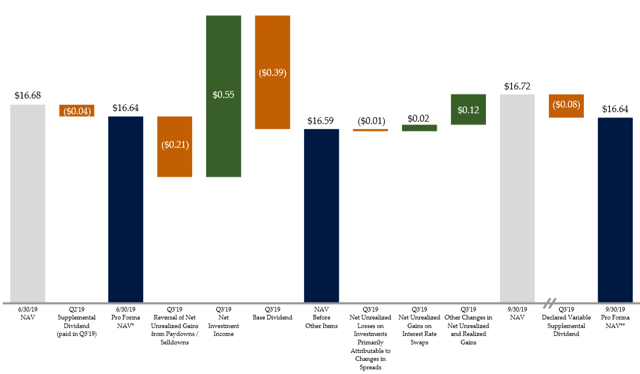
During Q3 2019, TSLX’s net asset value (“NAV”) per share increased by $0.04 or 0.2% (from $16.68 to $16.72) due to overearning the dividend(NYSE:S) paid in Q3 2019 partially offset by markdowns of ‘watch list’ investments discussed next. However, this does not take into account the $0.08 supplemental dividend in Q4 2019:
—————–
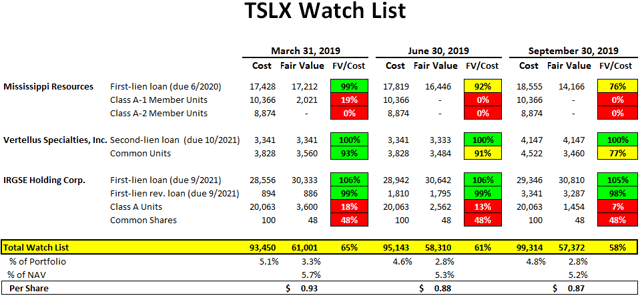
There were additional markdowns in the three ‘watch list’ investments Mississippi Resources, Vertellus Specialties, and IRGSE Holding Corp. The largest markdown during the quarter was its first-lien position in Mississippi Resources to 78% of cost and will likely be added to non-accrual in Q4 2019. However, TSLX’s watch list of 2.8% of the portfolio fair value is among the lowest in the sector making it a key component of the suggested ‘Risk Averse’ portfolio.
—————–
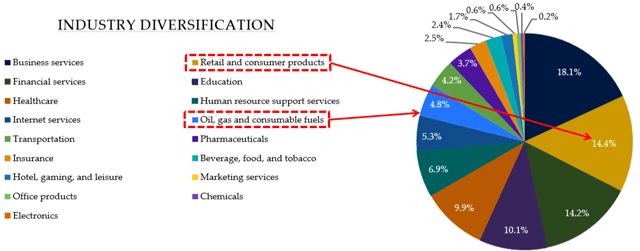
It is important for investors to understand that one of TSLX’s strategies for higher IRRs is investing in distressed retail asset-based lending (“ABL”) as “traditional brick and mortar retail gives way to the rise of e-commerce”. Historically, borrowers have paid amendment fees to avoid even higher prepayment fees if they decided to refinance. Also, the amendments included an additional “borrowing base” providing increased downside protection on the investment. This strategy continues to drive higher fee income including prepayment and amendments fees. See the end of this report for previous examples.
“We’d like to note that our retail exposure is predominantly in the form of asset-based loans secured by liquid working capital collateral and the vast majority of our financial services portfolio companies are B2B integrated software repayment businesses with limited financial leverage and underlying bank regulatory risk. The credit quality of our portfolio remains robust with an average performance rating on a scale of 1 to 5 with 1 being the highest of 1.13 versus 1.18 in the prior quarter.”
The largest new investment during Q3 2019 was Neiman Marcus Group and discussed on the recent call:
“We continue to be fairly active in the retail ABL this year against the backdrop of a particularly challenging year for brick-and-mortar retailers. During the quarter we funded a $72 million par-value asset-based loan to Nieman Marcus to support the company’s strategic initiatives. And post quarter-end as publicly disclosed we and our affiliated funds provided a $75 million asset-based DIP loan to Forever 21 to support the company’s bankruptcy restructuring efforts. We believe both of these investments offer strong risk-adjusted returns given the downside protection of our borrowing-base [levered] loans including in both cases robust asset coverage from liquid working capital collateral.”
“So on Nieman look we have a great relationship with our friends at areas have done numerous asset-based deals including Ninety-Nine Cents and so we have a great relationship. And in addition to that we were involved on one of out other funds our private funds in helping Nieman through the latest restructuring given we were a large holder of the term loan. So given that we know the company been involved with the company you know were constructive with the company in their latest efforts to restructure the balance sheet and we have a ton of experience with the sponsor and you know I think that gave us the opportunity. And so that’s the context of the transaction. Again what I would say is look the portfolio yields bounce around quarter to quarter. I think if you look at Forever 21 quite frankly which is another retail asset-based loan it has a much higher yield to amortized cost. If you know — much much higher. If you look at portfolio — if you pro forma Q3 for Forever 21 I think yield to amortized cost of our portfolio is about 11% to 11.1%. And so the Neiman’s choice was although it was lower yield it probably ultimately will have a little bit of a higher return because it will go to life. There was a whole bunch of suppressed availability which had made it a very good loan. We knew the company and we have a great relationship with the sponsor and have a history of supporting Neiman’s. As it relates to your second question which is why do we own a I think it’s like $700000 Neiman first lien it is under the 40 Act given that we own a different part of that capital structure”
From previous call: “What really matters is, how we think the inventory will liquidate as it compares to what – where we are lending against it. Retail goes as well as the consumer. That is not the – that’s not what’s happening here, right. Consumer is in good health. There is a business model issue and a structural issue with retail, but more so given the fixed cost base and given the discerning mediation of both kind of fast brands and plus Amazon and omni-channel business models. And so, it’s really the liquidation value of inventory and the liquidation value of the inventory has held up great. So, we continue to hope for a decent amount of structural change. So we can provide capital and provide – be a solution provider into that space. And quite frankly, the liquidation values continue to hold up very, very, very well.”
Similar to investing in distressed retail assets, the company is focused on increasing returns through investing opportunistically in oil/energy but only first-lien “with attractive downside protective features in the form of significant hedged collateral value at current price levels”. Management has mentioned that energy exposure would not exceed 10% of the portfolio and only first-lien using appropriate hedges. TSLX made “opportunistic” investments in Energy Alloys in Q3 2019, Verdad Resources in Q2 2019, MD America Energy during Q4 2018, Ferrellgas Partners during Q2 2018 and Northern Oil & Gas in Q4 2017 that was repaid.
Previous quarter: “Another transaction this quarter that highlights our platform’s capabilities is the $225 million term loan facility that we sold at an agent for the Verdad Resources, an upstream E&P company with primary operations in the DJ Basin. This opportunity was sourced with our energy team and coincided with our opportunistic approach of providing first lien reserve based loans to upstream companies situated low on their cost curves at current price levels. Our platform sector expertise and ability to act in size allows us to structure a customized one-stop solution for the company and its sponsor at pricing in terms that provide a strong risk return profile on our investment.
This information was previously made available to subscribers of Premium BDC Reports, along with:
- TSLX target prices and buying points
- TSLX risk profile, potential credit issues, and overall rankings
- TSLX dividend coverage projections and worst-case scenarios
- Real-time changes to my personal portfolio
To be a successful BDC investor:
- As companies report results, closely monitor dividend coverage potential and portfolio credit quality.
- Identify BDCs that fit your risk profile.
- Establish appropriate price targets based on relative risk and returns (mostly from regular and potential special dividends).
- Diversify your BDC portfolio with at least five companies. There are around 50 publicly traded BDCs; please be selective.
