The following is from the OCSL Update that was previously provided to subscribers of Premium BDC Reports along with revised target prices, dividend coverage and risk profile rankings, potential credit issues, earnings/dividend projections, quality of management, fee agreements, and my personal positions for all business development companies (“BDCs”).

OCSL Update Summary:
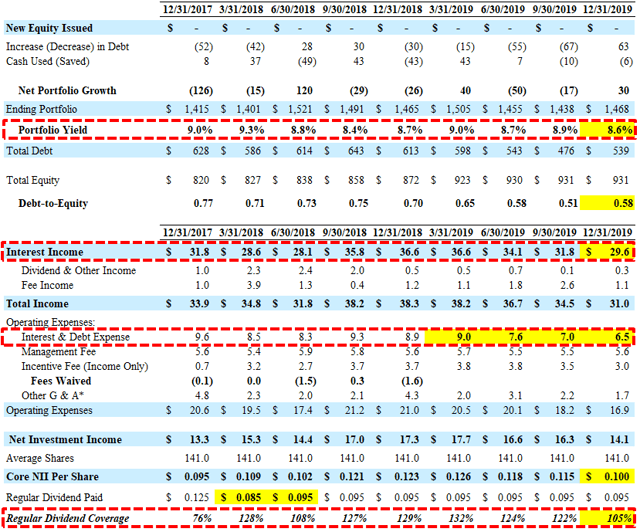
- OCSL reported below its base case projections due to a meaningful decline in portfolio yield and interest income as well as lower fee income.
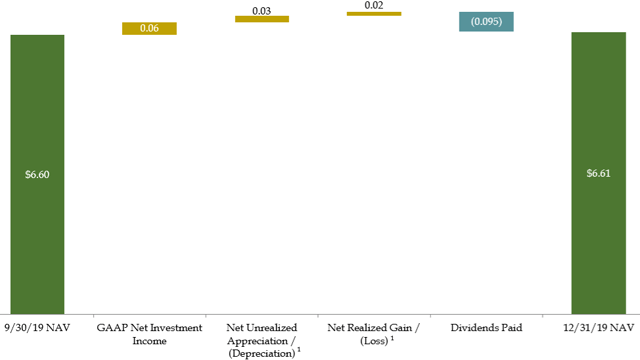
- NAV per share remained stable due to realized/unrealized gains combined with operating earnings covering the dividend for the quarter.
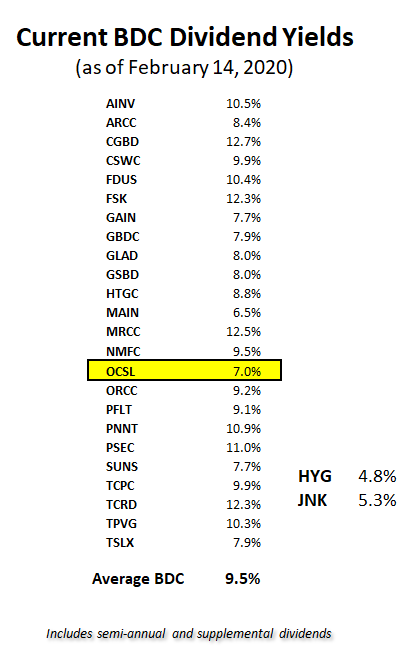
- OCSL has covered its dividend by an average of 121% with average earnings of around $0.115 per share over the last four quarters partially due to reduced borrowing rates.
- However, dividend coverage has been trending lower and I will reassess pricing after the earnings call and updating the projections.
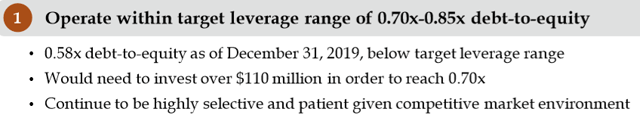
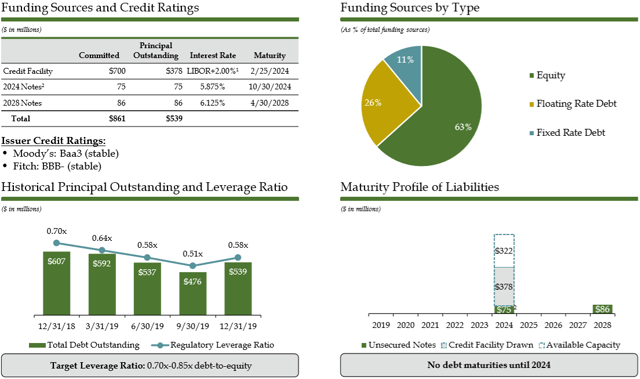
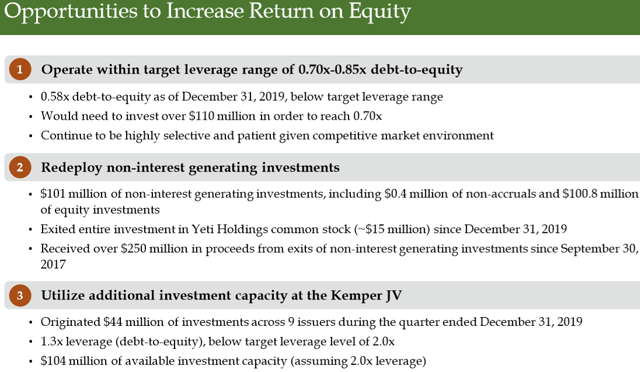
- The company has growth capital available given its historically low leverage with a current debt-to-equity ratio of 0.58. Moody’s and Fitch have recently assigned OCSL investment-grade credit ratings (Moody’s, Baa3 / Stable, and Fitch, BBB- / Stable).
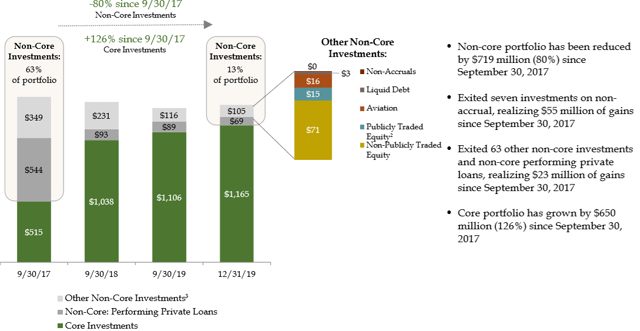
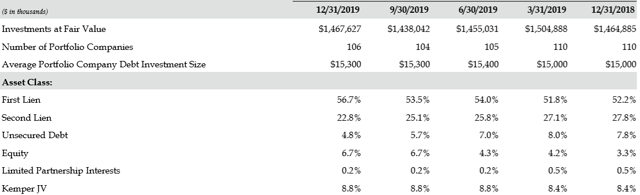
- Management has made meaningful progress shifting the portfolio from ‘non-core’ legacy assets that account for 13% of the portfolio (previously 16%).
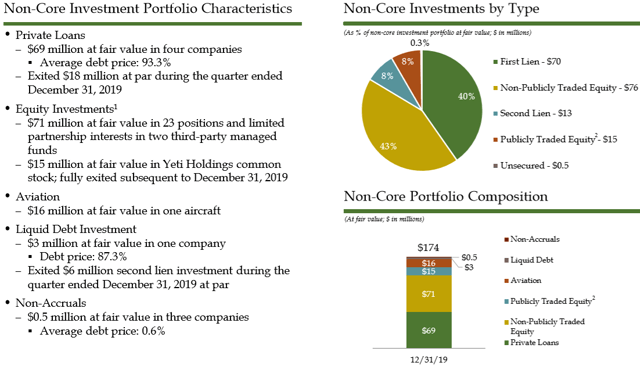
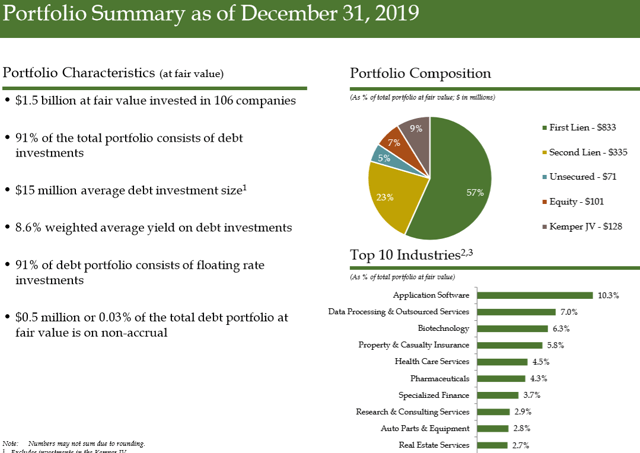
- First-lien investments account for 57% of the portfolio and non-accruals are very low at 0.03% due to mostly being written off.
OCSL Dividend Coverage Update:
For the quarter ended December 31, 2019, Oaktree Specialty Lending (OCSL) reported below its base case projections due to a meaningful decline in portfolio yield and interest income as well as lower fee income. OCSL has covered its dividend by an average of 121% with average earnings of around $0.115 per share over the last four quarters partially due to reduced borrowing rates. The company has growth capital available given its historically low leverage with a current debt-to-equity ratio of 0.58. Moody’s and Fitch have recently assigned OCSL investment-grade credit ratings (Moody’s, Baa3 / Stable, and Fitch, BBB- / Stable).
Armen Panossian CEO/CIO: “OCSL delivered another quarter of strong performance, highlighted by our eighth consecutive quarter of NAV growth. While leverage grew as a result of these originations, we remain below our target range and have ample dry powder and liquidity to invest opportunistically. In addition, we were recently assigned investment-grade credit ratings by Fitch and Moody’s, reflecting the strength and quality of Oaktree’s credit platform, the progress that we have made in reducing exposure to non-core investments and our significant borrowing capacity.”
Net realized and unrealized gains were $6 million for the quarter “primarily reflecting realized gains from the sale of a portion of its investment in Yeti Holdings, Inc. and unrealized appreciation on certain debt and equity investments.” OCSL is currently considered a ‘Level 1’ dividend coverage due to its rebounding NAV per share, realized gains and the potential for improved coverage through portfolio growth and rotating out of non-core investments redeployed “into proprietary investments with higher yields”:
“Over time, the Company intends to rotate out of the remaining investments it has identified as non-core investments, which were approximately $174.0 million at fair value as of December 31, 2019. It will also seek to redeploy non-income generating investments comprised of equity investments, limited partnership interests and loans currently on non-accrual status into proprietary investments with higher yields.”
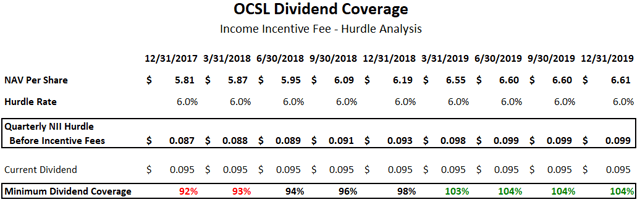
As shown in the following table, the company will likely earn at least $0.099 per share each quarter covering 104% of the current dividend which is basically ‘math’ driven by an annual hurdle rate of 6% on equity before paying management incentive fees.
“The payment of the incentive fee on income is subject to payment of a preferred return to investors each quarter (i.e., a “hurdle rate”), expressed as a rate of return on the value of the Company’s net assets at the end of the most recently completed quarter, of 1.50% [6% annualized], subject to a “catch up” feature.”
This calculation is based on “net assets” per share which have continued to grow driving a higher amount of “pre-incentive fee net investment income” per share before management earns its income incentive fees. As shown in the analysis below, the “Minimum Dividend Coverage” continues to grow along with NAV:
—————–
Management was previously asked about a potential dividend increase due to continuing to overearn the dividend and mentioned:
“In terms of the dividends, we were, as we discussed, we’re focused on the stable kind of cash earnings and the dividend has generated from the — they come from the portfolio to payout the dividend. So we’re thoughtful about that as we think about our dividend and capital strategy.”
As of December 31, 2019, OCSL had almost $22 million of cash and $322 million of undrawn capacity on its credit facility. On June 28, 2019, shareholders approved the reduced asset coverage requirements allowing the company to double the maximum amount of leverage effective as of June 29, 2019. The investment adviser reduced the base management fee to 1.0% on all assets financed using leverage above 1.0x debt-equity. Management mentioned “we have no near-term plans to increase our leverage above our target range of 0.70 to 0.85 times”:
From previous call: “As you will recall last quarter, we received Board approval to increase our leverage, effective in February 2020, unless we were to receive shareholder approval before then. While we have no near-term plans to increase our leverage above our target range of 0.70 to 0.85 times, this is an opportunity cost efficiently seeks shareholder approval in the events, but in the future, we deem the appropriate to deploy higher leverage. In connection with this, our base management fee will be reduced to 1% on all assets, finance using leverage above 1.0 times debt to equity once the new leverage limits are in effect.”
Management previously amended its revolving credit facility terms including extending the reinvestment period and modifying the asset coverage ratio covenant.

OCSL Risk Profile Update:
As shown below, management has made meaningful progress shifting the portfolio from ‘non-core’ legacy assets that now account for around 13% (previously 16%) of the portfolio fair value.
Armen Panossian CEO/CIO: “We successfully exited three non-core positions and added $134 million of new investments, the majority of which were privately placed to businesses that align with our late-cycle approach to investing.
—————–
Three investments remain on on-accrual status but have already been written down and are now only 0.03% of the portfolio fair value:
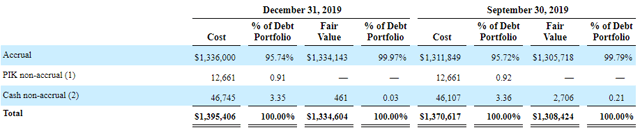
—————–
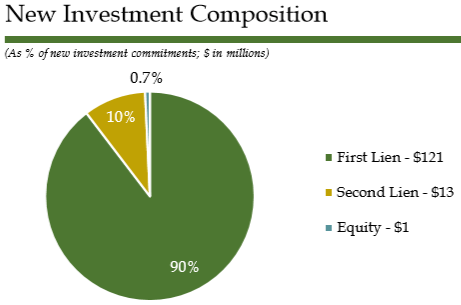
As of December 31, 2019, 57% of the portfolio was first-lien as 90% of the new investments during the recent quarter were first-lien.
—————–
NAV per share remained stable due to the previously discussed realized/unrealized gains combined with operating earnings covering the dividend for the quarter:
This information was previously made available to subscribers of Premium BDC Reports, along with:
- OCSL target prices and buying points
- OCSL risk profile, potential credit issues, and overall rankings
- OCSL dividend coverage projections and worst-case scenarios
- Real-time changes to my personal portfolio
To be a successful BDC investor:
- As companies report results, closely monitor dividend coverage potential and portfolio credit quality.
- Identify BDCs that fit your risk profile.
- Establish appropriate price targets based on relative risk and returns (mostly from regular and potential special dividends).
- Diversify your BDC portfolio with at least five companies. There are around 50 publicly traded BDCs; please be selective.