
- The BDC sector continues to deliver strong returns during the pandemic, including recently improved earnings, dividend coverage, and increased book values.
- This article discusses two stocks that I own one of which I consider a ‘Buy and Hold’ that has provided excellent returns so far in 2020.
- The other position is more of a trading position with upside potential (discussed below) and currently trading at a 42% discount to its book value.
- Also included are my predictions for the general markets and BDC pricing over the next 2 to 3 months.
- BDC investors typically get at least 2 to 3 buying points each year.
Introduction
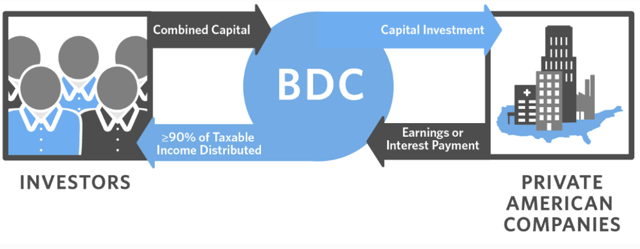
This article is part of a series discussing how to build a retirement portfolio using general market volatility and business development companies (“BDCs”). Similar to REITs, BDCs are regulated investment companies (RICs), required to distribute more than 90% of their profits and gains to shareholders avoiding corporate income taxes before distributing to shareholders.
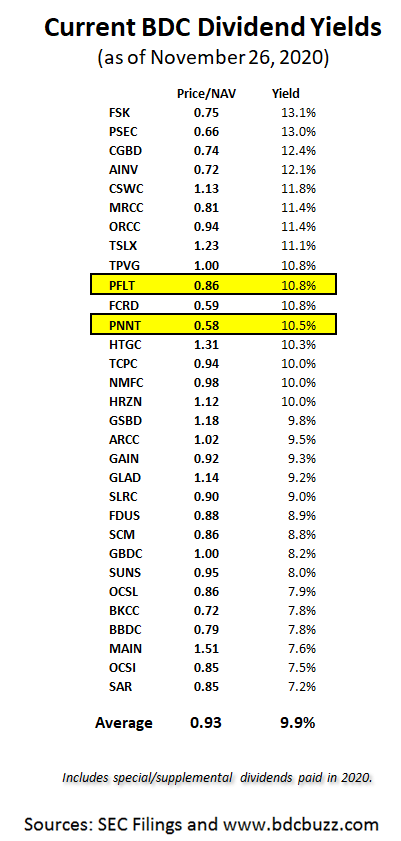
This structure prioritizes income to shareholders (over capital appreciation) driving higher yields that currently range from around 7% to 13%. The following yields take into account special/supplemental dividends for 2020.
This article discusses PennantPark Investment (PNNT) and PennantPark Floating Rate Capital (PFLT) both of which were founded by Art Penn who also co-founded Apollo Investment (AINV) in 2004.
Quick BDC Market Update
- Please see the end of this article for my expectations of BDC pricing over the next 2 to 3 months.
As predicted last week in “11% Dividend Yielding BDC Sector Continues To Soar“, BDCs continue to rebound and outperform the general markets for many reasons discussed in the article as well as a rotation into cyclicals and higher yield. Most BDCs (including PNNT and PFLT) have been reporting stronger-than-expected quarterly results with increased NAV/book values and improved net interest margins due to higher portfolio yields and/or reduced borrowing expenses. Also, non-accruals remain very low (so far) and BDCs still have conservative valuations (below par) on many of their investments that I am expecting to slowly reflate as they have been due to tighter spreads and an improved economic outlook. The following was from Ryan Lynch at KBW earlier this month:
business development companies are performing much better here than they did compared to the global financial crisis – and better than investors would have expected earlier this year. The trajectory of loss rates and changes in book value have been improving over the past two quarters, rather than deteriorating.
Why hasn’t this downturn been as severe as the GFC? Lynch says that’s in part due to the combination of massive government stimulus and liquidity from the government and Federal Reserve, as well as some conservative positioning among the BDCs headed into this downturn.
When it comes to portfolio loss/gain rate, the top performers among the BDCs are Sixth Street Specialty Lending (NYSE:TSLX), TriplePoint Venture Growth (NYSE:TPVG), and Hercules Capital (NYSE:HTGC). Conversely, the worst performers on loss rate so far are First Eagle Alternative Capital (NASDAQ:FCRD), Investcorp Credit Management (NASDAQ:ICMB), and FS KKR Capital (NYSE:FSK).
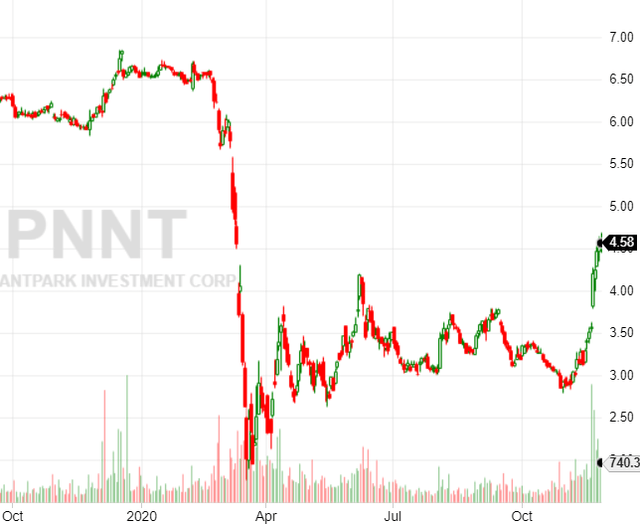
The following chart compares the last 12 months’ performance for PNNT and PFLT to UBS ETRACS WF BDC Index ETN (BDCS). Both PNNT and PFLT have recently bounced higher for the reasons discussed below.
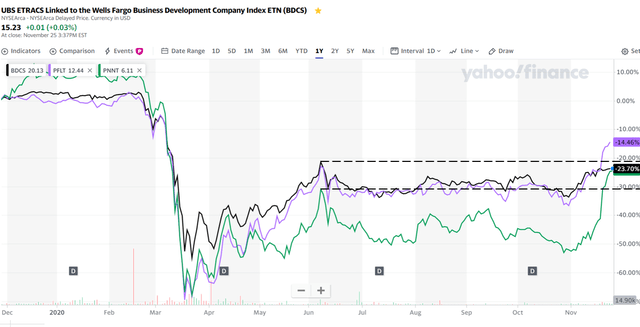
Source: Yahoo
As mentioned in many previous articles, BDCS (the ETN) consistently underperforms the average BDC for many reasons including higher weightings in many of the BDCs that underperform and fund fees. Currently, there are around 45 publicly traded BDCs but the top 7 weightings account for 55%, 3 of them with lower quality management and 6 of them have underperformed the average BDC so far in 2020.
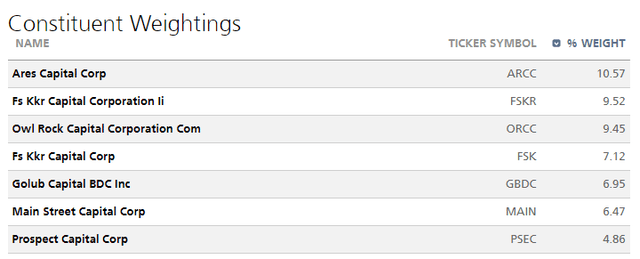
Source: UBS Etracs
Upcoming NAV Increases & Realized Gains
As mentioned earlier, I am expecting most BDCs to report continued increases in book values or net asset values (“NAVs”) over the coming quarters including PFLT and PNNT.
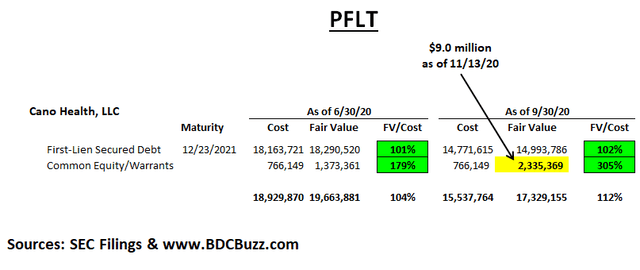
After the markets closed on November 18, 2020, PFLT reported results that included in the following disclosure:
Subsequent to September 30, 2020, our portfolio company, Cano Health, LLC (ITC Rumba, LLC), entered into a business combination agreement with Jaws Acquisition Corp (JWS), a special purpose acquisition vehicle, and other parties, subject to certain closing conditions, with an expected closing late first quarter or early second quarter 2021. Based on the closing stock price of JWS on November 13, 2020, our $2.3 million common stock fair valuation as of September 30, 2020 would increase to an estimated $9.0 million, which includes a combination of cash and stock, assuming the transaction closes based on the agreed terms. This would represent a net asset value increase of $0.17 per share, as of November 13, 2020. Our shares are owned by a limited partnership controlled by the financial sponsor and are subject to customary lock up restrictions. As a result, the fair value on December 31, 2020, may likely include an illiquidity discount not in the public trading values indicated above. There can be no assurance that the implied value of our equity interest will be representative of the value ultimately realized on our equity investment.
Impact on PFLT:
As mentioned above, based on the closing stock price of JWS on November 13, 2020, PFLT’s $2.3 million common stock fair valuation as of September 30, 2020, would increase to an estimated $9.0 million, which includes a combination of cash and stock. This would represent a NAV increase of $0.17 per share. The shares are owned by a limited partnership controlled by the financial sponsor and are subject to lock-up restrictions. As a result, the fair value on December 31, 2020, may likely include an illiquidity discount, not in the public trading values.
Impact on PNNT:
PNNT reported after the markets closed the following day (November 19, 2020) but before that, I sent the following update to investors:
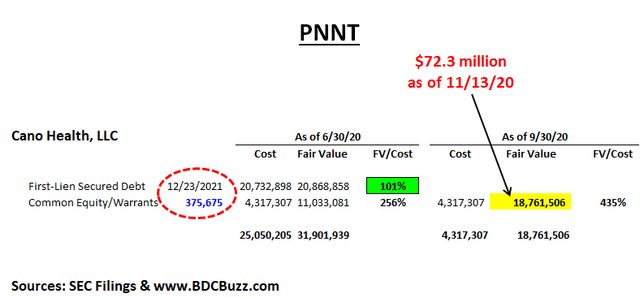
PNNT also has investments in Cano Health including 375,675 shares compared to PFLT as 46,763 shares which were valued at $9.0 million or approximately $192.46 per share. This would imply that PNNT’s shares could be worth $72.3 million compared to the $11.0 million as of June 30, 2020. Simply using PFLT’s recently released financials would indicate that PNNT will have around $7.9 million of unrealized gains during the three months ended September 30, 2020, which is around $0.12 per share. However, there will likely be significant gains in the following quarter of an additional $0.80 per share or a 10% increase in NAV. Also, the amount of realized gains could be $68 million or around $1.00 per share which I need to confirm and this is assuming the valuations provided by PFLT. These are just preliminary estimates and I will be starting a small trading position today before PNNT reports results at the close.
Before PNNT reported I was able to purchase shares at an average price of $4.06 per share:
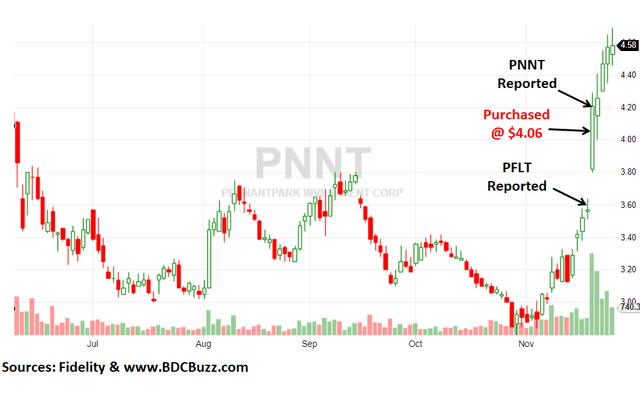
Once PNNT reported results, we found out that the company sold its first-lien loan in Cano Health to the PennantPark Senior Loan Fund (“PSLF”) but still held its 375,675 shares valued at $72.3 million as of November 13, 2020, compared to the fair value of $18.8 million as of September 30, 2020, implying an unrealized gain of $53.5 million or $0.80 per share as mentioned above. This would imply an increase in NAV of around 10.2% and the potential for realized gains of $68.0 million or around $1.01 per share.
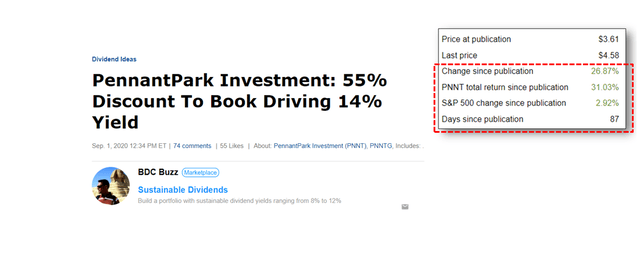
The following is an update to the previous public PNNT article “PennantPark Investment: 55% Discount To Book Driving 14% Yield“:
PNNT’s incentive fee “hurdle rate” of 7.0% is applied to “net assets” to determine “pre-incentive fee net investment income” per share before management earns its income incentive fees. As shown in the following table, the company will likely earn around $0.137 per share each quarter before paying management incentive fees covering around 114% which is ‘math’ driven by an annual hurdle rate of 7% on equity. However, depending on changes in credit quality, there is a chance that PNNT could be downgraded to ‘Level 2’ dividend coverage. Also shown in the table is a ‘Pro-Forma’ scenario using an increased NAV per share to a conservative $8.50 and the company would need to earn $0.149 per share before paying incentive fees to management. It is important to note that PNNT could earn less but management would not be paid an incentive fee.
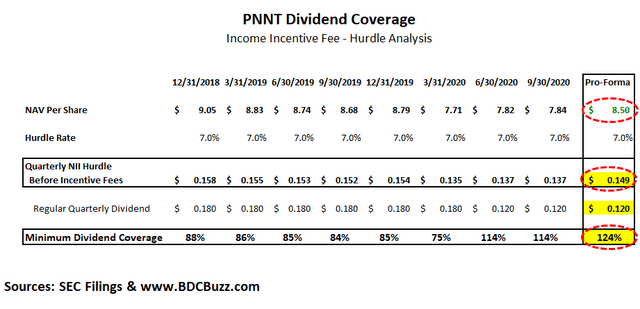
PNNT’s Board extended the incentive fee waiver for an additional quarter through December 31, 2020. My primary concerns for PNNT are mostly related to commodity-related exposure and lack of a “total return hurdle” incentive fee structure to protect shareholders from capital losses.
It should be noted that the previous dividend reduction was accurately predicted in many previous reports. PNNT typically announces its December dividend during the first week of December which is next week.
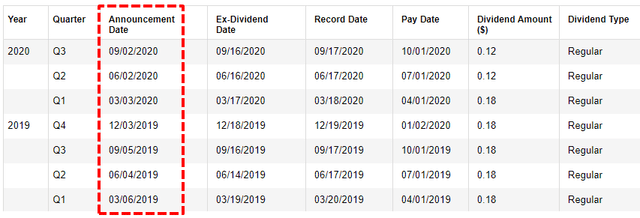
Source: Fidelity
Summary & BDC Market Expectations
As my subscribers are well aware, 2020 has been an excellent year for me and I have made 52 purchases over the last 11 months (many of which were pre-COVID). As shown below, four of these purchases were PFLT with an average yield on cost of almost 20% and average total return of 88%:
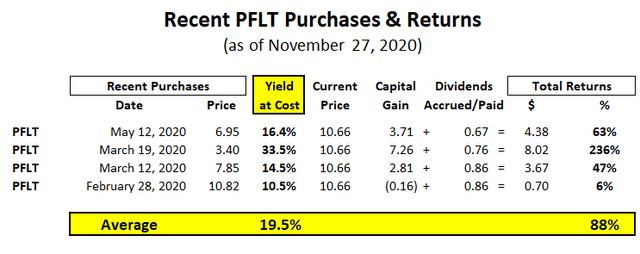
Source: BDC Buzz
I consider PFLT to a ‘buy and hold’ position so I do not plan on selling unless there is a potential problem and will continue to purchase during general market pullbacks (as predicted at the end of this article).
However, PNNT is a trading position for me due to being higher risk (discussed below) and simply using the average BDC price-to-NAV multiple of 0.93 (shown in the first table) would imply a stock price for PNNT of around $7.00 to $8.00.
However, this is NOT how BDCs are priced and PNNT has not traded over $7.00 for a while now including pre-COVID. Also, PNNT has energy/oil-related exposure (discussed next) combined with a lack of a “total return hurdle” incentive fee structure. However, PNNT has higher quality management that has historically done the right things including voluntary fee waivers related to previous capital losses.
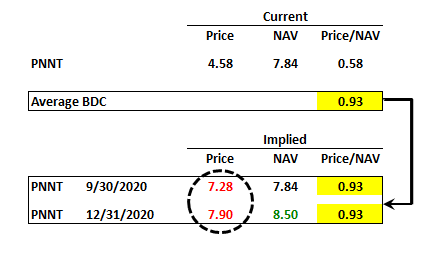
Source: BDC Buzz
Source: Fidelity
The fair value of energy, oil & gas portfolio exposure recently decreased from $113 million to $98.0 million due to additional markdowns of RAM Energy and ETX Energy. However, these investments still account for around 9.1% of the portfolio which is an increase due to selling some of its portfolio investments to the PSLF. Previously, PNNT recapitalized RAM Energy and converted all of its remaining debt obligations to equity. As mentioned in previous reports, both RAM Energy and ETX Energy have suspended all drilling activities and reduced all nonessential capital expenditures, expenses and personnel.
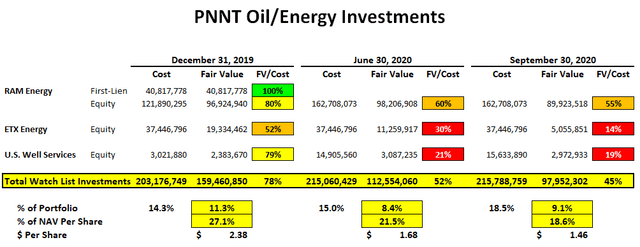
Source: SEC Filings & BDC Buzz
As shown in a previous table if PNNT completely marked down its oil/energy-related investments the impact to NAV per share would be around $1.46 or 18.6%. This more than priced into the stock that is currently trading at a 42% discount to NAV/book value. However, these investments do not produce income, and dividend coverage would not be impacted other than the leverage ratio. Management will likely exit these investments over the coming quarters (depending upon pricing) and was discussed on the previous call.
PRA Events, Inc. was added to non-accrual during the quarter status due to COVID-19 related issues similar to MailSouth, Inc. that added the previous quarter and need to be watched. As of September 30, 2020, non-accrual accounted for 4.9% and 3.4% of the overall portfolio on a cost and fair value basis, respectively.
As mentioned earlier, I started a trading position in PNNT at an average price of $4.06 last week and the stock is already over 13% higher. I will likely sell at some point and hoping for over $5.00 which could be soon especially after the company confirms its quarterly dividend next week.
General Market Expectations:
As for the general BDC market, I am expecting the following;
- Pullback (mid to late December): lockdowns, vaccine delays/issues, stalled stimulus, tax-loss harvesting, investors taking gains
- Rally (late December to late January): partial reversal of pullback drivers, general new year optimism, BDCs reporting another quarter of better-than-expected results
- BDCs Report Results (February): improved net interest margins, NAV per share gains, reaffirmed dividends, and some Q4 special dividends
I believe that there is a good chance that the markets will pull back during the second/third weeks of December 2020 followed by a rally in late December or January. A temporary pullback could be driven by a few potential issues including a larger spike of Covid-19 cases driving fears of additional lockdowns, vaccine delays/issues, Congress stalling on stimulus talks, tax-loss harvesting, or retail sellers taking gains (for Holiday shopping).
The rally in general markets (or at least BDCs) could be driven by a partial reversal of whatever caused the markets to pull back, new year optimism of light at the end of the tunnel, and-or ultimately BDCs reporting another quarter of better-than-expected results similar to previous quarters. I believe that Q4 2020 results will be much better than Q3 2020 for the reasons discussed in previous updates including improved net interest margins (due to higher portfolio yields and/or reduced borrowing expenses) that did not fully impact the earnings for Q3 2020. Also, NAV per share gains will likely be much higher for Q4 2020 and I will discuss in upcoming reports. BDCs will begin reporting Q4 2020 results at the end of January so investors need to be ready to make purchases before.
BDC pricing often reacts quicker and more extreme than the general markets so you need to be prepared to make changes to your portfolio when needed. My upcoming articles will discuss putting together a ‘shopping list’ so that investors are ready for the next round as there are typically 2 to 3 buying points each year. I will discuss this in detail in the next article

Full BDC Reports:
This information was previously made available to subscribers of Premium BDC Reports, along with:
- PNNT and PFLT target prices and buying points
- PNNT and PFLT risk profile, potential credit issues, and overall rankings
- PNNT and PFLT dividend coverage projections and worst-case scenarios
- Real-time changes to my personal portfolio
To be a successful BDC investor:
- Identify BDCs that fit your risk profile.
- Establish appropriate price targets based on relative risk and returns (mostly from regular and potential special dividends).
- As companies report results, closely monitor dividend coverage potential and portfolio credit quality.
- Diversify your BDC portfolio with at least five companies. There are around 50 publicly traded BDCs; please be selective.
Additional disclosure: I am long 17 BDCs but only 2 of them were discussed in this article.