
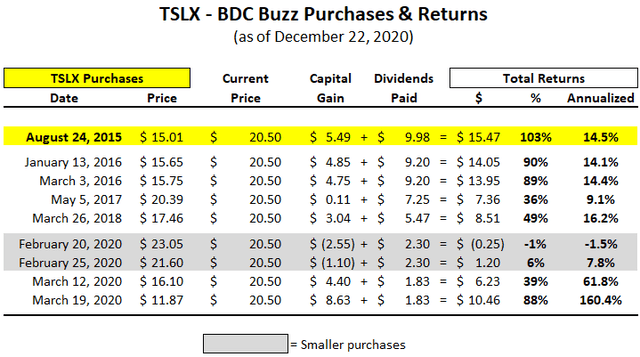
This update discusses Sixth Street Specialty Lending (TSLX) which has been an excellent investment. Over the last 5 years, TSLX has provided me with annualized returns of 14% to 15% and likely headed higher as the stock rebounds and the company continues to pay supplemental dividends.
TSLX Distribution & Q3 2020 Update
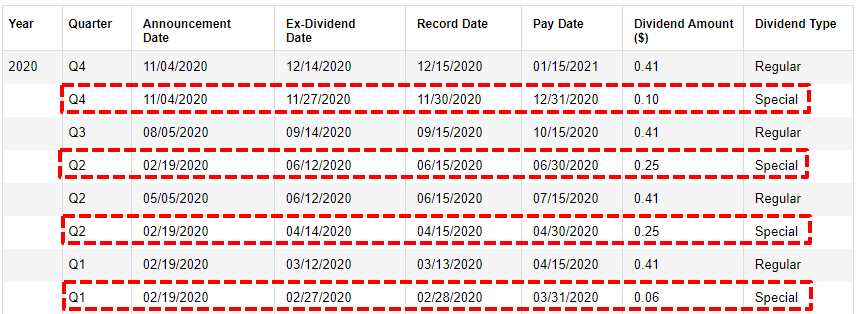
On November 4, 2020, TSLX reaffirmed its regular quarterly dividend of $0.41and announced a supplemental dividend of $0.10 per share to shareholders of record as of November 30, 2020, payable on December 31, 2020.
“Based on a net asset value rebound and the overearning of our base dividend this quarter, our board declared a supplemental dividend and dividend in accordance with our formulaic dividend approach, a supplemental dividend of $0.10 per share, which is half of the quarter’s overearning was declared yesterday to shareholders of record as of November 30 payable on December 31.”
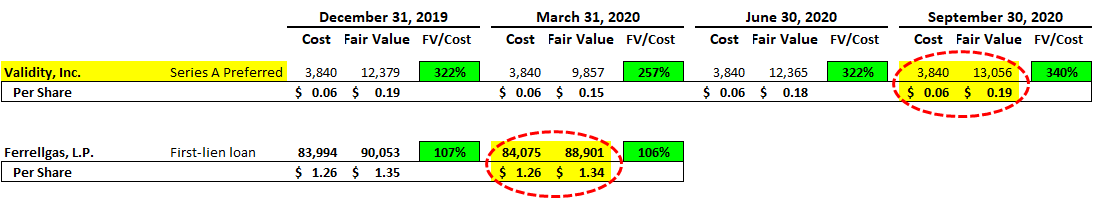
During Q3 2020, the company had realized gains of $11 million or $0.16 per share (to support continued supplemental dividends) due to the sale of its equity position in AFS Technologies, Inc. Also, TSLX still holds its Series A preferred shares of Validity, Inc. valued at $9.2 million over cost and will likely result in upcoming realized gains of $0.13 per share to support additional supplemental dividends:
TSLX is clearly one of the highest quality BDCs that actually performs well in distressed environments such as this. The management team is very skilled at finding value in the worst-case scenarios including previous retail and energy investments. TSLX often lends to companies with an exit strategy of being paid back through bankruptcy/restructuring so they are proficient at stress testing every investment with proper coverage and covenants. Please see the “Previous TSLX Portfolio Credit Track Record” section at the end of this report for some historical examples. Management has prepared for the worst as a general philosophy and historically used it to make superior returns.
Previously, the company paid $0.06 per share of supplemental in Q1 2020 and $0.50 per share of supplemental dividends paid in Q2 2020. When calculating supplemental dividends, management takes into account a “NAV constraint test” to preserve NAV per share. This is one of the reasons that management prefers not to pay large supplemental dividend payments even though the amount of undistributed/spillover income continues to grow. However, management also likes to avoid paying excessive amounts of excise tax through “cleaning out” the spillover as it “creates a drag on earnings”. This was discussed on the recent call:
“We’ve tried to avoid doing large specials, when we put in the recurring supplemental dividend framework, two, 2.5 years ago. And then given that the level set earlier at $0.50, we ended up having friction costs and kind of growing the spillover income and growing unfortunately on a per share basis, the excise tax. And so we wanted to clean it out. I think we’re basically back pre-cleanout. At the beginning of this year, when we went to the board with the proposal, we were at $1.61 per share of undistributed income and at the end of Q3 we were at $1.55. So we’re pretty much back there. The plan is to look at where we sit on tax basis and looking at the 90% rule and look at how much of excise tax is a drag on earnings. And we’ll go through the same work we did at the end of the year – at the end of this year.”
For Q3 2020, TSLX beat its best-case projections (again) covering its regular quarterly dividend by 156% due to higher than expected dividend and fee income as well as higher portfolio yield.
“Other fees, which consists of prepayment fees and accelerated amortization of upfront fees from unscheduled pay downs continued to be relatively strong at $9.3 million led by our fees related to Dye & Durham and now Neiman ABL FILO. Other income increased from $6.5 million to $8.1 million quarter-over-quarter, primarily due to the receipt of a one-time termination fee for a commitment we made in Q1 of 2019, but it was never eligible to be funded given the required milestones in the underlying loan agreement we’re not satisfied.”
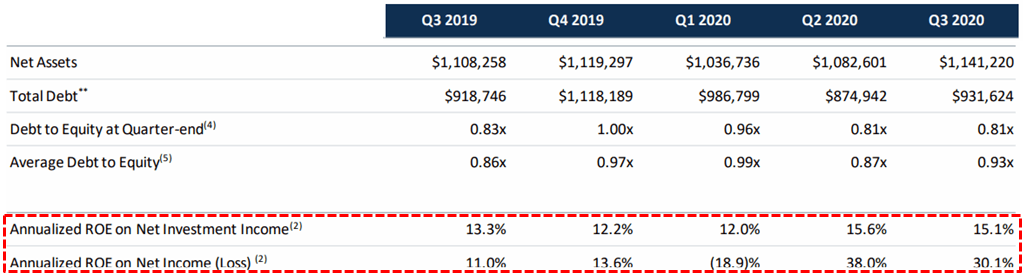
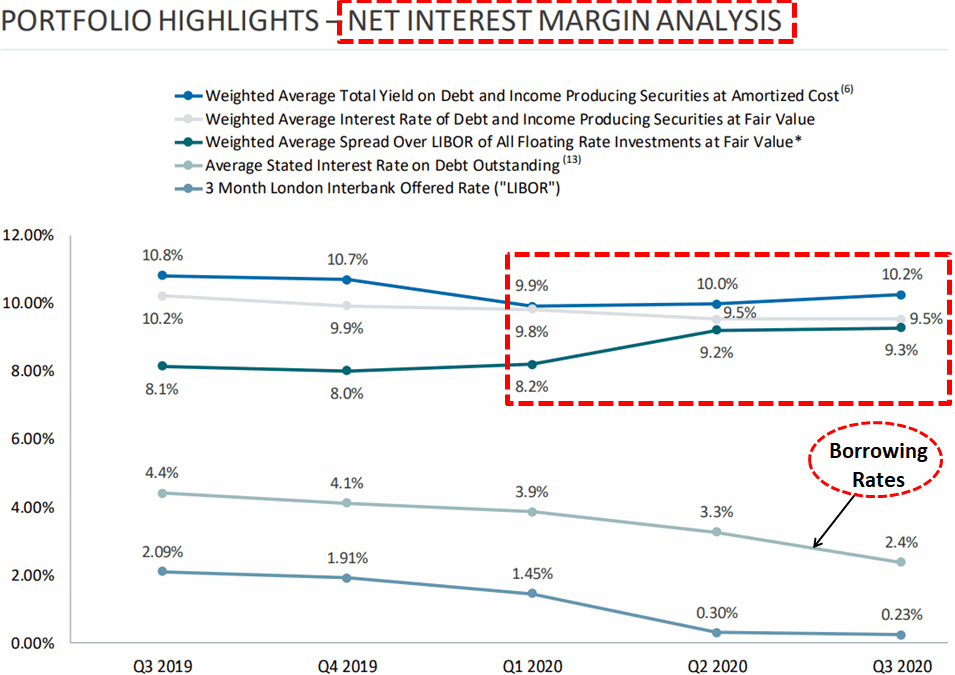
Leverage (debt-to-equity) remained mostly flat and similar to many other BDCs this quarter, TSLX improved its net interest margin with higher portfolio yield and lower borrowing rates likely driving improved dividend coverage over the coming quarters:
“Looking ahead into Q4 based on our current asset level yields and assuming average leverage in line with Q3, we would expect further net interest margin expansion of approximately 10 basis points based on this quarter’s movement in LIBOR.”

Annualized return on equity (ROE) on net investment income and net income of 15.1% and 30.1%, respectively, and an annualized year-to-date ROE on net investment income and net income of 13.5% and 14.7%, respectively.
“On a year-to-date basis, we’ve generated an annualized return on equity on net investment income of 13.5% and net income of 14.7% based on the beginning year pro forma net asset value per share of $16.77, which is adjusted for the impact of our Q4 2019 supplemental dividend of $0.06 per share. Of note, these annualized year-to-date return on ROEs both exceed our average annualized performance since our IPO through the end of 2019, which we think is notable given the difficult operating conditions experienced during the first three quarters of 2020.”
As shown in the following chart there was another increase in its portfolio yield (from 10.0% to 10.2%) and there was another decline in its borrowing rates for improved net interest margins:
“The weighted average total yield on our debt and income producing securities at amortized cost increased by approximately 20 basis points to 10.2% this quarter, primarily driven by the favorable impact of this quarter’s funding activity. The yield at amortized cost of new investments in Q3 was 11.5% compared to 10.8% for exited investments. Note that LIBOR move into Q3 had minimal impact on this quarter’s portfolio yield given that LIBOR had already fallen below the effective average LIBO floor across our portfolio in the prior quarter. Net expenses this decreased by $1.6 million to $28.2 million, primarily driven by lower interest expense from a lower effective LIBOR on our entirely floating rate liability structure; this quota, our weighted average cost of debt decreased by a notable 90 basis points. This was primarily a function of movement in LIBOR during Q2, which flowed through our cost of debt in Q3 due to the one-quarter timing lag on the libel reset dates on our interest rates swaps. We benefit from net interest margin expansion, given a decrease in the cost of that floating rate liabilities, while the earnings power of our contractual floating rate assets is protected by the LIBOR floors that we’ve structured into our loan agreements. The combination of these two forces has been the primary driver of the 100 basis points of net interest margin expansion we’ve experienced year-to-date; equating to incremental earnings of approximately $2.4 million or $0.04 per share.”
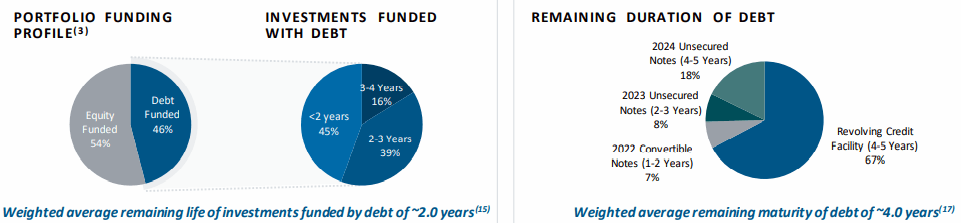
As of September 30, 2020, TSLX had $16 million in cash and cash equivalents and over $1 billion of undrawn capacity on its revolving credit facility:
“Our financial leverage of 0.81 times remained well below the regulatory limit of two times. And we had ample liquidity at quarter end with $1.02 billion of undrawn revolver commitments. At quarter end, our funding mix was comprised of 69% unsecured and 31% secured debt. And our nearest maturity was approximately two years away and only $143 million principal amount. We continue to be matched funded with a weighted average remaining life of our investments funded with debt of two years, compared to a weighted average remaining maturity of four years on our liabilities from revolver commitments.”

During Q3 2020, MD America was added to non-accrual status but TSLX received its regularly scheduled cash interest payment during the quarter and applied those proceeds to the amortized cost of the position due to the “imminent reorganization of the company’s capital structure”. In October 2020, MD America made a voluntary paydown of $1.4 million and subsequently filed for protection under Chapter 11. In Q4 2020, TSLX expects to put $9 million of its loan, or ~70% of its remaining prepetition loan at 9/30/20 fair value, back on accrual status upon MD America’s emergence from Chapter 11 and the remaining investment will be restructured into an equity position. This was discussed on the recent call:
“On MD America, we received a roughly scheduled cash – our regularly scheduled cash interest payment during the quarter, but applied those proceeds to the amortized cost of our position given our view of an imminent reorg of the company’s capital structure that result in a reduction of the value of our loan. Post quarter end, the company made a voluntary pay down of $1.4 million on our position and are subsequently filed for protection under Chapter 11 that implements prepackaged plan of reorganization. For Q4, we expect to put $9 million of our loan or approximately 70% of our remaining pre-petition loan at 9/30 fair value, back on accrual status upon the company’s emergence from Chapter 11. Our remaining investment will be restructured into an equity position. Note that the quarter-end, our total energy exposure was 2.4% of the portfolio at fair value.”
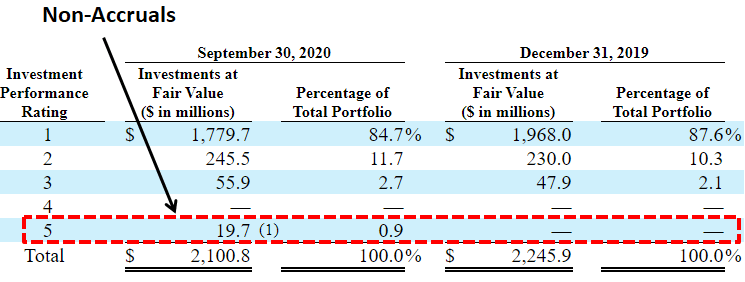
J.C. Penney was added to non-accrual status during Q2 2020 but there was a partial roll-up of its first-lien term loan into the DIP term loan and the rest remains on non-accrual. Mississippi Resources was added to non-accrual status in Q1 2020 and was previously written off with no further impact to NAV per share. The total current fair value of non-accrual investments is $19.7 million or 0.9% of the portfolio but will likely decline in Q4 2020 as MD America is restricted.
“There was a slight increase in our non-accruals this quarter from 40 basis points to 90 basis points on a fair value basis. This was primarily driven to the addition of first lien loan in MD America, an upstream E&P company, which is partially offset by removal of our pre-petition Neiman Marcus term loan and a partial roll up of our JCP’s pre-petition first lien term loan into the debt term loan.”
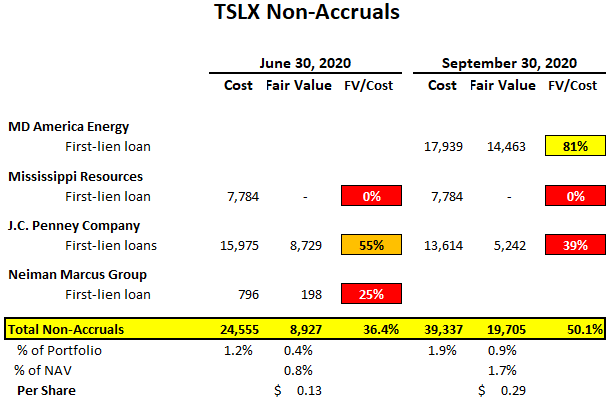
In September 2020, Neiman Marcus Group was removed from non-accrual status as it completed its Chapter 11 bankruptcy protection process eliminating more than $4 billion of debt and $200 million of annual interest expense. The new owners, which include PIMCO, Davidson Kempner Capital Management and Sixth Street Partners LLC funded a $750 million exit financing package that fully refinances its debtor-in-possession (“DIP”) loan.
“In September, upon the full repayment of the Neiman ABL FILO and debt loans, we subsequently funded a new $17 million par value first lien loan related to our exit financing backstop commitment. And our schedule of investments roughly $4 million difference between the par value and the cost basis of the new Neiman loan reflects our fees on the backstop, which were payable and common stock of the reorg company. Our loan today is trading at a price of approximately 104.75. This again was another way that we created value during the volatile market environment earlier this year. We believe our attractive cost base along with the company’s high quality assets and improved perspective cash flow profile post restructuring provide considerable downside protection on our investments.”
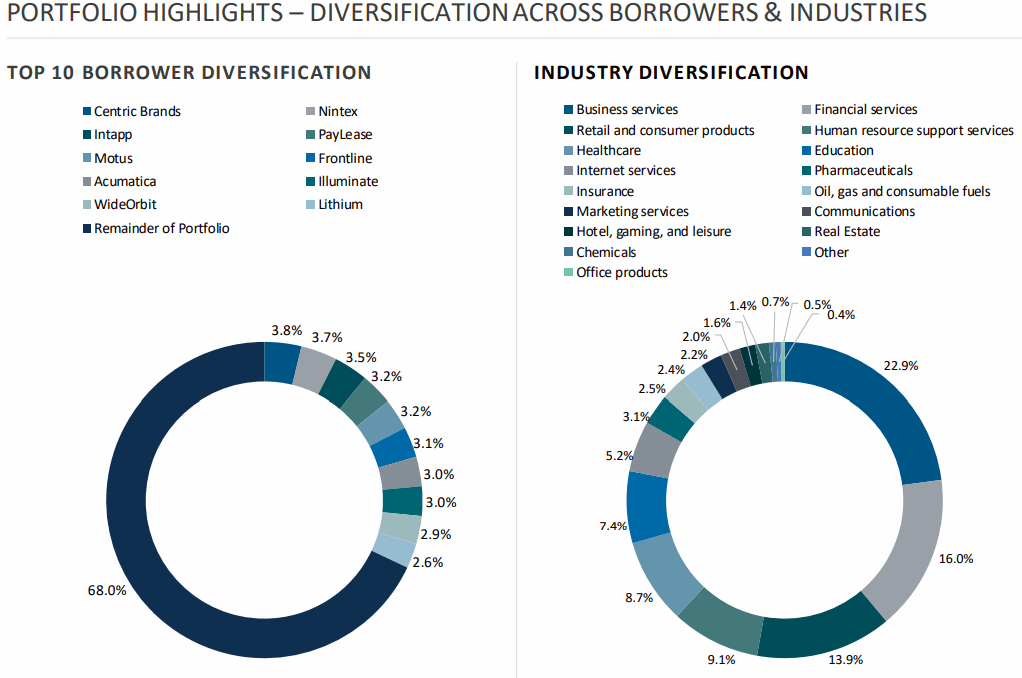
“Retail and consumer products was our third highest industrial exposure increasing from 11.3% to 13.9% quarter-over-quarter; this was primarily driven by new fundings for designer brands and centric brands, which was partially offset by the repayment of the Neiman ABL FILO Term Loan. Post quarter end, we fully exited our investment in Centric Brands in connection with a new financing obtained by the company as it emerged from bankruptcy. Pro forma the pay down of Centric Brands, our retail and consumer exposure would have been 10.5% at quarter-end and retail names – with retail names comprising 9.5% of the portfolio and 77% of this exposure consisting of ABL investments. 99 Cents is doing well and there’s going to be a significant refi risk.”
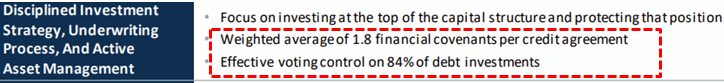
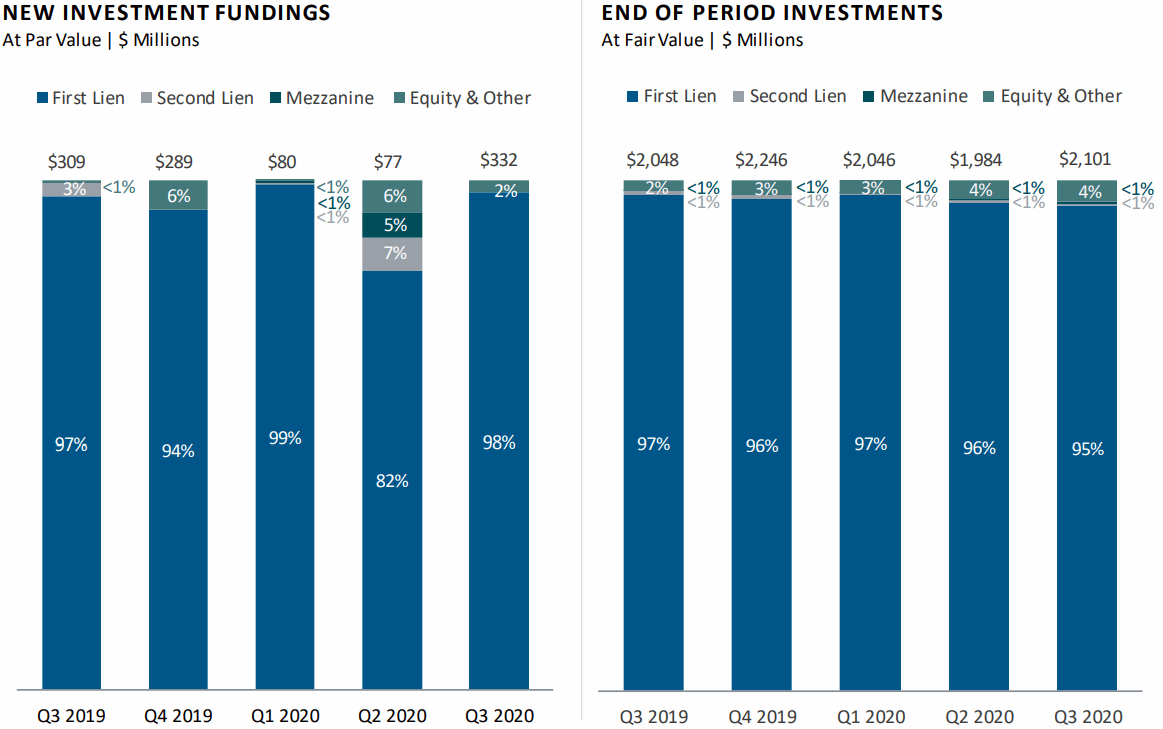
First-lien debt accounts for around 95% of the portfolio and management has previously given guidance that the portfolio mix will change over the coming quarters with “junior capital” exposure growing to 5% to 7%.
“While none of our portfolio companies have been immune to the economic impact of COVID, only 11% of our portfolio by fair value at quarter end has experienced meaningful performance issues directly related to it. We believe the relative resilience of our portfolio is mostly a result of a deliberate shift we made in late 2014 towards a more defensive portfolio construction. Today, 95% of our portfolio by fair value is first lien and nearly 75% of our portfolio by fair value is comprised of mission critical software businesses with sticky predictable revenue characteristics. These businesses also tend to have variable cost structures that it can be fluxed down to support debt service and protect liquidity in cases of challenging operating environments.”
“A portfolio weighted average performance rating was 1.21 compared to 1.23 in Q2, on a scale of one to five with one being the strongest. There were no material changes in the overall credit metrics of our portfolio companies. Interest covers this quarter remain flat at 3.3X, net attachment point was unchanged at 0.4X, and that leverage increased slightly from 4.3X to 4.4X, which is on par with our trailing two-year historical quarterly average.”
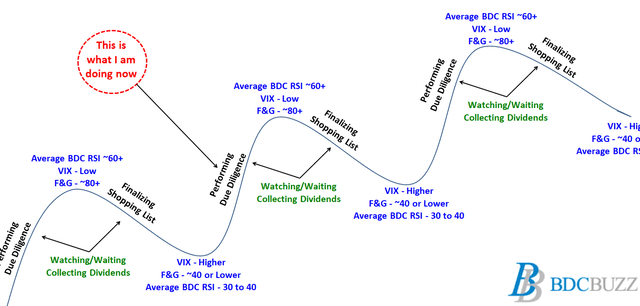
Volatility is your friend!
BDC pricing can be volatile and timing is everything for investors that want to get the “biggest bang for their buck” but still have a higher-quality portfolio that will deliver higher-than-average returns over the long term. One of my goals is to help subscribers take advantage of “oversold” conditions.
Full BDC Reports
This information was previously made available to subscribers of Premium BDC Reports, along with:
- TSLX target prices and buying points
- TSLX risk profile, potential credit issues, and overall rankings
- TSLX dividend coverage projections and worst-case scenarios
- Real-time changes to my personal portfolio
BDCs trade within a wide range of multiples driving higher and lower yields mostly related to portfolio credit quality and dividend coverage potential (not necessarily historical coverage). This means investors need to do their due diligence before buying.
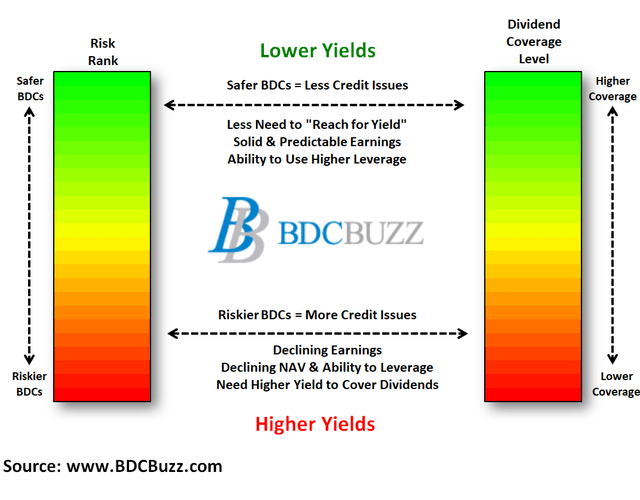
To be a successful BDC investor:
- Identify BDCs that fit your risk profile.
- Establish appropriate price targets based on relative risk and returns (mostly from regular and potential special dividends).
- As companies report results, closely monitor dividend coverage potential and portfolio credit quality.
- Diversify your BDC portfolio with at least five companies. There are around 45 publicly traded BDCs; please be selective.