
OCSL Distributions Update
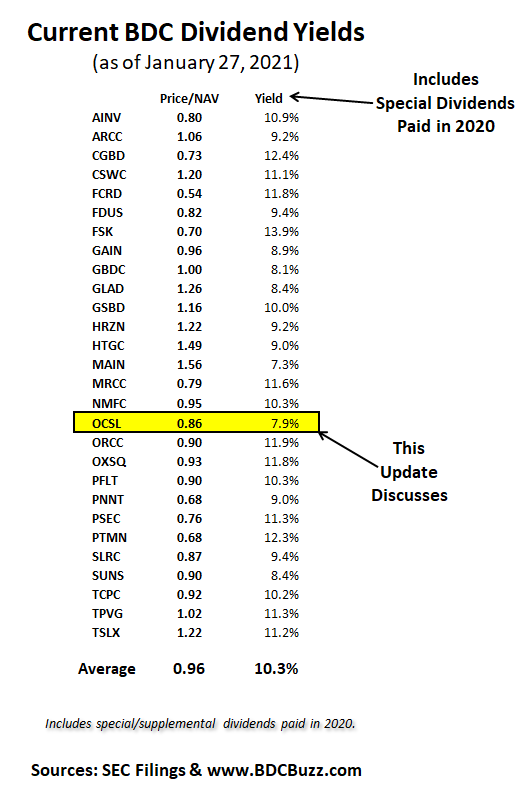
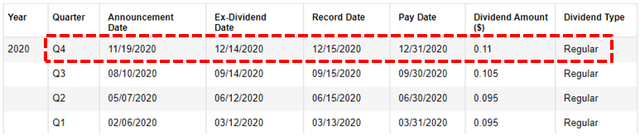
As mentioned in the public article “Still Waiting For a Dividend Increase From Oaktree”, I have been expecting Oaktree Specialty Lending (OCSL) to increase its dividend for a while. In August 2020, the company announced an increase in the quarterly dividend from $0.090 to $0.105, and on November 19, 2020, the dividend was increased to $0.110 paid on December 31, 2020, to shareholders of record on December 15, 2020.
Armen Panossian, CEO and CIO: “Based on our consistent performance and our expectations for continued strong earnings, our board increased our quarterly dividend by 5% to $0.11 per share, the second consecutive quarter with a dividend increase. So we raised the dividend in the last two quarters and part of that was actually driven by COVID in terms of taking advantage of the investment environment COVID created to put more assets in the BDC at higher yields, which generated more income. So COVID actually was helpful in terms of the dividend for us, given the investment activity we did during that period. I think being conservative on the dividend with the view that increasing NAV is a good thing as well. So those are kind of all the things that we put into the equation as we speak to the Board and think about the dividend.”
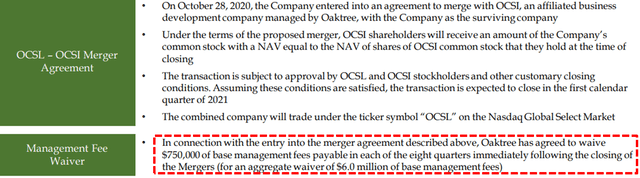
On October 28, 2020, OCSL entered into an agreement to merge with OCSI and is expected to close in calendar Q1 2021. The combined company will trade under the ticker symbol “OCSL”. In connection with the merger agreement, Oaktree has agreed to waive $750,000 of base management fees payable in each of the eight quarters following the closing (please see merger slides at the end) and is taken into account with the updated projections. As shown in the ‘best case’ projections, there is the possibility of additional increases in its quarterly dividend partially due to the merger with OCSI that is expected to close in Q1 2020:
“As you know, OCSL and Oaktree Strategic Income Corporation, entered into a merger agreement with OCSL to be the surviving company. We believe this merger represents a great opportunity for shareholders of both OCSL and OCSI. We expect it will create a larger, more scaled BDC with increased trading liquidity, potentially broaden our institutional shareholder base and may improve access to lower cost sources of debt. We also anticipate that it will drive NII accretion over both the near and long-term. We feel that now is the right time to move forward with this merger. Both portfolios are in great shape and our transition out of non-core assets that we’ve been working on since 2017 is nearly complete. In terms of the next steps, we anticipate filing the N-14 during proxy statements in the coming weeks and expect the transaction will close in the first calendar quarter of 2021, subject to shareholder approval and satisfaction of other closing conditions as outlined in the merger agreements.”
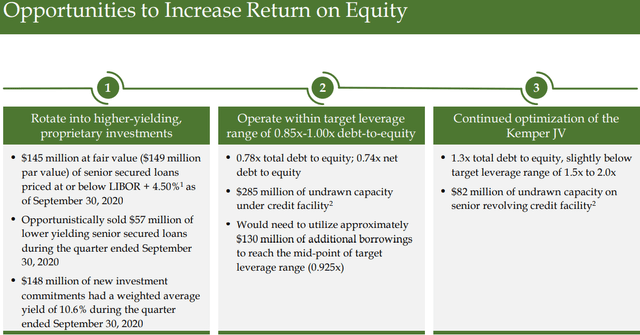
I am also expecting improved earnings over the coming quarters through the use of higher leverage, continued rotation into higher yield investments, and higher returns from its Senior Loan Fund (“SLF JV I”):
“Leverage at the JV was 1.3 times at year-end, down slightly from the June quarter. The Kemper JV continues to present an opportunity for us to improve returns. As of year end, the JV had $82 million of investment capacity. We believe that the prudent growth of the JV will also be accretive to ROE over time.”
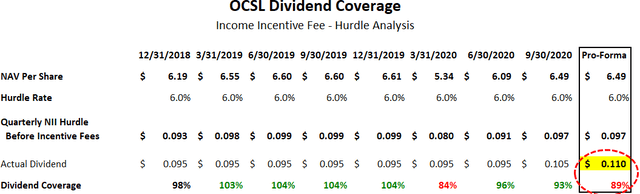
OCSL’s incentive fee agreement includes a “hurdle rate” of 6% (relatively low and not shareholder-friendly) is applied to “net assets” to determine “pre-incentive fee net investment income” per share before management earns its income incentive fees. As shown in the following table, the company will likely earn around $0.097 per share each quarter before paying management incentive fees covering around 89% of the recently increased dividend which is ‘math’ driven by an annual hurdle rate of 6% on equity. It is important to note that OCSL could earn less than $0.097 per share but management would not be paid an incentive fee.
For the three months ended September 30, 2020, OCSL beat its best-case projections due to “higher make-whole interest income, original issue discount (“OID”) acceleration, and prepayment fees” mostly related to the prepayment of NuStar Logistics.
“The increase was due mainly to higher interest income resulting from increased make-whole interest, OID acceleration and higher prepayment fees on loan payoffs. We also experienced a slightly higher average yield on our floating rate debt investments despite LIBOR being down again for the quarter. The higher make-whole interest and fee income quarter-over-quarter was mostly due to the prepayment of the NuStar loan, which generated over $8 million of nonrecurring interest income and fees.”
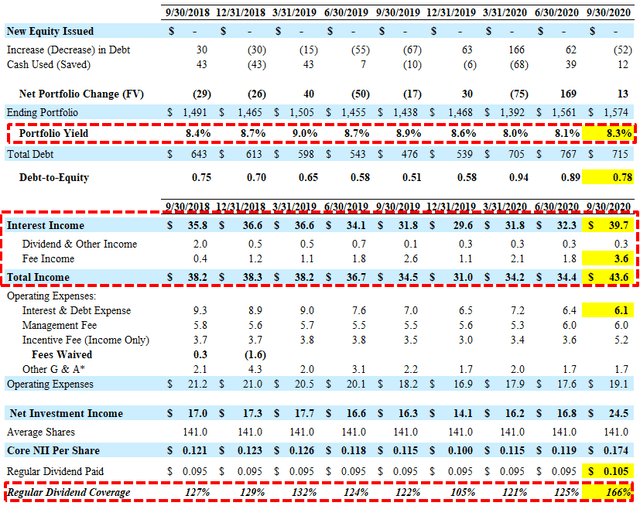
There was another increase in the overall portfolio yield from 8.1% to 8.3%. OCSL has covered its dividend by an average of 129% with average earnings of around $0.127 per share over the last four quarters partially due to reduced borrowing rates.
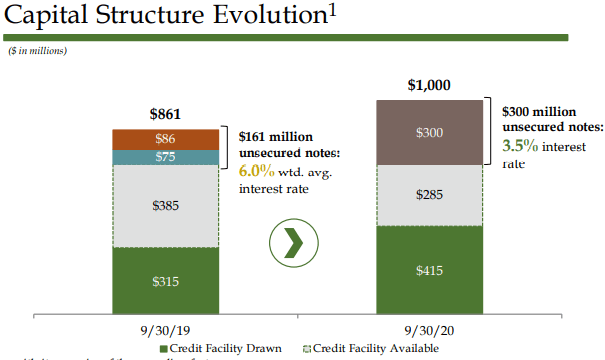
“This deliberate shift in our portfolio has led to higher yielding investments. The average yield in our new debt investments increased over the course of the year and was 10.6% for investments made in the fourth quarter. This all occurred against the backdrop of decreasing interest rates with LIBOR declining by over 180 basis points in the same timeframe. Another major accomplishment in fiscal year 2020 was the further improvements we made to our capital structure, reducing funding costs and improving our finance and flexibility. In February, we successfully completed $300 million note offering that was attractively priced at a coupon of 3.5%. Part of the proceeds were used to redeem our higher coupon bonds, which had a blended interest rate of around 6%.”
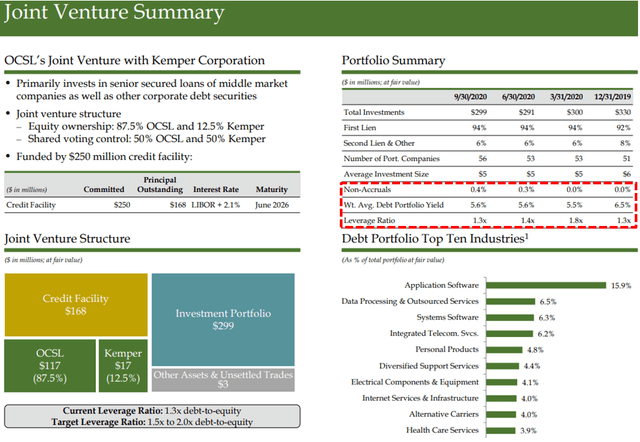
There was a slight decline in income generated from its Senior Loan Fund (“SLF JV I”) with $1.8 million during the recent quarter down from $2.0 the previous quarter likely due to lower leverage or the slight increase in non-accruals as shown below:
“Shifting now to the Kemper joint venture. As of September 30th, the JV had $313 million of assets invested in senior secured loans to 56 companies. This compared to $315 million of total assets invested in 53 companies last quarter. Assets were basically flat quarter-over-quarter as the increase in the market value of its investments was offset by payoffs and exits. Leverage at the JV was 1.3 times at year-end, down slightly from the June quarter. The Kemper JV continues to present an opportunity for us to improve returns. As of year end, the JV had $82 million of investment capacity. We believe that the prudent growth of the JV will also be accretive to ROE over time.”
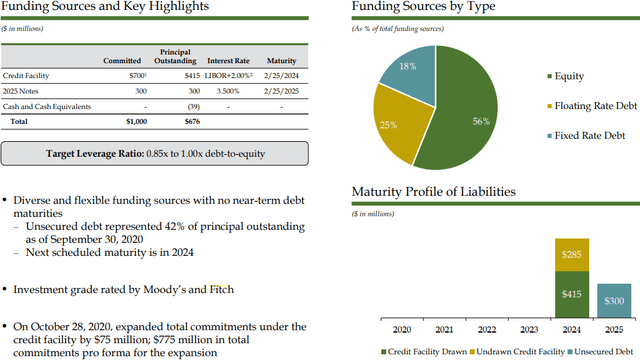
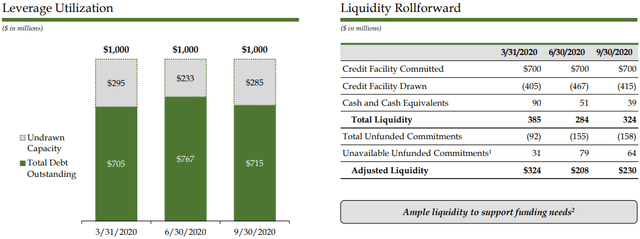
OCSL has growth capital available given its historically low leverage with a current debt-to-equity ratio of 0.78. As of September 30, 2020, OCSL had $39 million of cash and $285 million of undrawn capacity on its credit facility. In June 2019, shareholders approved the reduced asset coverage requirements allowing the company to double the maximum amount of leverage. The investment adviser reduced the base management fee to 1.0% on all assets financed using leverage above 1.0x debt-equity. Moody’s and Fitch have previously assigned OCSL investment-grade credit ratings (Moody’s, Baa3 / Stable, and Fitch, BBB- / Stable).
“Our net leverage ratio decreased to 0.74 times from 0.83 times at June 30th, reflecting both the increase in NAV at $38 million in net payoffs and exits. We are presently just below the low end of our leverage target range of 0.85 times to 1.0 times. So as we see things right now, the 0.85:1 seems like the right level, kind of works for all of our constituents. But that could change, I don’t think it will change tomorrow but that could change down the road if we see kind of a more interesting investment environment.”
OCSL Risk Profile Update
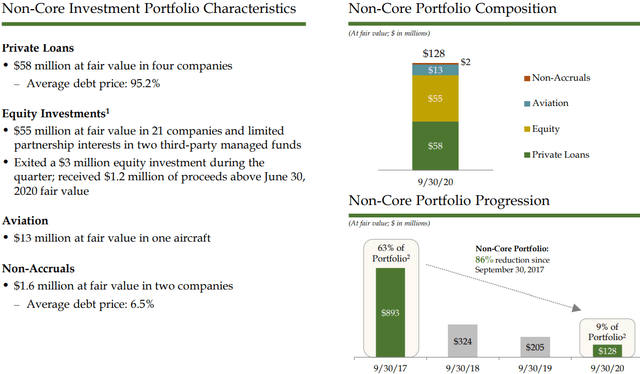
Over the last three years, management has made meaningful progress shifting the portfolio from ‘non-core’ legacy assets that now account for around 9% (same as the previous quarter) of the portfolio fair value.
“We continued our portfolio repositioning during the year and successfully monetized $50 million of non-core investments, which resulted in aggregate proceeds of $59 million. At year-end, noncore investments represented only 9% of the portfolio.”
Net asset value (“NAV”) per share increase by 6.5% mostly due to “unrealized gains resulting from price increases on liquid debt investments and the impact of tighter credit spreads on private debt investment valuations following the improvement in broader credit market conditions, realized gains on equity investments and undistributed net investment income.”
“Our NAV staged an impressive recovery from the decline in the March quarter when the markets concern over the impact of pandemic was at its peak. The rebound was $1.15 per share, recapturing 91% of the decline in that quarter. We had another strong year of origination. During the year, we originated over $800 million of new investments, representing over half of the value of our portfolio at the start of the year. Notably, a large portion of our originations occurred during the post-COVID period. Following the market disruption last March, valuations continue to improve in the September quarter, resulting in a NAV increase of 6% from the June quarter to $915 million, reflecting price recovery in our liquid debt investments and tighter credit spreads. In addition, our investments in the Kemper joint venture were written up by $7 million or 7%, reflecting continued appreciation in this mostly first lien loan portfolio.”
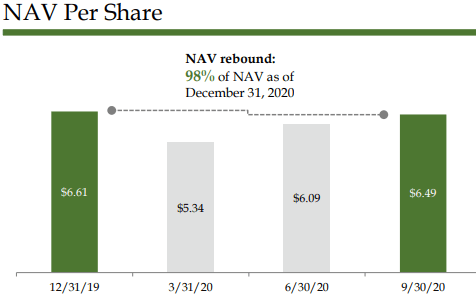
NAV remains 1.7% lower from $6.61 as of December 31, 2019 primarily due to:
“depreciation of certain debt and equity investments related to increased market volatility resulting from the onset of the COVID-19 pandemic in March 2020, partially offset by undistributed net investment income.”
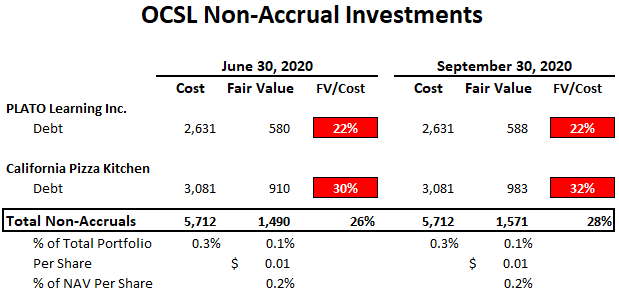
California Pizza Kitchen and PLATO Learning remain on non-accrual status but were previously written down and only account for 0.1% of the portfolio fair value:
“Our credit quality remains strong, with only 2 out of our 113 portfolio companies on nonaccrual status, representing one-tenth of 1% of the total portfolio at fair value. During the quarter, all of our portfolio companies made their scheduled interest payments with the exception of one company that, consistent with prior quarters, made its interest payments in kind.”
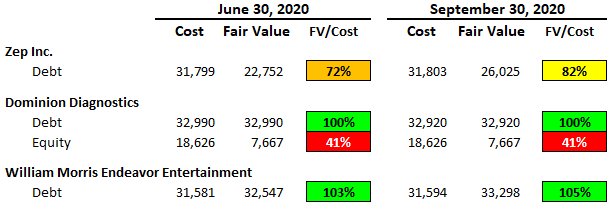
A few of the ‘watch list’ investments (Zep Inc., Dominion Diagnostics, and William Morris Endeavor Entertainment) were discussed on the recent call:
“Zep is a cleaning materials company. It did have some execution issues over the pre-COVID that resulted in the company looking more levered as a result of EBITDA declines. People are cleaning more and sanitation products are doing better as is Zep. Now it remains levered and that’s why we have it marked the way we do. But the leverage is, at least post COVID, heading in the right direction, as in down. But we don’t feel comfortable marking it more aggressively, because we do still think that the company is more levered than we would like it to be and that’s the reason why Zep is where it is.”
“Dominion is a little bit of a different issue, it’s a diagnostics laboratory company. They are modestly helped by the coronavirus but there’s some puts and takes, because although there is more work being done around coronavirus and the company certainly benefits from that, there is a decline in elective surgeries, elective cases, going to the doctor for a checkup, et cetera, because of coronavirus as well. So there are puts and takes on that business. There’s some countervailing pressures as well. And as you know, we’re going to be fair and err on the side of conservatism generally in the way we mark things. And we’d like to be proven wrong if and when it’s appropriate that the company’s performance necessitate a markup, but we don’t want to be ahead of that curve.”
“William Morris, as you’re familiar with, is a leading entertainment management and media rights company. You’re right that directionally, with vaccine news and live events starting to come back, NBA in a bubble, baseball, et cetera, that’s generally a good thing for William Morris. And our loan has nice call protection, has a pretty rich coupon relative to the pari passu, LIBOR plus $2.75 first lien term loan that the company has. And that term loan is something that could be observed in terms of trading prices in the market. And it’s moved up nicely. I think that’s all I would say about William Morris. I would hesitate to drive forward guidance, because we also think that COVID cases are going to spike, so there’s going to be some choppiness in the next few quarters. But the company has taken out some cost and is managing very well in terms of its liquidity needs for the foreseeable future.”
Full BDC Reports
This information was previously made available to subscribers of Premium BDC Reports, along with:
- OCSL target prices and buying points
- OCSL risk profile, potential credit issues, and overall rankings
- OCSL dividend coverage projections and worst-case scenarios
- Real-time changes to my personal portfolio
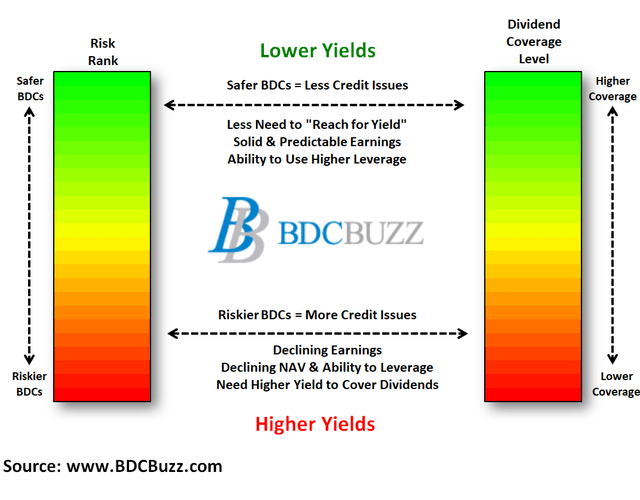
BDCs trade within a wide range of multiples driving higher and lower yields mostly related to portfolio credit quality and dividend coverage potential (not necessarily historical coverage). This means investors need to do their due diligence before buying.
To be a successful BDC investor:
- Identify BDCs that fit your risk profile.
- Establish appropriate price targets based on relative risk and returns (mostly from regular and potential special dividends).
- As companies report results, closely monitor dividend coverage potential and portfolio credit quality.
- Diversify your BDC portfolio with at least five companies. There are around 45 publicly traded BDCs; please be selective.