
FS KKR Capital (FSK) Update
- Non-accruals declined to 2.5% due to restructurings/exits driving an additional $0.71/share of realized losses. FSK had a total of $4.01/share of realized losses in 2020.
- FSK has much higher cyclical exposure including retail, capital goods, real estate, energy, and commodities that account for over 28% of the total portfolio.
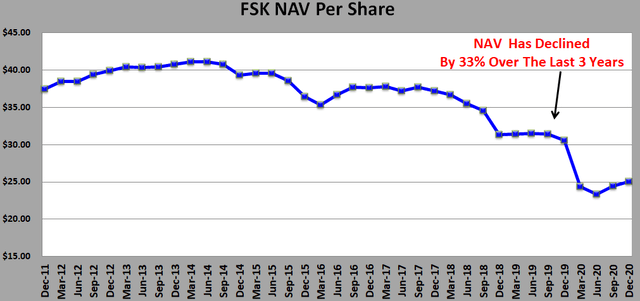
- FSK is for traders, considered higher risk due to its lower credit quality driving a 33% decline in NAV per share and two dividend reductions over the last 3 years.
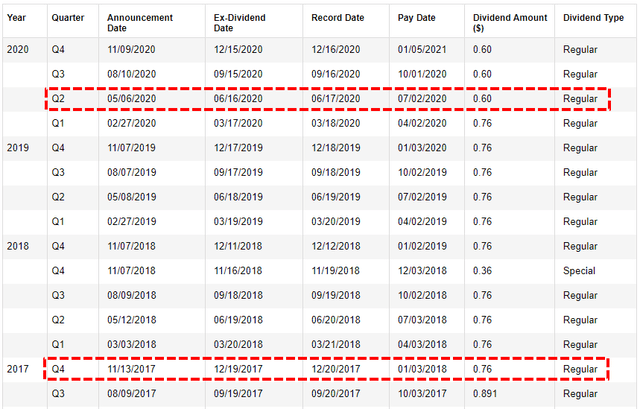
- FSK dividend coverage has been reliant on no incentive fees paid over the last 5 quarters. However, management is removing this ‘lookback’ feature in connection with the merger with FSKR.
- FSK is trading at a 23% discount to NAV with a 12.4% yield for a reason.
During Q4 2020, total non-accruals declined from 2.9% to 2.5% the portfolio fair value due to restructuring/exiting its investments in DEI Sales Inc, Chisholm Oil & Gas, and Z Gallerie driving an additional $88 million or $0.71 per share of realized losses. If non-accruals were completely written off would impact NAV per share by around $1.39 or 5.6%. Most of the investments on non-accrual have been discussed in previous reports and management typically refers to most of them as “legacy investments”.
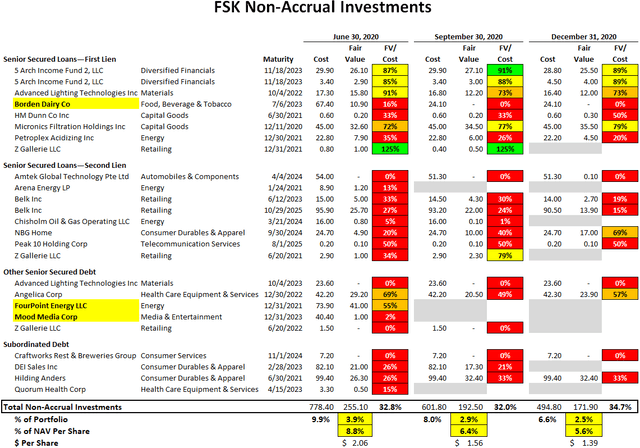
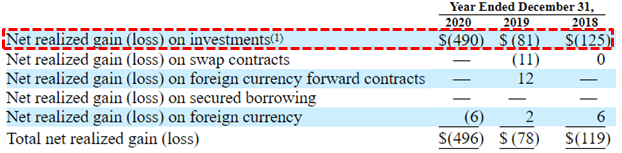
It should be noted that FSK had a total of $490 million or $4.01 per share of realized losses during 2020 that included the restructuring of Borden Dairy, FourPoint Energy, and Mood Media during Q3 2020.
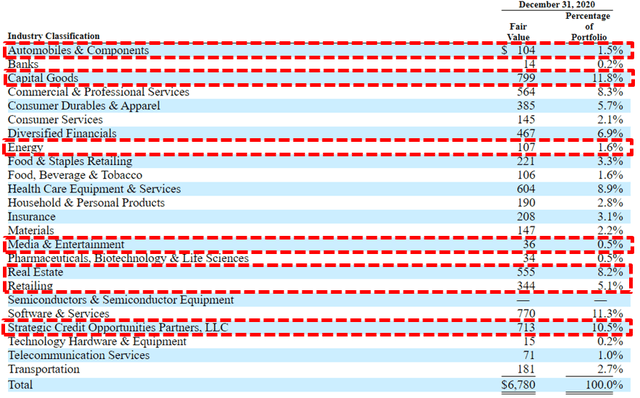
FSK has much higher cyclical exposure including retail, capital goods, real estate, energy, and commodities that account for over 28% of the total portfolio. It also many of the same sector exposures in its SCJV which is over 10% of the portfolio.
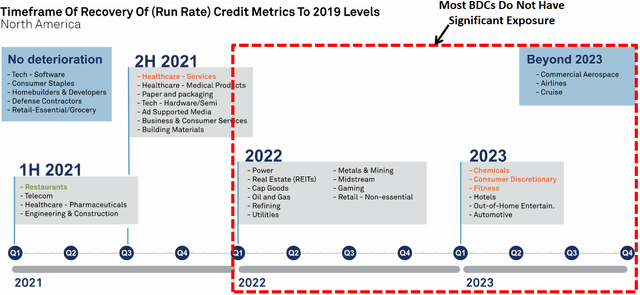
As mentioned in previous updates, I will be updating the risk profiles for each BDC taking into account sector exposures. I found the following “Timeframe of Recovery of Credit Metrics to 2019 Levels” from S & P Global Ratings on February 17, 2021, to be an interesting view of the recovery prospects. I will likely take a more conservative approach when updating the risk rankings. BDCs such as FSK, FSKR, and AINV have much higher concentrations of sectors that will likely take longer to recover which is taken into account with their risk ranks and pricing.
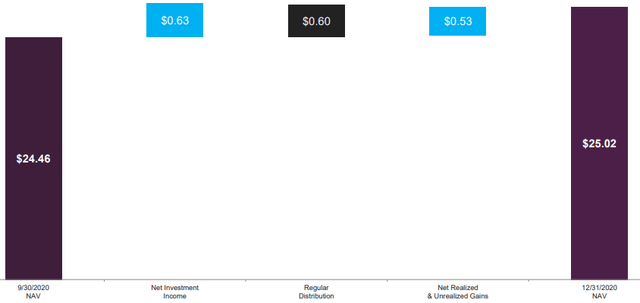
During Q4 2020, its net asset value (“NAV”) per share reflated by 2.3% (from $24.46 to $25.02) due to unrealized gains in the portfolio and overearning the dividend.
“We were pleased to conclude 2020 with such a positive quarter. Across our BDC franchise during the fourth quarter, we originated approximately $1.9 billion of new investments, $613 million of which were within FSK. At FSK, our net investment income per share more than covered our $0.60 quarterly dividend, and our net asset value increased by 2.3% quarter over quarter. Additionally, in November we announced the proposed merger of FSK and FSKR, which would create a single BDC with approximately $16 billion in assets, and in December we accessed the public debt markets raising $1 billion in long term, unsecured capital at attractive rates. As a result, we enter 2021 with excitement regarding our prospects from both an operational and investment standpoint.”
Over the last three years, FSK’s NAV per share has declined by almost 33%.
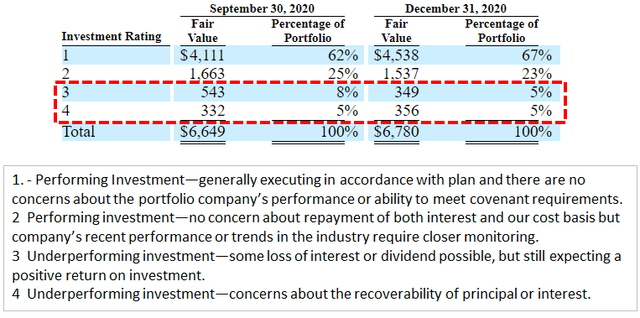
The amount of investments with ‘Investment Rating 3 and 4’ decreased from 13% to 10% of the portfolio fair value or 23% of NAV per share and needs to be watched. ‘Investment Rating 3 and 4’ are identified as “Underperforming investment concerns about the recoverability of principal/interest and/or some loss of interest or dividend possible, but still expecting a positive return on investment”.
FSK has been covering its dividend only due to no incentive fees paid driven by the ‘total return’ hurdle and continued capital losses. The company will eventually need to start paying an incentive fee for the following quarters:
Q. “Do you know how many quarters of additional incentive fee waivers we have in front of us before they’re absorbed if we’d look back?”
A. “Probably two quarters ago now that we said we expected it to be kind of in the five to six quarter range from that period of time. Clearly in our guidance for the fourth quarter, there’s not an incentive fee. Clearly the books moved in a positive direction, too. So forgive me for not having the exact math. But hopefully, that’s maybe a bit of a bookend for you and we can also follow up offline.”
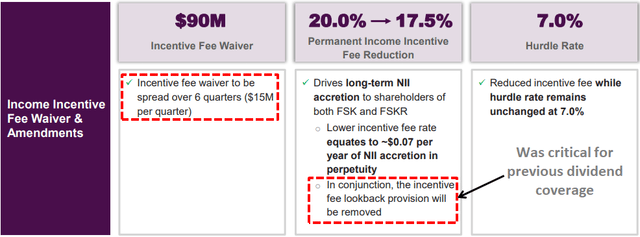
On November 24, 2020, FS/KKR Advisor, LLC announced that FSK and FS KKR Capital II (FSKR) entered into a definitive merger agreement. In connection with the merger, the board has approved an amended advisory agreement for the combined company permanently reducing its income incentive fee to 17.5% from the existing 20.0%. However, the ‘total return’ hurdle or ‘look back’ provision will be removed. FS/KKR has agreed to waive $90 million of incentive fees spread evenly over the first six quarters following the closing. This waiver equates to $15 million per quarter. It is important to note that the company would have paid almost $90 million in incentive fees over the last five quarters without the look-back provision which is almost $18 million per quarter. However, that is based on 20.0% income incentive fees compared to 17.5% but also only for FSK. The merger will double the size of the company with similar holdings and credit issues implying that the $15 million per quarter could be insufficient if there are continued/additional credit issues. FSKR’s NAV per share has declined by almost 30% over the last three years. Please see additional merger information/slides included later in this report.
On the previous earnings call management mentioned that the company might be switching a portion of its quarterly dividend to include a variable component similar to Apollo Investment (AINV) and TCG BDC, Inc. (CGBD):
“As a reminder, over the long term, we expect our dividends per share will equate to a 9% yield on our net asset value per share, but we acknowledge there will be certain quarters where our annualized yield may be greater or less than this range due to quarter-to-quarter fluctuations in the business from an operational standpoint. Obviously, our dividend policy of achieving a 9% target dividend yield on our net asset value means that over time, it would be normal for our quarterly dividend to fluctuate somewhat in concert with the quarter-to-quarter change in our net asset value.”
Q. “Should we think of this variable policy as more transitory or permanent concept?”
A. “I think it’s probably a bit of a combination of creating a sense of stability. But also, I think, understanding what this product is and what the BDC is, I think that a variable component does make some real sense to us. We think of this more as a permanent shift, rather than a transitory shift. And we think, frankly, the industry would benefit itself in the same way, not just our platform. There’s so many variables, every quarter that BDC’s deal with in terms of changing interest rate environments, changing deal environments, we’ve talked a lot about pricing a pipeline, credit quality, it’s just lots of inputs that you handle every quarter as an operator. And to have a fixed dividend over time, this becomes very difficult for all BDC. So we think having more of a floating type policy that matches NAV and creates a target yield for investors over a long sustained period of time, as we think of a more enlightened, better way to go for the industry as the industry continues to mature, frankly.”
FSK had spillover or undistributed income of around $200 million which can be used for temporary dividend coverage shortfalls only and will likely reset its dividend as needed (similar to the previous two reductions).
Full BDC Reports
This information was previously made available to subscribers of Premium BDC Reports, along with:
- FSK target prices and buying points
- FSK risk profile, potential credit issues, and overall rankings
- FSK dividend coverage projections and worst-case scenarios
- Real-time changes to my personal portfolio
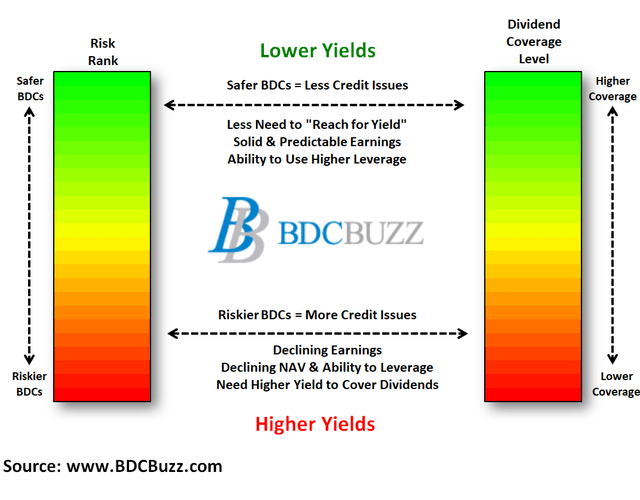
BDCs trade within a wide range of multiples driving higher and lower yields mostly related to portfolio credit quality and dividend coverage potential (not necessarily historical coverage). This means investors need to do their due diligence before buying.
To be a successful BDC investor:
- Identify BDCs that fit your risk profile.
- Establish appropriate price targets based on relative risk and returns (mostly from regular and potential special dividends).
- As companies report results, closely monitor dividend coverage potential and portfolio credit quality.
- Diversify your BDC portfolio with at least five companies. There are around 45 publicly traded BDCs; please be selective.