The following information was previously provided to subscribers of Premium BDC Reports along with:
- GBDC target prices/buying points
- GBDC risk profile, potential credit issues, and overall rankings
- GBDC dividend coverage projections (base, best, worst-case scenarios)
![]()
Golub Capital (GBDC)
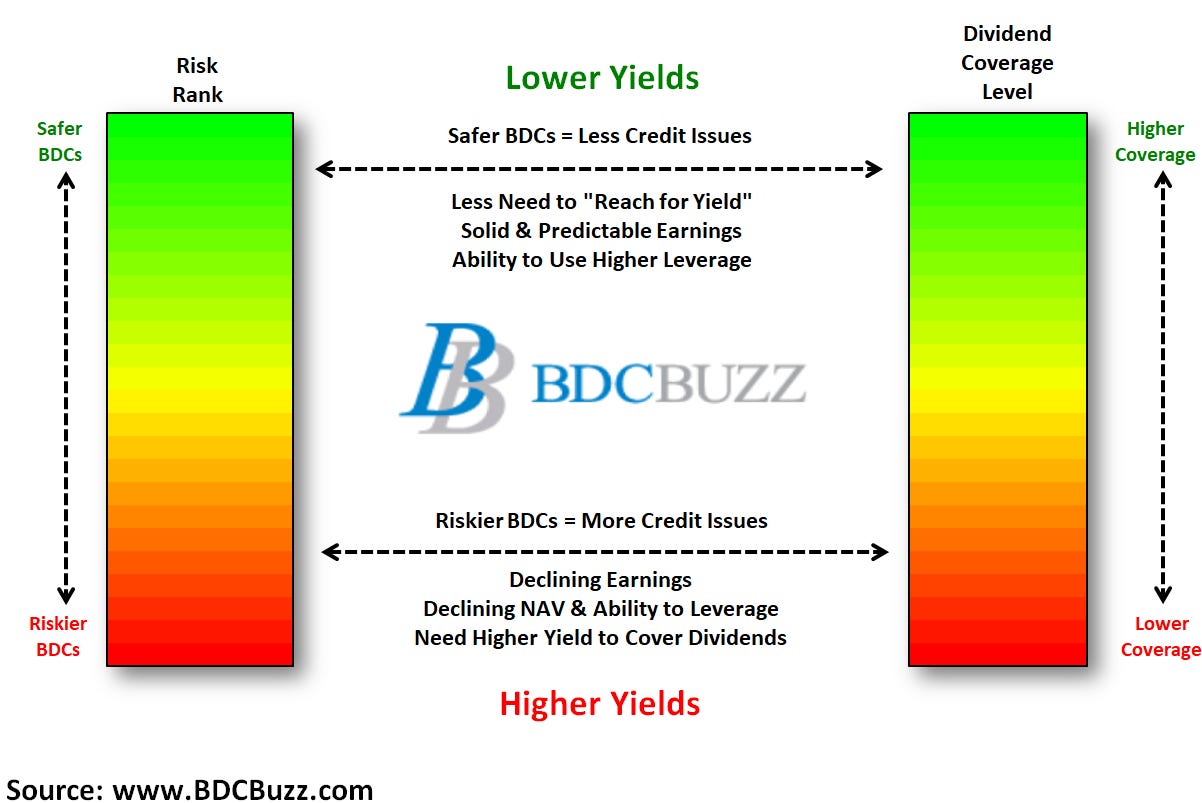
Golub Capital is considered a lower risk BDC for many reasons including its higher credit quality portfolio of mostly lower yield first-lien and one-stop loans with strong covenant and security protections in mostly non-cyclical sectors. Also, the portfolio is well diversified with very low concentration risk and with an average investment size of less than 0.4% of the portfolio and the top 10 accounting for around 16%.

Source: GBDC Earnings Presentation
GBDC Conservative Management and Fee Structure
It should be noted that GBDC is for lower yield investors with conservative management, lower yield portfolio investments, and investor-friendly fee structure including a base management fee of 1.375% of average adjusted gross assets (compared to 1.50% to 2.00%, for most) excluding cash and cash equivalents. GBDC’s fee structure includes a “total return hurdle” which means that its incentive fee structure protects total returns to shareholders by taking into account capital losses when calculating the income portion of the fee. Also, incentive fees are only paid after the hurdle rate is reached, requiring a minimum return on net assets of 8% annually. However, GBDC currently is below the 8% hurdle so management was not paid an incentive fee for the quarter ended June 30, 2021, as discussed later.
During the early stages of the COVID crisis, management took various measures to strengthen the balance sheet including a ‘rights offering’ as well as reducing the quarterly dividend from $0.33 to $0.29 per share. As shown in the previous chart 100% of GBDC’s loans are at floating rates which were impacted as the Fed reduced rates.
To be completely honest I think the rights offering was not needed as GBDC already had relatively lower leverage/stronger asset coverage coupled with higher quality assets (to support higher leverage). However, management was likely just taking a conservative approach not knowing the full extent of the impacts of the pandemic on its portfolio companies which might need additional capital drawing on the unfunded commitments which was a large concern at the time.

Source: GBDC Earnings Presentation
On May 14, 2020, GBDC announced the final results of its transferable rights offering, which entitled holders of rights to purchase one share of common stock for every right held at a subscription price of $9.17 per share.

Source: GBDC Announcement
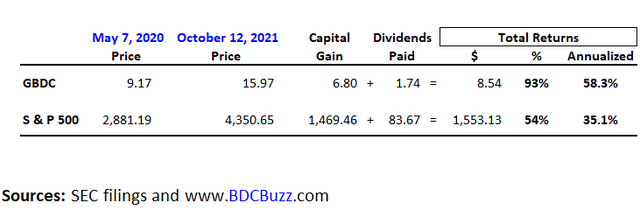
Along with most of my subscribers, I took full advantage of the offering easily outperforming the S&P 500 over the last 17 months:
Operating Cost as a Percentage of Available Income
As a part of assessing BDCs, it’s important to take into account expense ratios. BDCs with lower operating expenses can pay higher amounts to shareholders without investing in riskier assets.
“Operating Cost as a Percentage of Available Income” is one of the many measures that I use which takes into account operating, management, and incentive fees compared to available income.
- “Available Income” is total income less interest expense from borrowings and is the amount of income that is available to pay operating expenses and shareholder distributions.
Many BDCs have been temporarily waiving fees or have fee agreements that take into account previous capital losses that are ending this year. The following table shows the average adjusted operating cost ratios for each BDC over the last four quarters without the benefit of temporary fee waivers with examples for GBDC and PSEC.

GBDC Dividend Coverage
I’m expecting improved dividend coverage for GBDC over the coming quarters for many reasons including portfolio growth through increased leverage, lower borrowing rates, and improved net interest margins, as well as recent/continued increases in its net asset value (“NAV”) per share.
The following table shows the “pre-incentive fee net investment income” per share before management earns income incentive fees based on “net assets.” GBDC will likely earn around $0.30 per share each quarter before paying management incentive fees which is “math” driven by an annual hurdle rate of 8% on equity. It’s important to note that the calculation is based on the net asset values from the previous quarter.

As mentioned earlier, GBDC is currently below the 8% hurdle so management was not paid an incentive fee for the quarter ended June 30, 2021. As you can see in the following table, GBDC’s earnings/NII per share has been improving even with similar amounts of total income mostly due to lower incentive fees paid to management as NAV continues to increase as discussed later in this report.

GBDC Leverage and Portfolio Growth
BDCs with higher quality portfolios can support higher leverage. Around 96% of GBDC’s portfolio is bank-like quality debt positions at much lower yields than typical BDCs:

Source: SEC Filing
The following table shows each BDC ranked by its debt-to-equity ratio net of cash along with its portfolio mix. The “Other” column includes everything that is NOT first or second-lien secured debt. I typically do not cover most of the higher-risk BDCs for many reasons but mostly because these are NOT typically buy-and-hold investments. PTMN, FSK, FCRD, PSEC, and OXSQ have higher risk portfolios due to higher amounts of non-secured debt, joint ventures, senior loan programs, CLOs, and/or equity positions that all carry much higher external leverage.
Many of the BDCs with lower leverage also have lower dividend coverage over the last four quarters including GBDC. I’m expecting improved dividend coverage for many BDCs as leverage increases as well as higher amounts of first-lien positions (to support higher leverage).

Management is expecting higher portfolio growth over the coming quarters partially due to lower amounts of prepayments:
Q. “I know you guys were just slightly below the low end of your hurdle rate this quarter and therefore, did not earn the incentive fee. I’m just curious, are you OK with, I guess, operating around that area kind of right at or even below the low end of your hurdle, or would you – is the goal to essentially generate an ROE that’s maybe above that 8%. I’m just trying to get your thoughts around the hurdle rate.”
A. “I think this quarter was a bit of an anomaly because the degree of repayments was as high as it was. My expectation is that we’re going to see growth in the size of the portfolio that in turn will grow net investment income and will give us more pre-incentive fee net investment income. I think when we look backwards, we’ll see this quarter as a bit of an anomaly in the respect that you’re mentioning. I think it’s good for shareholders, if we can operate in or above the catch-up as opposed to below the catch-up, provided we can do so without taking too much credit risk.”
“Let’s look together at page 12 of the presentation and the second line in the table, exits and sales of investments. And you can see that the June 30, 2021 quarter at $583.5 million is the outlier on this chart. It’s literally more than twice the December 31 quarter, 1.5 times the March 31 quarter. So, if you ask me to make a prediction, my prediction is that we will not see a sustained level of exits and sales of investments at the June 30th level. Over time, in my experience, our assets tend to have a weighted average life between 2.5 and 3 years. The $583.5 is effectively a weighted average life that’s closer to 2. I think we’re going to be able to continue to make good progress on originations. I think exits and sales will moderate, and we’ll start seeing some portfolio growth.”
Source: GBDC Earnings Call

Source: GBDC Earnings Presentation
Reading The Tea Leaves
On Oct. 7, 2021, GBDC priced $200 million of notes due 2026 (YTM of 2.667%) and $100 million of notes due 2024 (YTM of 1.809%). These are excellent fixed rates for flexible unsecured borrowings due 2026 and 2024.
It’s important to note that GBDC has not announced the note offering on its website and there was no press release as of the writing of this article and this information was only available through the associated SEC filings which included:
As of October 4, 2021, we had approximately $2.6 billion of debt outstanding, approximately $1.2 billion of which was unsecured senior indebtedness (represented by the 2024 Notes, the Existing Notes, and the 2027 Notes) that will rank equal to the Notes, approximately $954.7 million of which was indebtedness secured by substantially all of the assets of our subsidiaries and that will be structurally senior to the Notes, and approximately $472.1 million of which was indebtedness secured by substantially all of our assets and that will be effectively senior to the Notes. As of October 4, 2021, we had no amounts outstanding under the debentures of the SBIC Fund, or the SBA Debentures.”
Source: SEC Filing
This information is important as is it implies that GBDC had an active calendar Q3 2021 with plenty of portfolio growth that I have taken into account with the updated financial projections. As shown in the table below, GBDC had $2.1 billion in debt outstanding and $154 million in cash (as of June 30, 2021) which is above the average cash balance of around $30 million for the previous quarters. This implies that GBDC had portfolio growth of around 10% or $400 million to $500 million which would be its largest quarter of net originations (after taking into account repayments) but of course we do not have the amount of cash available and other items that could temporarily impact the amount debt. However, there’s a very good chance that GBDC had an excellent quarter with significant portfolio growth for improved earnings over the coming quarters.

As shown in the table below, $2.6 billion in debt would be meaningfully higher than previous quarters:

Why Is This Information Important?
Great question and the easy answer is “a meaningful improvement in dividend coverage” over the next two quarters. How meaningful? This is where you need to do your own due diligence to assess the impacts on dividend coverage. Obviously, you’re busy and maybe do not have time to put together a financial projection which is why many people use various research services that cover BDCs which can be difficult to find. Especially services focused on BDCs as they are very different from other income-oriented investments.
First of all, you need a service that will keep you up to date on information contained in the SEC filings as well as when BDCs start to report results which is starting next week. Please make sure that your service provides detailed financial projections for each of the BDCs that you plan to invest in because historical coverage is not a good indicator of upcoming coverage. For each BDC I use a “Base” case projection along with “Best” and “Worst” cases over the next three quarters. I find that going out much further than three quarters is pointless as BDC balance sheets change constantly adapting for upcoming economic conditions.
I typically do not provide financial projections in public articles but below is a quick example of the ‘base case’ projections for GBDC taking into account the previously discussed information as well as the rest of the information provided in this article including changes to borrowing rates, net interest margin, and management fee agreement.
Again, historical dividend coverage is not a good indicator of upcoming coverage for many reasons including access to growth capital and temporary fee waivers (discussed earlier) so please make sure that you’re getting this information before investing in BDCs.

GBDC Improved Net Interest Margin
Similar to all BDCs, management is working to reduce borrowing rates including the recently issued notes and lower-cost credit facilities. On Aug. 3, 2021, GBDC issued $350 million of unsecured notes at 2.050% (yield-to-maturity of 2.274%) due in 2027 using a portion of the proceeds to redeem $189 million of notes with a weighted average interest rate of 3-month LIBOR + 2.44%. This is an excellent fixed rate for flexible unsecured borrowings due 2027. In April 2021, the company amended its revolving credit facility with Morgan Stanley reducing the interest rate on borrowings to 1-month LIBOR + 2.05% from 1-month LIBOR + 2.45%.

Source: GBDC Earnings Presentation
On August 3rd, we issued $350 million of unsecured notes, which bear a fixed interest rate of 2.05% and mature on February 15, 2027, bringing unsecured debt up to approximately 50% of GBDC’s total funding mix. The $350 million issuance of new unsecured notes mature in February 2027 and have a fixed interest rate of 2.05%, the lowest coupon ever achieved by a BDC at the time.”
Source: GBDC Earnings Call

Source: GBDC Earnings Presentation
As shown in the following chart, the net interest margin (green line) increased to 5.1% due to the continued decline in the weighted average cost of borrowings.
This graph summarizes portfolio yields and net investment spreads for the quarter, focusing first on the light blue line. This line represents the income yield or the actual amount earned on our investments, including interest and fee income, but excluding the amortization of upfront origination fees and the GCIC purchase price premium. The income yield decreased by 10 basis points to 7.4% for the quarter ended June 30, 2021. The investment income yield or the dark blue line, which includes the amortization of fees and discounts, also decreased by 10 basis points to 7.9% during the quarter. Our weighted average cost of debt, or the aqua blue line, decreased by 20 basis points to 2.8%, primarily due to the early redemption of $165 million in higher-priced SBIC debentures in the prior quarter. Our net investment spread, the green line, which is the difference between the investment income yield and the weighted average cost of debt, increased by 10 basis points to 5.1%.”
Source: GBDC Earnings Call

Source: GBDC Earnings Presentation
What Can I Expect Each Week With a Paid Subscription?
Each week we provide a balance between easy to digest general information to make timely trading decisions supported by the detail in the Deep Dive Projection reports (for each BDC) for subscribers that are building larger BDC portfolios.
- Monday Morning Update – Before the markets open each Monday morning we provide quick updates for the sector including significant events for each BDC along with upcoming earnings, reporting, and ex-dividend dates. Also, we provide a list of the best-priced opportunities along with oversold/overbought conditions, and what to look for in the coming week.
- Deep Dive Projection Reports – Detailed reports on at least two BDCs each week prioritized by focusing on ‘buying opportunities’ as well as potential issues such as changes in portfolio credit quality and/or dividend coverage (usually related). This should help subscribers put together a shopping list ready for the next general market pullback.
- Friday Comparison or Baby Bond Reports – A series of updates comparing expense/return ratios, leverage, Baby Bonds, portfolio mix, with discussions of impacts to dividend coverage and risk.
![]()
This information was previously made available to subscribers of Premium BDC Reports. BDCs trade within a wide range of multiples driving higher and lower yields mostly related to portfolio credit quality and dividend coverage potential (not necessarily historical coverage). This means investors need to do their due diligence before buying.