The following information was previously provided to subscribers of Premium BDC Reports along with:
- OCSL target prices/buying points
- OCSL risk profile, potential credit issues, and overall rankings
- OCSL dividend coverage projections (base, best, worst-case scenarios)
![]()
Oaktree Specialty Lending (OCSL) – Quick History
- On October 17, 2017, Oaktree Capital (OAK) took over management from Fifth Street Asset Management as the investment advisor to OCSL formerly known as Fifth Street Finance (FSC), and OCSI, previously known as Fifth Street Senior Floating Rate (FSFR).
- On November 29, 2017, OCSL announced calendar Q3 2017 results including a 14% decline in net asset value (“NAV”) per share (from $7.17 to $6.16).
- On February 8, 2018, OCSL announced a 32% decrease in the quarterly dividend (from $0.125 to $0.085).
- Over the last ~3.5 years, NAV has increased back to $7.22 and the quarterly dividend is $0.145.

OCSL Dividend Coverage Update
As discussed in the public article “Still Waiting For a Dividend Increase From Oaktree,” I have been expecting OCSL to increase its dividend for a while. The article came out in 2019 and management finally started increasing the dividend in 2020. This was also discussed earlier this year in Growing Dividends During A Pandemic: OCSL.
It should be noted that over the last 14 quarters OCSL has covered the dividend by an average of 127%. This means that management was purposely over-earning the dividend (underpaying the shareholders) which was responsible for around $0.40 per share of NAV growth/reflation.

In March 2021, OCSL closed its merger with Oaktree Strategic Income (OCSI). In connection with the merger agreement, Oaktree has agreed to waive $750,000 of base management fees payable in each of the eight quarters following the closing.
For the quarter ended June 30, 2021, OCSL easily covering its quarterly dividend by 144% due to higher prepayment fees and accelerated OID mostly from William Morris Endeavor:
Adjusted net investment income per share was $0.19, up from $0.14 for the prior quarter, driven by higher adjusted investment income that included higher prepayment fees and OID acceleration. We received $171 million from paydown and exits in the quarter. This included our position in William Morris Endeavor, which generated $7 million of prepayment income that contributed to earnings.”
Source: Q3 2021 Results – Earnings Call Transcript (Emphasis Added by Author)

I am expecting continued improvement in OCSL’s earnings over the coming quarters through the use of higher leverage (portfolio growth), continued rotation into higher yield investments, accretive impacts from the merger including fee waivers as well as higher returns from its Kemper and Glick joint ventures.
We remain focused on positioning the portfolio for an improved yield by rotating out of lower-yielding investments and into higher-yielding proprietary loans. We made good progress on this in the third quarter, exiting $39 million of these types of investments. As of quarter end, $142 million of senior secured loans priced at or below LIBOR plus 4.5% remained in the portfolio, including approximately $67 million of loans that we acquired in the OCSI merger. Our new investments during the quarter came in at attractive yields which means there is significant improvement in yield on that portion of the portfolio that can be realized over time. We exited some low-yielding investments and made further progress on exiting noncore investments, monetizing $19 million across 3 equity positions. Noncore investments represented just 6% of the portfolio at fair value at quarter end. The weighted average yield on our new debt investment commitments was an attractive 9.2% and compares favorably to the average yield of 6.1% on investments that we exited.”
Source: Q3 2021 Results – Earnings Call Transcript (Emphasis Added by Author)

Source: Q3 2021 Results – Earnings Presentation
We also have the opportunity to further optimize both of our joint ventures. We can accomplish this by selectively rotating out of lower-yielding investments into higher-yielding ones as well as increasing leverage at the JVs. We made good progress on this front in the quarter, growing the JV portfolios by $36 million. The Kemper JV had $387 million of assets invested in senior secured loans to 57 companies. This compared to $352 million of total assets invested in 55 company’s last quarter. Leverage at the JV was 1.4x at quarter end, up slightly from 1.3x in the March quarter. Given the strong balance sheet and earnings power at the Kemper JV, OCSL received a $450,000 dividend this quarter. We anticipate we will receive a dividend in this amount going forward. The Glick JV had $148 million of assets at June 30. These consisted of senior secured loans to 38 companies. Leverage at the JV was 1.1x at quarter end. OCSL subordinated note in the Glick joint venture totaling $55 million continues to be current. We expect to receive ongoing coupon interest and principal repayments of approximately $1.3 million per quarter on a run rate basis going forward.”
Source: Q3 2021 Results – Earnings Call Transcript (Emphasis Added y Author)

Source: Q3 2021 Results – Earnings Presentation
On May 11, 2021, OCSL announced that it had priced $350 million of 2.700% of unsecured notes due January 15, 2027, taken into account with my updated projections. OCSL had growth capital available given its historically low leverage with a debt-to-equity ratio of 0.79 (net of cash) as of June 30, 2021.
Another opportunity for us to increase ROE is by deploying more leverage at the portfolio level. As of June 30, our net leverage was below the low end of our long-term target of 0.85 to 1.00. We would expect to continue to enhance returns as we make incremental investments and deploy higher leverage.”
Source: Q3 2021 Results – Earnings Call Transcript (Emphasis Added by Author)
On August 5, 2021, OCSL announced a $0.145 per share for Q3 2021, up 11.5% from the prior quarter paid on September 30, 2021, to stockholders of record on September 15, 2021.
Armen Panossian, CEO and CIO: “The third quarter was highlighted by strong earnings and continued robust portfolio performance. Adjusted net investment income was $0.19 per share, up 58% from the same quarter a year earlier. This reflected new origination activity at attractive yields over the prior year and the successful exit of one of our opportunistic investments made in the wake of the pandemic. NAV grew again this quarter to $7.22 per share, a 1.8% increase from March 31, 2021, as the portfolio continues to perform well and our credit quality remains excellent.”
Source: Q3 2021 Results – Earnings Call Transcript
Summary
As mentioned earlier, OCSL’s earnings will continue to improve through the use of higher leverage, continued rotation into higher yield investments, accretive impacts from the merger including fee waivers as well as higher returns from its joint ventures. Even after taking into account the recent increase in the regular quarterly dividend from $0.130 to $0.145 per share, OCSL is still paying less dividends as a % of NAV (equity/book value) than the average BDC. The average BDC pays around 9.3% of NAV per share in distributions each year which would be around $0.168 per share per quarter for OCSL (using the current NAV of $7.22). I am currently projecting additional dividend increases to $0.16 per quarter or $0.64 annually which would imply a dividend yield of 8.8% based on the current price of $7.24 (as of August 26, 2021).
As shown in the following table, OCSL has lower leverage (debt-to-equity) combined with higher dividend coverage over the last four quarters. I have not included the dividend coverage averages for FCRD and PTMN because I do not cover these BDCs due to having higher risk portfolios and they are thinly traded. I cover NEWT but it has a very different business model as discussed in “Newtek Business Services: Initiating Coverage“.
AINV, MRCC, and FSK have recently had higher dividend coverage only due to not paying incentive fees related to previous capital losses. Dividend coverage will decline once these companies start paying incentive fees. Also, BDCs such as SUNS with lower leverage have access to growth capital to improve dividend coverage and are likely just taking a cautious approach to rebuild their portfolios during the economic recovery.

What Can I Expect Each Week With a Paid Subscription?
Each week we provide a balance between easy to digest general information to make timely trading decisions supported by the detail in the Deep Dive Projection reports (for each BDC) for subscribers that are building larger BDC portfolios.
- Monday Morning Update – Before the markets open each Monday morning we provide quick updates for the sector including significant events for each BDC along with upcoming earnings, reporting, and ex-dividend dates. Also, we provide a list of the best-priced opportunities along with oversold/overbought conditions, and what to look for in the coming week.
- Deep Dive Projection Reports – Detailed reports on at least two BDCs each week prioritized by focusing on ‘buying opportunities’ as well as potential issues such as changes in portfolio credit quality and/or dividend coverage (usually related). This should help subscribers put together a shopping list ready for the next general market pullback.
- Friday Comparison or Baby Bond Reports – A series of updates comparing expense/return ratios, leverage, Baby Bonds, portfolio mix, with discussions of impacts to dividend coverage and risk.
![]()
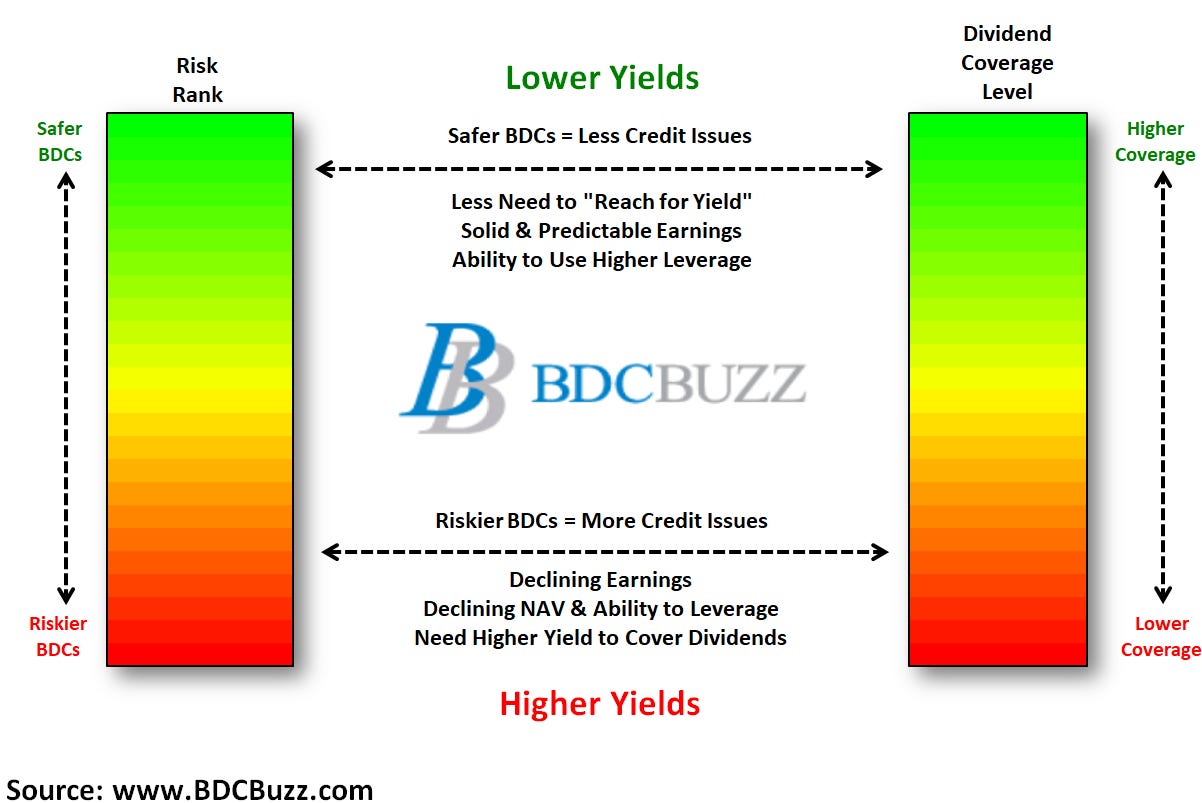
This information was previously made available to subscribers of Premium BDC Reports. BDCs trade within a wide range of multiples driving higher and lower yields mostly related to portfolio credit quality and dividend coverage potential (not necessarily historical coverage). This means investors need to do their due diligence before buying.