The following information was previously provided to subscribers of Premium BDC Reports along with:
- FSK target prices/buying points
- FSK risk profile, potential credit issues, and overall rankings. Please see BDC Risk Profiles for additional details.
- FSK dividend coverage projections (base, best, worst-case scenarios). Please see BDC Dividend Coverage Levels for additional details.
![]()
This update discusses FS KKR Capital (FSK) which I have not written much about recently as I typically try to cover BDCs with increasing dividends supported by a history of strong credit performance. FSK does not fit this category which is why I sold my very small position in 2018 when it was trading under the symbol FSIC for the reasons discussed in “Why I Sold This 11.1% Yielding BDC“. It should be noted that FSK continues to seriously underperform the average BDC, especially over the last 18 months as shown in the total return table in a previous public article “BDCs Vs. REITs: Comparing Returns For Higher-Yield Investors” even after taking into account this current environment that I would consider to be “risk-on” where higher risk BDCs such as FSK, PSEC, BKCC, PTMN, PFX, FCRD, LRFC, CCAP, and AINV do well. I typically do not cover these BDCs as they are the first to drop during volatility due to higher-risk portfolios that would likely not perform well during a recessionary environment.
FSK Advisory Fee Agreement
I’m not going to cover the entire history of portfolio mergers (FSIC, CCT, FSK, FSKR) that have created the current company but they have all had their share of credit issues often invested in the same or similar assets. Obviously, these are now referred to as ‘legacy assets’ and current management is working through them.
Dan Pietrzak, Chief Investment Officer and Co-President of FSK, said, “The combination creates a premier BDC lending franchise with approximately $15 billion in assets. With our portfolio diversification, enhanced access to capital markets, and over $3 billion of available investment capacity, we believe we are well-positioned as a leading lender to upper middle market borrowers.”
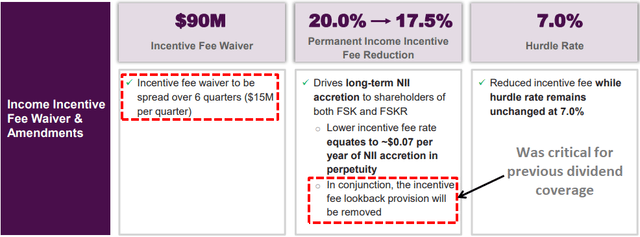
Historically, FSK has covered its dividend only due to no incentive fees paid driven by the ‘total return hurdle’ from previous realized/unrealized losses. However, the total return hurdle or ‘look back’ provision was removed as a part of the latest merger agreement between FSK and FSKR.
Instead, FS/KKR has agreed to waive $90 million of incentive fees spread evenly over the first six quarters following the closing. This waiver equates to $15 million per quarter. It is important to note that the company would have paid almost $90 million in incentive fees over the previous five quarters without the look-back provision which is almost $18 million per quarter. However, that is based on 20.0% income incentive fees compared to 17.5% but also only for FSK. The merger doubled the size of the company with similar holdings and credit issues implying that the $15 million per quarter could be insufficient if there are continued/additional credit issues. Please keep in mind that FSKR’s NAV per share declined by almost 30% over the last three years.
Source: FSK Investor Presentation
It is important to note that if there are additional rounds of credit issues shareholders will not be protected leaving management to earn full incentive fees even during periods when the BDC/management under-performs. The fee waivers are temporary but this change is permanent which is one of the reasons that this BDC trades at a discount relative to most.
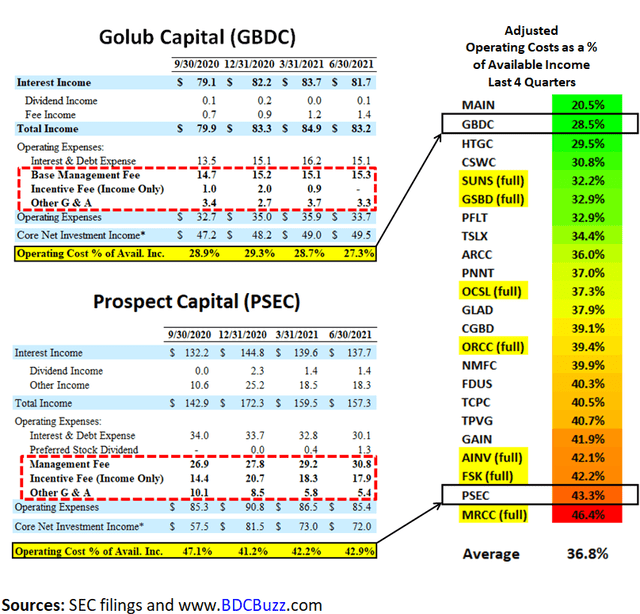
Operating Cost as a Percentage of Available Income
As a part of assessing BDCs, it’s important to take into account expense ratios. BDCs with lower operating expenses can pay higher amounts to shareholders without investing in riskier assets.
“Operating Cost as a Percentage of Available Income” is one of the many measures that I use which takes into account operating, management, and incentive fees compared to available income.
- “Available Income” is total income less interest expense from borrowings and is the amount of income that is available to pay operating expenses and shareholder distributions.
As discussed earlier this month in “Conservative Portfolio Safely Paying Investors 7.3%“, many BDCs have been temporarily waiving fees or have fee agreements that take into account previous capital losses that are ending this year. The following table shows the average adjusted operating cost ratios for each BDC over the last four quarters without the benefit of temporary fee waivers with examples for GBDC and PSEC. It should be noted that the ratio for FSK is based on the previous fee agreement.
Portfolio Credit Quality (Quick Update)
My primary concern for FSK is the higher amount of cyclical exposure including retail, capital goods, real estate, energy, and commodities that account for around 25% of the total portfolio. The portion of the portfolio that was originated under the FS management is of particular concern. It also has many of the same exposures in its SCJV which is almost 10% of the portfolio. There is a good chance that many of FSK’s equity positions in these sectors have been benefiting from the recent recovery that could reverse at some point.
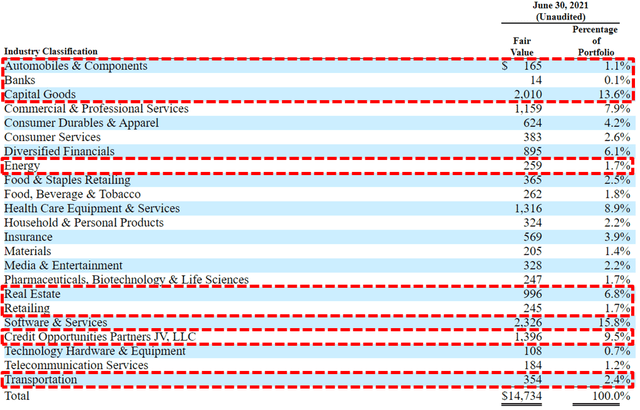
Source: SEC Filing
Also, many of the companies in FSK’s portfolio are more likely to be impacted by supply chain issues as well as “inflationary pressures” and rising input costs especially labor. On the August 2021 earnings call management mentioned that it views these issues as “transitory” and “supply chain disruptions to be resolved over the ensuing quarters”:
The Fed’s comments in July regarding their belief of the transitory nature of many of the inflationary pressures currently affecting certain industries dovetails with our own views, as we expect many issues caused by COVID-related supply chain disruptions to be resolved over the ensuing quarters.”
Source: FSK Earnings Call
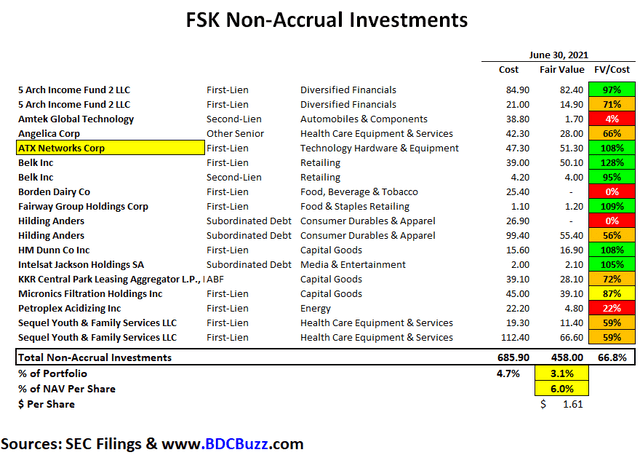
During Q2 2021, FSK placed its first-lien loan from ATX Networks on non-accrual status but will likely be back on accrual during Q3 2021 and is taken into account with the updated projections. It should be noted that this investment was marked 8% over cost as of June 30, 2021, as shown in the following table.
During the second quarter, we placed one investment on non-accrual, ATX Networks. ATX design radio frequency, optical and other video networking equipment used primarily by cable operators. The company’s earnings have been negatively impacted by lower cable company capex spend. We owned $80 million of the $227 million first lien term loan marked at 64% of cost as of June 30, down from 69% of cost as of March 31. The company, a group of first lien lenders holding more than two-thirds of the first lien term loan, and other parties in the capital structure have made significant progress on a resolution of ATX’s breach of its Q1 financial covenant, and we expect the transaction resolving such breach to close in the third quarter. The anticipated impact of this potential transaction has been factored into the Q2 mark.”
Source: FSK Earnings Call
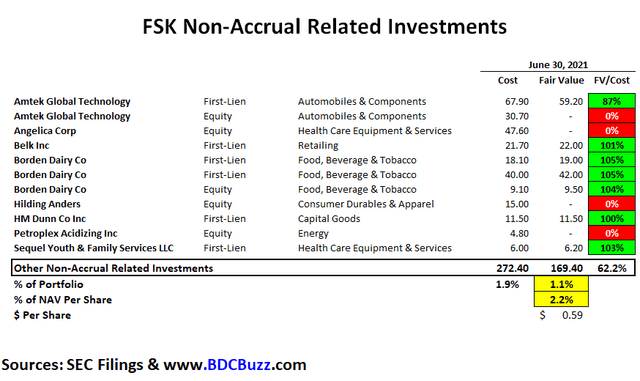
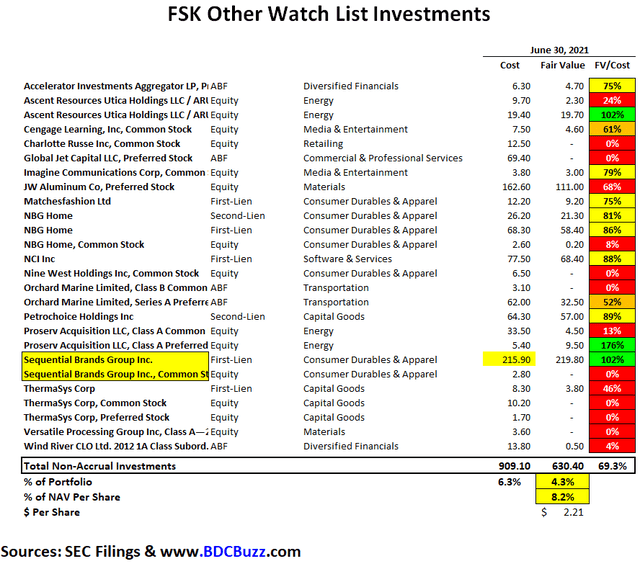
Total non-accruals currently account for around 4.7% of the portfolio at cost and 3.1% of the portfolio fair value but do not take into account the additional investments FSK has with these companies that account for another 1.9% of the portfolio at cost and 1.1% of the fair value. Also, there are quite a few investments that remain on its ‘watch list’ including Sequential Brands Group which filed for bankruptcy on August 31, 2021. However, there is a good chance that there will be minimal impact to NAV per share for the upcoming reported quarter but will likely impact earnings.
The Company determined that, as a result of the significant debt on its corporate balance sheet, it was no longer able to operate its portfolio of brands. Accordingly, in conjunction with the filing, the Company will pursue the sale of all or substantially all of its assets under Section 363 of the U.S. Bankruptcy Code. In connection with this in-court process, Sequential will be obtaining $150 million in debtor-in-possession (“DIP”) financing from its existing Term B Lenders. The Company expects this new financing, together with cash generated from ongoing operations, to provide ample liquidity to support its operations during the sale process.”
Source: FSK Earnings Call
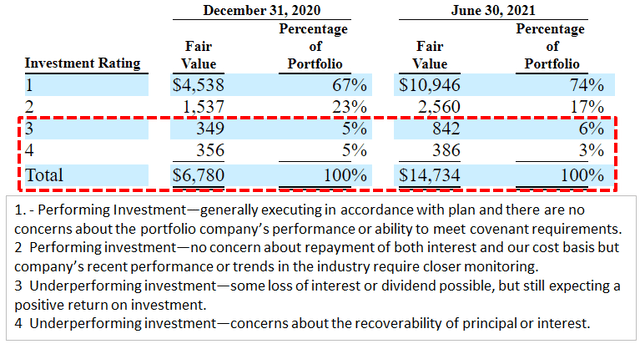
As shown in the following tables, the total amount of investments considered non-accrual or related as well as on the ‘watch list’ account for almost $1.3 billion or 8.5% of the portfolio fair value. This is close to the amount of investments that the company has identified with its ‘Investment Rating’ 3 and 4 which are considered “underperforming investments” with “some loss of interest or dividend possible” and/or “concerns about the recoverability of principal or interest”. It should be noted that these investments have a total cost basis of almost $1.9 billion or 13% of the total portfolio and could result in additional realized losses over the coming quarters. Also, if additional watch list investments are added to non-accruals status this would likely drive additional declines in NAV per share, earnings, and dividend coverage.
Please make sure that if you are subscribed to a service that provides you with BDC target prices they should also be providing the following level of portfolio detail as well as financial dividend coverage projections over the next three quarters as discussed in recent articles.
Source: SEC Filings
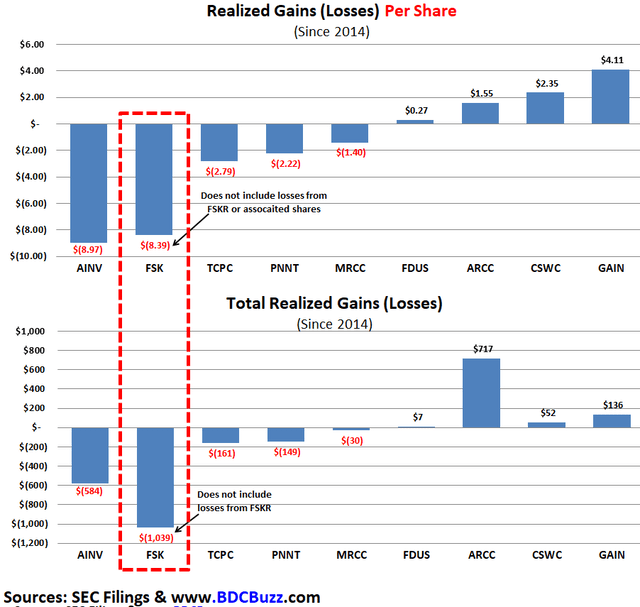
Comparison of Realized Gains/Losses
Gains or losses are said to be “realized” when an investment is actually sold or exited as compared to “unrealized” gains and losses due to an increase or decrease in the value of an investment that has not yet been sold. When a BDC incurs realized losses there is generally no way to reverse these losses but can potentially be offset by positive performance from other investments and/or over-earning the dividend.
Since 2014, FSK has experienced over $1 billion in realized losses which does not include in the realized losses from FSKR. This is more than almost every other BDC even when measured on a per-share basis as shown below. These losses were due to lower portfolio credit quality and the primary driver of NAV per share declines and two dividend cuts. It should be noted that FSK still has a meaningful portion of its portfolio in cyclical sectors and/or companies that are more likely to be impacted by supply chain issues as well as rising input costs especially labor. Many of these investments have been discussed in previous reports and some are discussed later
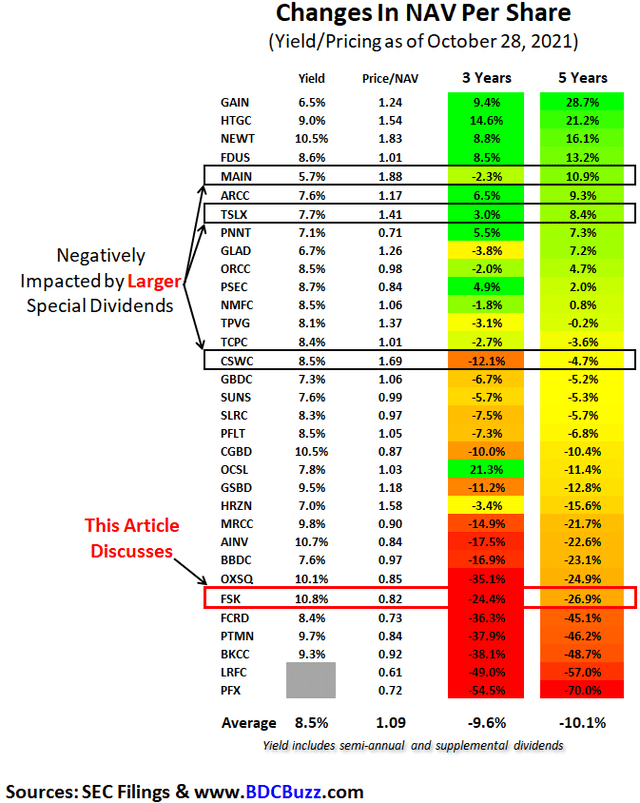
Changes in NAV Per Share
The following table shows the changes in NAV per share through June 30, 2021, as only a handful of BDCs have reported September 30, 2021, results as discussed later. Also, I am using a projected $0.60 per share of quarterly dividends for FSK compared to most services using $0.65 per share as discussed in the next section of this article.
FSK Dividend Discussion
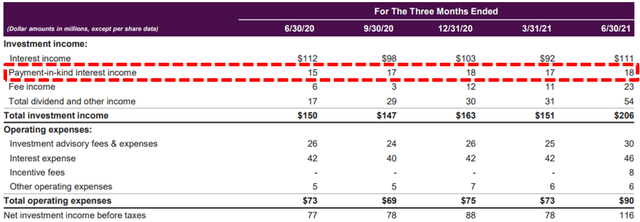
There are many factors to take into account when assessing dividend coverage for BDCs including portfolio credit quality, realized losses, fee structures including ‘total return hurdles’ taking into account capital losses, changes to portfolio yields, borrowing rates, the amount of non-recurring and non-cash income including payment-in-kind (“PIK”). Most BDCs have around 2% to 8% PIK income and I start to pay close attention once it is over ~5% of interest income. Higher amounts of PIK is typically a sign that portfolio companies are not able to pay interest expense in cash and could imply potential credit issues over the coming quarters.
The amount of PIK interest income declined but still accounts for almost 14.0% of total interest income compared to 15.6% during Q1 2021. There is a chance that FSK could be downgraded over the coming quarters if there is another round of credit issues driving additional realized losses and higher PIK similar to previous quarters and responsible for dividend reductions.
Source: FSK Investor Presentation
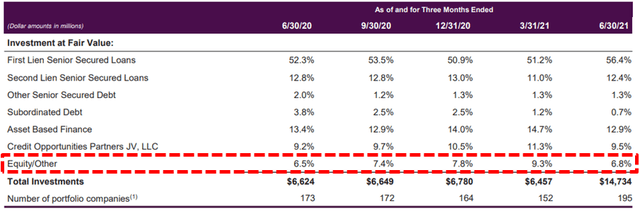
Management continues to reduce the amount of non-income producing equity investments from 9.3% to 6.8% partially related to the recent merger with FSKR. Investors are hoping that management can continue to produce higher earnings with the current portfolio before the fee waivers roll-off which could include a larger portion invested in the SCJV shown as “Credit Opportunities Partners JV” in the following table:
Source: FSK Investor Presentation
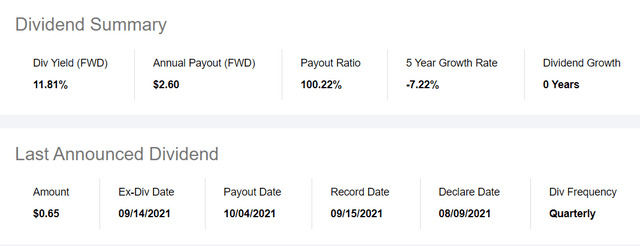
On August 9, 2021, FSK declared a quarterly dividend of $0.65 for Q3 2021 which is an increase from the previous $0.60 due to higher-than-expected earnings for Q2 2021. Management has adopted a ‘variable dividend policy’ based on the NAV per share and expected earnings:
Consistent with our variable dividend policy of seeking to provide shareholders with an annualized 9% dividend yield on our NAV over time, we are committed to paying out additional levels of NII during quarters where our portfolio generates additional income. As a result, during the third quarter our dividend will be $0.65.”
Source: FSK Earnings Call
However, as discussed by management on the recent call, investors should expect $0.60 of quarterly dividends for the following quarters;
From a forward-looking dividend perspective, our third quarter dividend will be $0.65 per share, with the increase in this quarter’s dividend being tied directly to the additional net investment income we generated during the second quarter. All else being equal, given that we expect our third quarter adjusted NII to approximate $0.61 per share, we believe it is reasonable for investors to expect that should we achieve our adjusted NII guidance for the third quarter, that our fourth quarter dividend would be $0.60 per share; however, I should note that dividends are subject to the discretion of our board and applicable legal requirements, and this forward guidance, while intended to be helpful to investors, should not be interpreted as a formal dividend announcement.”
“Looking forward to the third quarter, while we expect our one-time fee and dividend income to return to a normalized level, we expect our adjusted NII to be $0.61 per share. Our recurring interest income on a GAAP basis is expected to approximate $275 million. We expect recurring dividend income associated with our joint venture to approximate $44 million. We expect other fee and dividend income to approximate $33 million during the third quarter.”
Source: FSK Earnings Call
The following information is from the Seeking Alpha website showing the current yield for FSK at 11.8% which is assuming $2.60 in annual dividends or $0.65 per quarter:
Source: Seeking Alpha
FSK announces dividends when it reports financial results in the second week of November and there will likely be investors disappointed with the lower dividend payment and could impact its stock price. It should be noted that one of the better analysts for the stock recently ‘adjusted’ the price target from $22.00 to $19.00 with an underweight rating last week. There is a chance that they are pricing in additional dividend decreases.
Source: Seeking Alpha
Summary & Q3 2021 BDC Earnings Season
I completely understand the lure of higher yields and trading below NAV but this is more like rolling the dice and hoping for a turnaround with credit quality and performance. If management truly believed this was the most likely scenario why did they remove the total return hurdle from the incentive fee agreement? That is called having “skin in the game” and aligning management and shareholder interests. I own many BDCs without total return hurdles but with much higher historical credit performance as well as management consistently doing the right thing often waiving fees during extraordinary circumstances. To be honest there are so many higher quality BDCs that I have covered over the last few months in previous articles why roll the dice on FSK when management is NOT willing to do the same?
One of the best times to purchase these stocks is just after they report results before other investors have a chance to digest the information. Many investors simply look at earnings or changes in NAV which does not tell the full story. BDCs have begun reporting calendar Q3 2021 results and investors should be ready to make changes to their portfolios.
Again, FSK will likely be announcing a lower dividend next week and there are likely some investors that will see it as a dividend cut especially given that many sites are currently using the $0.65 per share annualized.
What Can I Expect Each Week With a Paid Subscription?
Each week we provide a balance between easy to digest general information to make timely trading decisions supported by the detail in the Deep Dive Projection reports (for each BDC) for subscribers that are building larger BDC portfolios.
- Monday Morning Update – Before the markets open each Monday morning we provide quick updates for the sector including significant events for each BDC along with upcoming earnings, reporting, and ex-dividend dates. Also, we provide a list of the best-priced opportunities along with oversold/overbought conditions, and what to look for in the coming week.
- Deep Dive Projection Reports – Detailed reports on at least two BDCs each week prioritized by focusing on ‘buying opportunities’ as well as potential issues such as changes in portfolio credit quality and/or dividend coverage (usually related). This should help subscribers put together a shopping list ready for the next general market pullback.
- Friday Comparison or Baby Bond Reports – A series of updates comparing expense/return ratios, leverage, Baby Bonds, portfolio mix, with discussions of impacts to dividend coverage and risk.
![]()
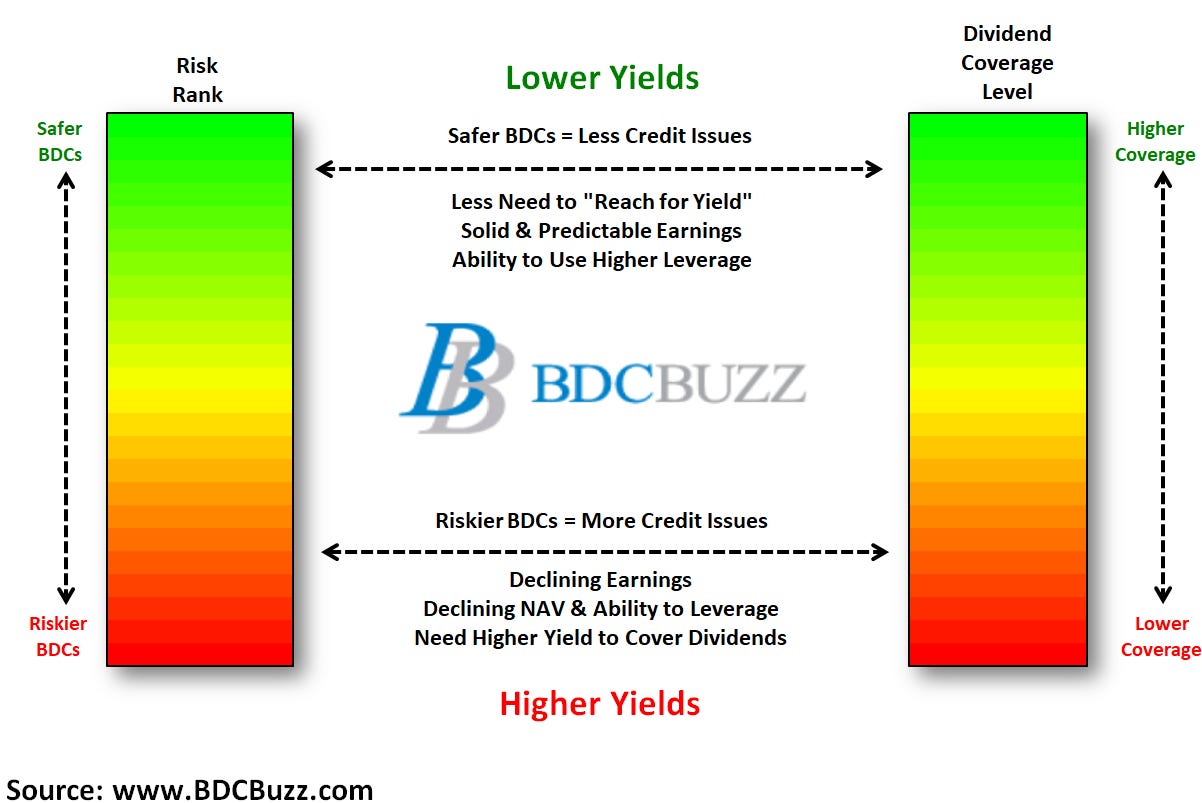
This information was previously made available to subscribers of Premium BDC Reports. BDCs trade within a wide range of multiples driving higher and lower yields mostly related to portfolio credit quality and dividend coverage potential (not necessarily historical coverage). This means investors need to do their due diligence before buying including setting target prices using the portfolio detail shown in this article (at a minimum) as well as financial dividend coverage projections over the next three quarters as discussed earlier.