The following information was previously provided to subscribers of Premium BDC Reports along with:
- AINV target prices/buying points
- AINV risk profile, potential credit issues, and overall rankings. Please see BDC Risk Profiles for additional details.
- AINV dividend coverage projections (base, best, worst-case scenarios). Please see BDC Dividend Coverage Levels for additional details.
![]()
This update discusses Apollo Investment (AINV) which is one of the larger or at least more established BDCs that I do not write much about only due to being higher risk and typically not a good fit for longer-term investors. Management previously took on too much risk including concentration risk in the wrong sectors and there will likely be continued realized losses over the coming quarters including investments discussed in this article.
Setting Target Prices
Author’s Note: Many readers are constantly focused on BDCs trading at a “discount” or “premium” to net asset value (“NAV”) but not necessarily understanding the reasons. Trading at a premium is a good thing for longer-term investors. Buy more during market volatility to dollar average your purchases.
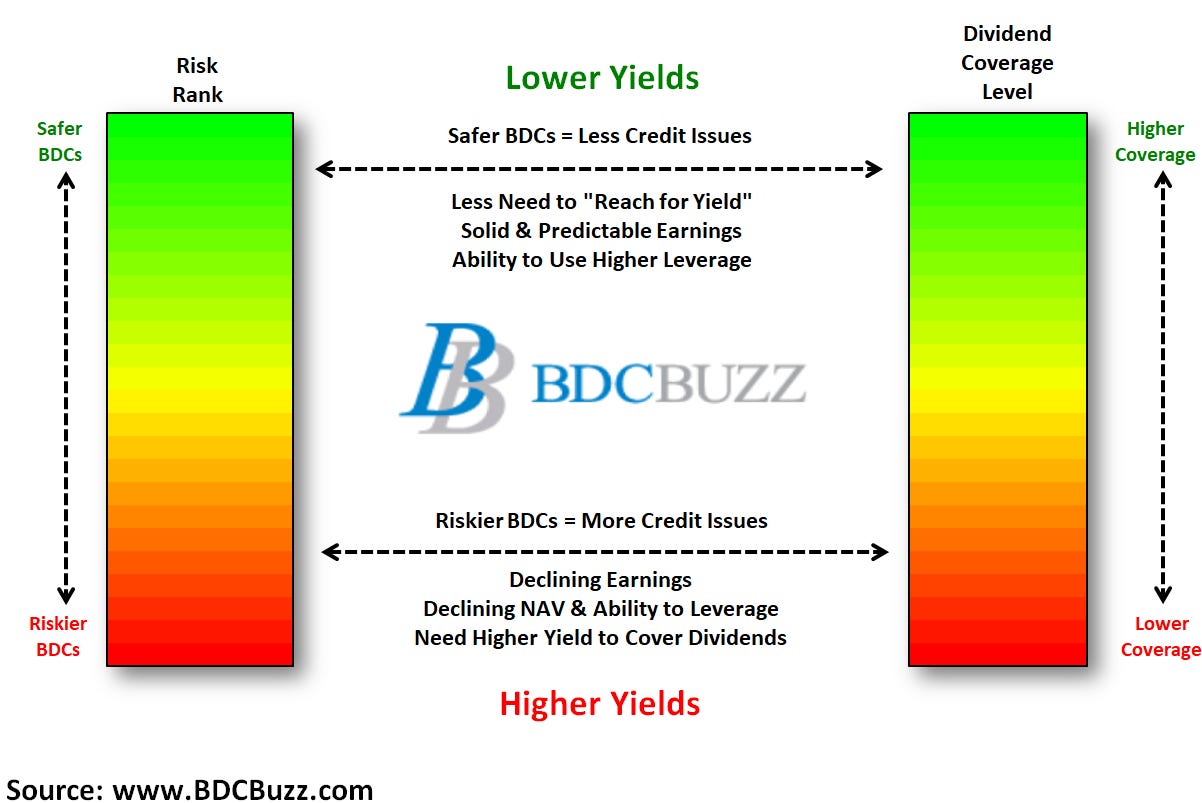
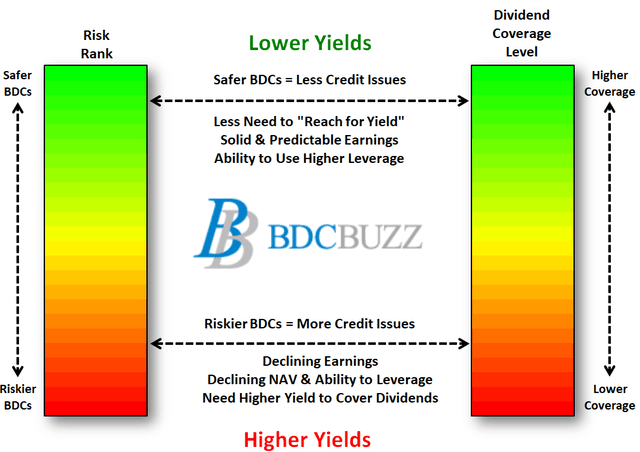
There are very specific reasons for the multiples that BDCs trade driving higher and lower yields mostly related to portfolio credit quality and dividend coverage potential (not necessarily historical coverage). Also, and this is very important, the price-to-book/NAV is highly dependant on the amount of dividends that a BDC is paying as a percentage of NAV (but also taking into account risk profile and projected dividends).
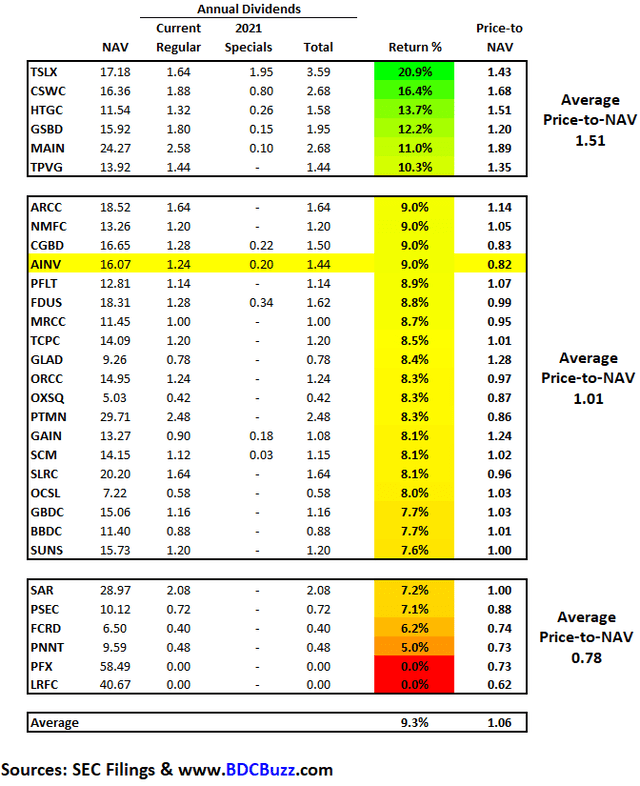
The following table shows each BDC roughly categorized into groups of paying below 7.5%, 7.5% to 9.0%, and over 10.0%. Again, there are ranges within these groups based on risk profile and projected dividends which is why most of my articles (including this one) discuss these categories providing the details so that readers can set appropriate target prices. AINV trades at a lower multiple (should be around 1.00 times NAV for the dividends paid) likely due to upcoming dividend coverage issues and realized losses discussed below. Also, using only the regular quarterly dividend of $0.31 per share would be $1.24 per annually which is only 7.7% of NAV and likely more appropriate given the direction of the portfolio toward lower yield assets (that is a good thing).
AINV Advisory Fee Agreement
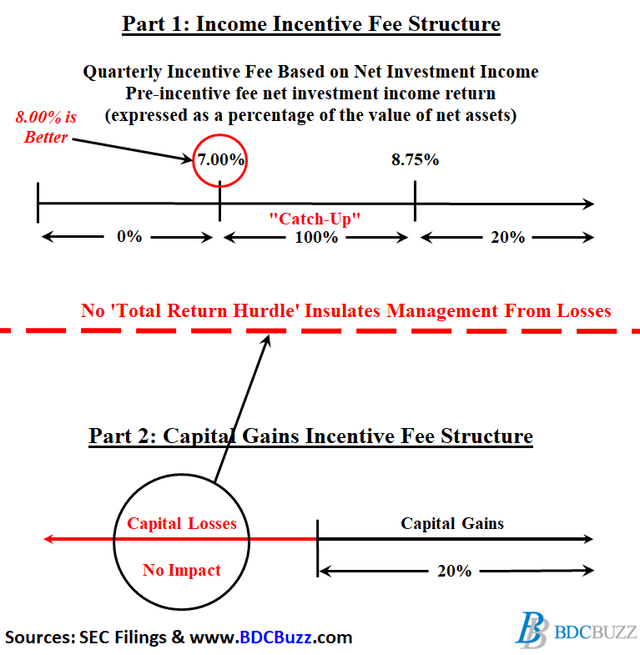
The older incentive fee structures can incentivize management to take on increased risk with investors’ capital. Management benefits from higher yields (through higher income incentive fees) with less risk related to future credit issues because capital losses are not included when calculating income incentive fees. This could encourage management to take higher risks (for increased yields) due to being insulated from potential capital losses when calculating the income portion of the incentive fees as shown in the diagram below. Ultimately, management could receive higher fees during periods of declining NAV per share, resulting in lower total returns to shareholders.
Many of the newer fee structures have a ‘total return’ hurdle taking into account realized/unrealized losses when calculating income incentive fees for management, with a look-back feature to keep management on the hook for the performance of investments over the long term.
Unfortunately, many of the higher risk BDCs do not have total return hurdles including Prospect Capital (PSEC) and more recently FS KKR Capital (FSK) which removed this feature as discussed earlier this month in “FS KKR Capital: Dividend Decrease Coming“.
However, AINV has higher quality management that previously added this feature to their fee agreement and as mentioned on the recent call:
The total return requirement closely aligns the incentives of our manager with the interest of our shareholders.”
Source: AINV Earnings Call
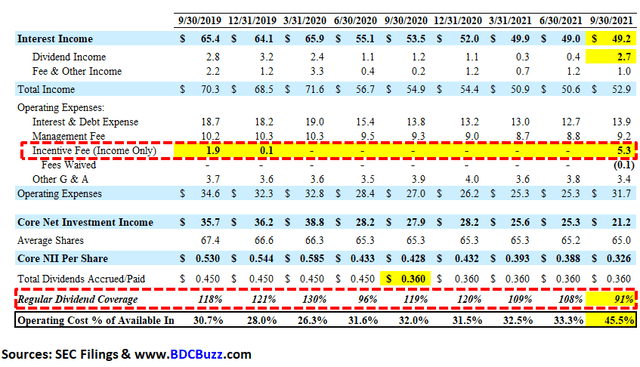
Since 2018, AINV has covered its dividend only due to no incentive fees paid driven by the total return hurdle and previous realized/unrealized losses. However, the company is now paying full incentive fees with a meaningful impact on dividend coverage as discussed later.
Net investment income for the quarter reflects a full incentive fee. Prior to the September quarter, AINV had not paid any incentive fee since the quarter ended December 2019. As a reminder, AINV’s incentive fee on income includes a total return hurdle with a rolling 12 quarter look back. Given the reversal of unrealized losses during the look back period, the manager earned a full 20% incentive during the quarter.”
Source: AINV Earnings Call
AINV Risk Profile Update
During calendar Q3 2021, its second-lien position in Sequential Brands Group, Inc. was added to non-accrual status but marked up during the quarter due to likely being resolved during Q4 2021:
Our second lien position in Sequential Brands was placed on non-accrual status during the quarter. Sequential Brands owns managers and licenses, a portfolio of consumer brands in the active and lifestyle categories. The company filed for Chapter 11 bankruptcy in August and is seeking an orderly liquidation of the brands in this portfolio. Our second lien position was marked at 92 at the end of September compared to 82 at the end of June. The mark at the end of September reflects the liquidation process and the resolution of our current position, which is expected to occur in the December quarter. At the end of September investments on non-accrual status totaled $28 million, or 1.1% of the total portfolio at fair value.”
Source: AINV Earnings Call
Sequential Brands is also held by FS KKR Capital (FSK) which is another higher-risk BDC and discussed this investment on its recent earnings call:
On November 3, the judge approved the sales without objections. We expect closing for the various sales to occur before November 14, proceeds leave to pay back a 100% of the DIP loans, we, and another lender provided fund a wind down reserve and provide a recovery on our loan. Pursuant to the contemplated transactions, we expect to receive a combination of cash, as well as newly structured debt and equity in the buyer of the active division.”
Source: FSK Earnings Call
As predicted in the previous report there were additional realized losses of $65 million or $1.00 per share due to its non-accrual investments in Spotted Hawk and Glacier Oil & Gas. AINV has been working to restructure its first-lien position in Spotted Hawk which was converted to equity with no additional impact to its NAV per share and no longer on non-accrual status.
During the quarter Spotted Hawk completed restructuring of its balance sheet our second lien position tranche A was converted to equity in our third lien position tranche B was cancelled. Both of these positions were previously on non-accrual status. The valuation of our investment in Spotted Hawk was not impacted by this restructuring.”
Source: AINV Earnings Call
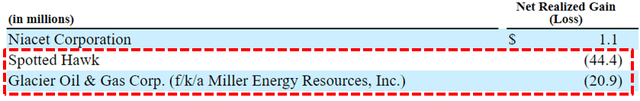
Source: AINV SEC Filing
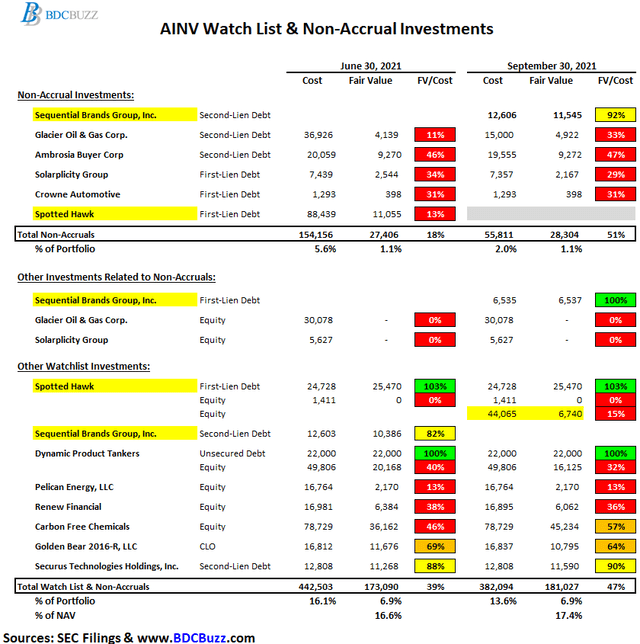
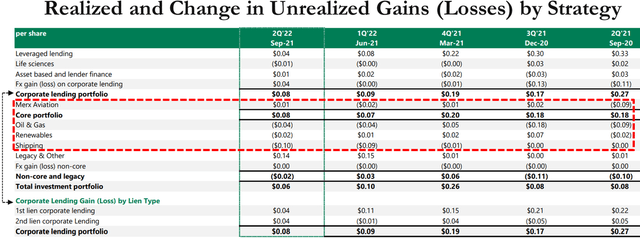
Non-accruals remain around 1.1% of the portfolio fair value due to adding Sequential Brands offset by restructuring Spotted Hawk and Glacier Oil & Gas as mentioned earlier. Again, there will likely be continued realized losses over the coming quarters including previously discussed investments some of which are included in the following table. These investments alone account for $201 million or $3.11 per share of previous unrealized losses but still account for almost 7% of the total portfolio fair value and 17.4% of NAV per share.
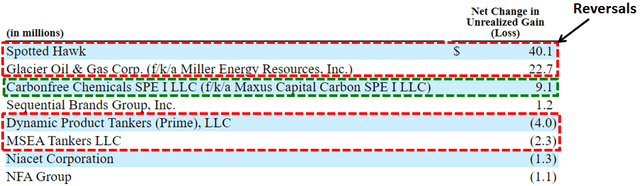
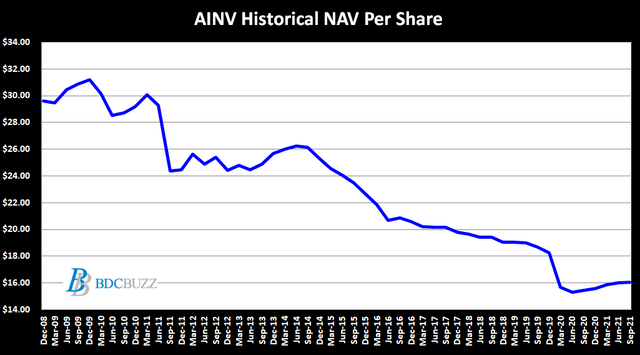
Net asset value (“NAV”) per share increased by $0.05 or 0.3% (from $16.02 to $16.07) mostly due to Carbonfree Chemicals (same as previous quarter) as well as accretive share issuances partially offset by shipping investments (same as previous quarter) Dynamic Product Tankers and MSEA Tankers and not adequately covering the dividends (missing by $0.034 per share).
We ended the quarter with net asset value per share of $16.07, up $0.05 or 0.3%, driven by our corporate lending portfolio, which continues to perform well as well as the accretive impact of stock buybacks. We’re in the September quarter or corporate lending, portfolio had a gain of $5 million or $0.08 per share partially offset by $1.3 million or $0.02 per share on non core and legacy assets. The net loss on non core and legacy assets reflects net losses on oil and gas renewables and shipping investments, partially offset by a gain on carbon-free legacy investments.”
Source: AINV Earnings Call
Source: AINV SEC Filing
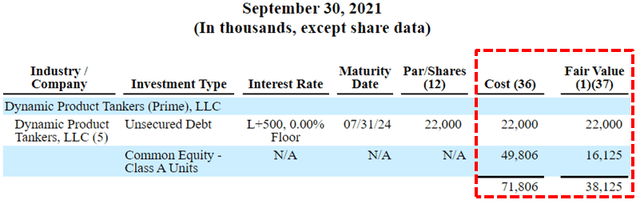
Same as the previous quarter, the largest markdown was its equity position in Dynamic Product Tankers which is a shipping business 85% owned by AINV (since 2015) discussed in previous reports. As shown below, AINV currently has a $22 million subordinated loan due July 2024 at a very low rate of LIBOR +500 basis points and continues to mark down its equity position currently 32% of cost accounting for almost $34 million or $0.52 per share of unrealized losses.
Source: AINV SEC Filing
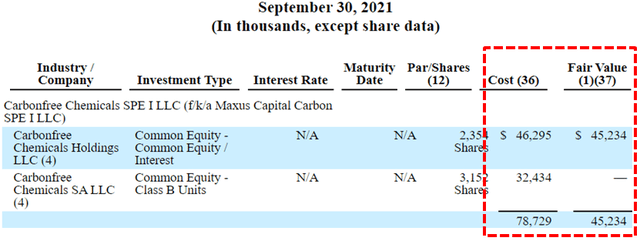
Also discussed in previous reports, AINV restructured its first-lien loans to Carbonfree Chemicals and now owns 27% of the company. The equity portion has been marked up during the recent quarters and is now valued at 57% of cost but needs to be watched as it could result in higher (or lower) NAV over the coming quarters. Carbonfree produces proprietary technologies that capture and reduce carbon emissions by producing chemicals such as limestone and baking soda for sale or for long term storage and could benefit from the current administration.
Management discussed on the recent call:
Regarding carbon-free, as a reminder, our investment in carbon-free consists of an investment in the company’s proprietary carbon capture technologies and an investment in the company’s chemical plant. Carbon-free is benefiting from strong interest in carbon capture, utilization and storage as part of broader ESG trends. We believe carbon-free is a leader in this space, as evidenced by partnerships announced during the quarter, which demonstrate market acceptance for its technology.”
Source: AINV Earnings Call
Source: AINV SEC Filing
Source: AINV Earnings Presentation
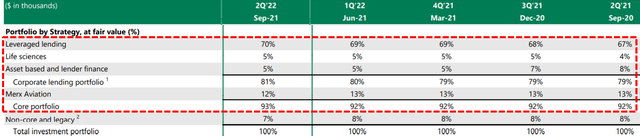
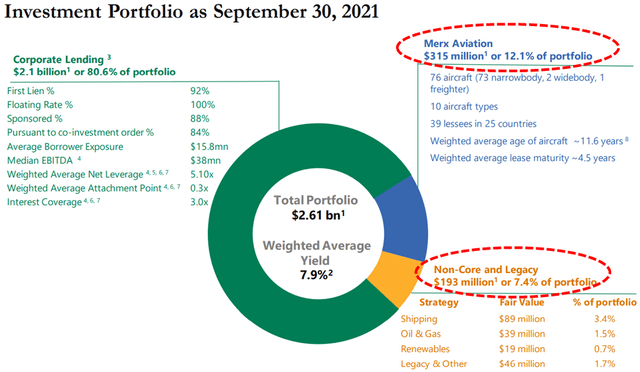
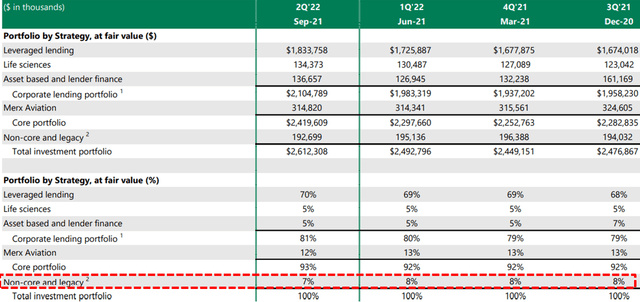
Since 2016, the company has been repositioning the portfolio into safer assets including reducing its exposure to oil & gas, unsecured debt, and CLOs. The “core strategies” portion of the portfolio remains around 92.6% of all investments and includes Merx:
We continue to make good progress increasing our exposure to first lien floating rate corporate loans, while reducing our exposure to junior capital and non-core positions. Repayments during the quarter included the exit to second lien investments, as well as a small partial pay down from one of our shipping investments. We remain focused on reducing our exposure to the remaining non-core assets, while ensuring an optimal outcome for our shareholders.”
Source: AINV Earnings Call
Source: AINV Earnings Presentation
Source: AINV Earnings Presentation
Its aircraft leasing through Merx Aviation remains the largest investment and is around 12% of the portfolio and was discussed on the call including “the level of lease revenue generated from our fleet has stabilized” and “continues to benefit from a growing servicing business which has increased in value over time”:
Moving to Merx. The overall air traffic environment appears to be improving, particularly in the US. We’re optimistic that demand for air traffic will continue to grow with the ongoing rollout of the vaccine and the lifting of travel restrictions. Furthermore, the aircraft leasing market will continue to be an important and growing percentage of the world fleet, as airlines will increasingly look at third-party balance sheets to finance their operating assets. Specific to our investment, as Howard mentioned, we believe Merx has successfully navigated the significant disruption caused by the COVID-19 pandemic. The level of lease revenue generated from our fleet has stabilized. We have worked through our exposure to airlines that have undergone restructurings. We have been able to remarket aircraft during the period with long term leases or sales. And Merx continues to benefit from a growing servicing business which has increased in value over time. Given the stabilization of Merx, during the quarter we recast at $4.5 million of Merx equity into debt, and as Howard mentioned, AINV received $6.9 million of interest income from Merx during the September quarter, $2.1 million more than last quarter. Merx remains focused on remarketing aircraft that are due to come off lease via extensions, with existing lessees releasing to other airlines on long term leases or sales. During the September quarter, Merx sold two aircraft and signed lease extensions for six aircraft. Our lease maturity schedule is well staggered. We believe Merx’s portfolio compares favorably with other major lessors in terms of asset, geography, age, maturity and lessee diversification. Merx’s portfolio is skewed towards the most widely used types of aircraft, which means demand for Merx’s fleet is anticipated to be resilient. Merx’s fleet primarily consists of narrow body aircraft serving both US and foreign markets. The Apollo aviation platform will continue to seek to opportunistically deploy capital. To be clear, Merx has focused on its existing portfolio, and is not seeking to materially grow its balance sheet portfolio.”
Source: AINV Earnings Call
Management was also asked about the impacts of inflationary pressure on its portfolio companies:
Q. “There’s some inflationary pressures and wage pressures, what’s the biggest risk economically as you’re thinking about as you’re deploying capital?”
A. “We’ve talked about over an extended period of time, the best defense to that is sort of granularity and diversity. So, that — like any of these risks don’t expose you across the portfolio. It’s why we’ve always said like one of the key aspects is to have a very wide funnel, have a diversity of products, and be able to be as selective as you can be in a market like this. It’s a very benign environment this minute. But you can see all sorts of things that could potentially come your way. So, we take a very — we take portfolio construction very seriously. And then on individual credits, try to look out at the specific risks we see coming to see how they can absorb.”
Source: AINV Earnings Call
AINV Dividend Coverage Update
Author’s Note: The following information was provided to subscribers along with 3 quarters of financial projections using base, best, and worst-case assumptions to test the sustainability of the current dividends.
On November 4, 2021, the Board declared a distribution of $0.31 per share plus a supplemental distribution of $0.05 per share payable on January 6, 2022, to shareholders of record as of December 20, 2021. Investors should expect dividend coverage to “fluctuate” over the coming quarters but management is committed to paying the regular quarterly distribution of $0.31 plus the supplemental distribution of $0.05 through March 31, 2022, as discussed on the recent call:
The board has declared a base distribution of $0.31 per share, and a supplemental distribution of $0.05 per share, both distributions are payable on January 6 2022, to shareholders as a record on December 20 2021. I’d like to remind everyone that as we’ve indicated previously, we intend to declare a quarterly based distribution of $0.31 per share, and a quarterly supplemental distribution of $0.05 per share for at least one more quarter.”
Source: AINV Earnings Call
As mentioned earlier, the distributions have been covered only through fee waivers and not paying the full incentive fees. However, the company is now paying full incentive fees with a meaningful impact on dividend coverage as predicted in previous reports.
Net investment income for the quarter reflects a full incentive fee. Prior to the September quarter, AINV had not paid any incentive fee since the quarter ended December 2019. As a reminder, AINV’s incentive fee on income includes a total return hurdle with a rolling 12 quarter look back. Given the reversal of unrealized losses during the look back period, the manager earned a full 20% incentive during the quarter. The total return requirement closely aligns the incentives of our manager with the interest of our shareholders.”
Source: AINV Earnings Call
AINV’s recurring interest income has recently declined to its lowest level over the last 15 years and is now below $50 million.
The quarter-over-quarter decline in interest income was attributable to the pace of the investment activity and a relatively higher yield on repayments versus fundings.”
Source: AINV Earnings Call
There was an additional $65 million of realized losses in calendar Q3 2021 due to its non-accrual investments in Spotted Hawk and Glacier Oil & Gas as discussed later. It is important to note that AINV has experienced over $760 million of realized losses over the last ~9 years which is around $11.75 per share using the current number of shares. A good portion of AINV’s previous and recent losses was due to higher amounts of exposure to cyclical sectors including extended stay hotels and oil/energy. However, other BDCs also had larger amounts of oil/energy exposure with much stronger NAV performance during the same period.
During calendar Q3 2021, AINV repurchased 450,953 shares at a weighted average price per share of $13.09, inclusive of commissions, for a total cost of $5.9 million. From October 1, 2021, through November 3, 2021, the company repurchased another 308,005 shares at a weighted average price per share of $13.30 for a total cost of $4.1 million. Since the inception of the share repurchase program, the company has repurchased 14,559,137 shares at a weighted average price per share of $16.15 for a total cost of $235.1 million, leaving a maximum of almost $15 million available for future purchases.
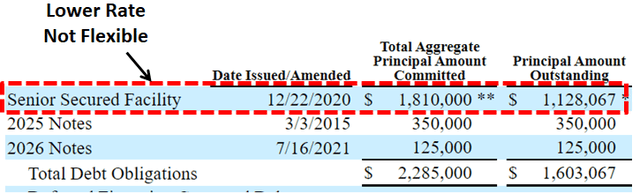
In July 2021, the company issued $125 million of 4.50% Notes due July 16, 2026, which increased the overall cost of borrowings but strengthened the balance sheet and is taken into account with the updated projections:
The increase in interest expense reflects both the growth in the portfolio, as well as an increase in our funding costs. As a reminder, in July, we issued $125 million of five year 4.5% unsecured notes, which drove the increase in our weighted average cost of funding from 3.08% to 3.2% quarter over quarter. Importantly, unsecured debt increase to 30% of our outstanding debt at the end of September, up from 24% last quarter.”
Source: AINV Earnings Call
However, it should be pointed out that having 70% of your borrowings consisting of secured credit facilities is not flexible relative to most higher quality BDCs. This is important if there is another market meltdown and BDCs have to temporarily mark down assets driving many issues including coverage ratios and borrowing covenants. Especially given that AINV currently has the highest leverage ratio (during good times). Also, as AINV refinances its balance sheet into more unsecured notes it will drive up its overall borrowing rates putting additional pressure on dividend coverage. Not ideal and needs to be watched.
Also taken into account is additional guidance from management on the recent call including:
Fee and prepayment income totaled $1.7 million dollars for the quarter. Although these sources of income can fluctuate from quarter-to-quarter, we expect to generate approximately $3.5 million of fee and prepayment income per quarter on average. As an illustration, in a March 2021 and June 2021 quarters, fee and prepayment income totaled $3.9 million and $5.9 million respectively.”
“We continue to focus on monetizing underlying assets, specifically Spotted Hawk, dynamic, MC and Chiron. Taken together these assets and a few others account for approximately $230 million of fair value and generate only $16 million of annual income, redeploying those assets that are approximate on euro yield to generate an incremental $2 to $3 million of annual net investment income.”
“We continue to generate incremental cash proceeds from the portion of our non-core assets that are non-generating income. For every $10 million of cash we generate from these non-income producing assets, we can generate approximately $650,000 of annual net investment income, or approximately $0.01 per share. In this regard, we have generated incremental cash each quarter and are very focused on executing some more significant process in the coming — progress in the coming quarters.”
Source: AINV Earnings Call
Management has guided for portfolio growth using increased leverage which is already the highest in the sector at 1.52 debt-to-equity (net of cash) compared to the average BDC currently around 0.96.
Given this solid level of activity, our investment portfolio grew and our net leverage ratio increased to 1.52 times at the end of September, right in the middle of our target leveraged range of 1.40 times to 1.60 times. As we look ahead, we are confident in our ability to grow our portfolio and operate within our target leverage range, given the tremendous need for creative and flexible private capital.”
Source: AINV Earnings Call
Previously, AINV was considered a ‘Level 4’ dividend coverage BDC implying that a dividend reduction was imminent mostly related to needing higher leverage as well as the reliance on fee waivers to cover the quarterly dividend. On August 6, 2020, the company announced a decrease in the regular quarterly dividend per share from $0.45 to $0.31.
From previous call: “Turning to our distribution, in light of the challenges and uncertainty created by the COVID-19 pandemic and our plans to further reduce the funds leverage, we have reassessed the long-term earning power of the portfolio and included that as a prudent to adjust the distribution at this time. We believe that distribution level should reflect the prevailing market environment and be aligned with the long-term earnings power of the portfolio. Going forward in addition to a quarterly based distribution, the company’s Board expects to also declare supplemental distribution and an amount to be determined each quarter.”
Over the coming quarters, AINV could be downgraded depending on the progress of rotating out of “non-earning and lower-yielding assets” and improved results/income from its investment in Merx Aviation.
Management mentioned that the $2.1 million dividend income received in calendar Q3 2021 will likely fall back to previous levels and is taken into account with the updated projections:
We believe Merx has successfully navigated this challenging period. As a result, AINV earned more income from Merx during the September quarter compared to recent quarters. As a result of the stability we expect to continue to see from Merx, during the recorder, we recap the capital structure and receive $6.9 million of interest income from Merx during the September quarter, $2.1 million more than last quarter. We earned a $2 million dividend from MSEA Tankers during the September quarter, we expect to earn approximately $1 million on average going forward, a level consistent with prior periods.”
Source: AINV Earnings Call
Source: AINV Earnings Presentation
Article Summary & Recommendations
- Assess investor profile
- Set target prices based on expected risk and dividends paid
- Purchase additional shares during market volatility
First of all, please assess whether you are a “trader” and a “buy and hold” investor. The difference is how long you plan to hold certain investments, your overall appetite for risk, and expected returns. Traders typically have a higher risk tolerance but also expect higher returns. Personally, I am a buy and hold longer-term investor but continue to buy each time the market pulls back constantly reinvesting my dividends building positions in higher quality BDCs that easily outperform due to having higher quality management. I currently have 18 BDC positions some of which have been discussed in my recent public articles. I will try to cover the remaining positions in upcoming articles.
As mentioned earlier, most BDCs have recently issued very low rate unsecured notes and refinanced their balance sheets taking some short-term hits but locking in some strong quarters coming up. Q4 is typically the busiest for portfolio turnover driving higher fees and prepayment-related income which has been discussed on many of the recent earnings calls. There is a good chance that is why BDC prices have continued higher. Also, most of my ‘Level 1’ dividend coverage BDCs have recently announced dividend increases and/or supplemental/special dividends.
As for AINV, please do your due diligence including setting target prices using the portfolio detail shown in this article (at a minimum) as well as financial dividend coverage projections over the next three quarters as discussed earlier. AINV is a higher risk BDC due to previous and upcoming realized losses as well as not ideal sector exposures (similar to FSK) but management is actively working to clean up the portfolio (seems to be taking a very long time in my opinion). The company is likely trying to maximize shareholder value and at least has an incentive fee structure that partially aligns management with the shareholders.
AINV trades at an 18% discount to NAV currently paying $0.36 per share of quarterly dividends which is an 11% annual yield compensating investors for a not-so-certain future of upcoming dividends and/or realized losses. Not my cup of tea and would much rather own a BDC trading at a premium to NAV with a lower cost of capital and a lower dividend yield (before taking into account upcoming dividend increases).
What Can I Expect Each Week With a Paid Subscription?
Each week we provide a balance between easy to digest general information to make timely trading decisions supported by the detail in the Deep Dive Projection reports (for each BDC) for subscribers that are building larger BDC portfolios.
- Monday Morning Update – Before the markets open each Monday morning we provide quick updates for the sector including significant events for each BDC along with upcoming earnings, reporting, and ex-dividend dates. Also, we provide a list of the best-priced opportunities along with oversold/overbought conditions, and what to look for in the coming week.
- Deep Dive Projection Reports – Detailed reports on at least two BDCs each week prioritized by focusing on ‘buying opportunities’ as well as potential issues such as changes in portfolio credit quality and/or dividend coverage (usually related). This should help subscribers put together a shopping list ready for the next general market pullback.
- Friday Comparison or Baby Bond Reports – A series of updates comparing expense/return ratios, leverage, Baby Bonds, portfolio mix, with discussions of impacts to dividend coverage and risk.
![]()
This information was previously made available to subscribers of Premium BDC Reports. BDCs trade within a wide range of multiples driving higher and lower yields mostly related to portfolio credit quality and dividend coverage potential (not necessarily historical coverage). This means investors need to do their due diligence before buying including setting target prices using the portfolio detail shown in this article (at a minimum) as well as financial dividend coverage projections over the next three quarters as discussed earlier.