The following information was previously provided to subscribers of Premium BDC Reports along with:
CGBD target prices/buying points
CGBD risk profile, potential credit issues, and overall rankings. Please see BDC Risk Profiles for additional details.
CGBD dividend coverage projections (base, best, worst-case scenarios). Please see BDC Dividend Coverage Levels for additional details.
The total yield for CGBD includes $0.20/share of supplemental dividends paid annually.
CGBD Dividend Coverage Update
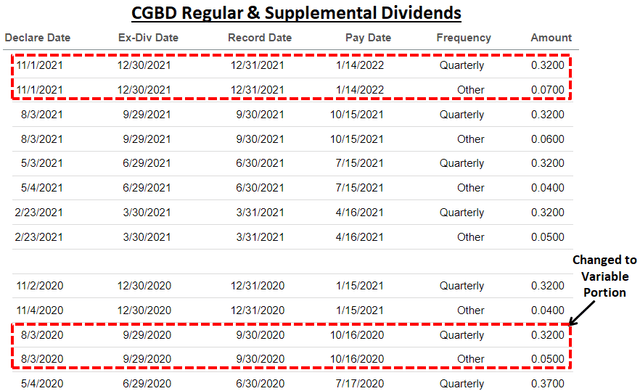
Similar to other BDCs, CGBD converted to a “variable distribution policy” with the objective of “paying out a majority of the excess above the $0.32 and we would anticipate doing the same going forward”.
“Similar to prior quarters, as we look forward to the fourth quarter and into 2022, we remain very confident in our ability to comfortably deliver the $0.32 base dividend plus continue the sizeable supplemental dividends.”
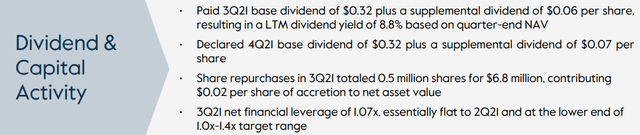
On November 1, 2021, the company announced a base quarterly dividend of $0.32 plus a supplemental dividend of $0.07 for a total of $0.39 per share which was the ‘best case’ projections in the previous report.
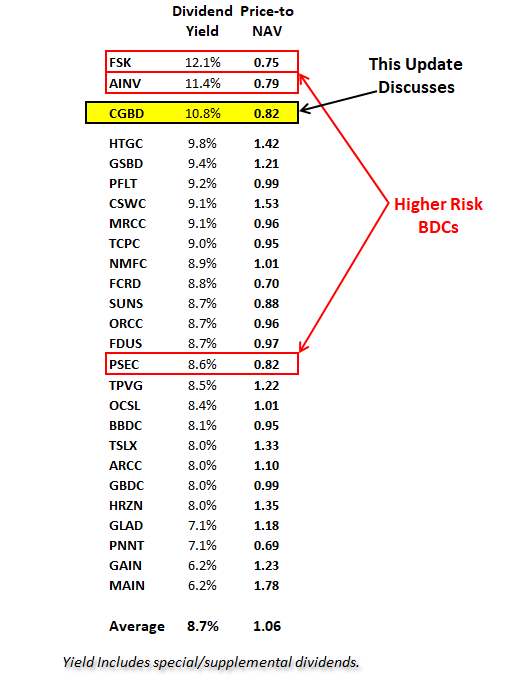
“We again generated strong earnings this quarter with net investment income of $0.39 per common share. We’ve declared a total dividend of $0.39, which represents a trailing 12-month dividend yield of 10.6% on our common stock and 9% on our net asset value. In line with our dividend policy investors can expect us to distribute substantially all of the excess income earned over our base $0.32 dividend.”
Similar to other BDCs, CGBD is expecting an active Q4 2021 including new investments partially offset by prepayments that will drive prepayment-related income including accelerated original issue discount (“OID”). As discussed later, First Watch Restaurant Group (FWRG) completed its IPO in October 2021 raising $170 million partially used to prepay its $35 million first-lien loan. There is a good chance that the company will report closer to the ‘best case’ projections.
“While the new deal environment continues to be very robust, we’ve definitely seen a pickup in repayment activity based on just a really robust M&A environment. As we look at this quarter, as we sit here today, we’re probably looking at very robust new deal volume probably being offset by repayments in the book. So we’re seeing, I’d say, in the aggregate, steady in terms of overall net-net deployment for the quarter in terms of not looking at too much portfolio growth leverage remaining in the range where we’ve been.”
Upcoming Share Repurchases
On November 1, 2021, the Board authorized an extension as well as the expansion of its $150 million stock repurchase program at prices below NAV per share through November 5, 2022. During Q3 2021, the company repurchased another 0.5 million shares at an average cost of $13.65 per share for $6.8 million resulting in accretion to NAV per share of $0.02. Since inception, the company has repurchased almost 9 million shares at an average cost of $13.25 per share or $117 million resulting in accretion to NAV per share of $0.48.
“This quarter, we repurchase $6.8 million of our common stock resulting in $0.02 of accretion to net asset value. Recently our Board of Directors reapproved our stock repurchase authorization for $150 million. And at our stock’s current valuation, we will continue to be purchasers of our common shares.”
As of September 30, 2021, there was $32.7 million remaining under the stock repurchase program. Management discussed on the recent call including less share repurchases if the stock price continues higher and I have taken into account with the updated projections:
“We look closely at the level of the discount. And while we’ve been active buyers over the last number of years, except during the March 2020, related 2020 timeframe based on the impact of the pandemic. We anticipate continuing to be steady purchasers. But depending on the discount to NAV, you could see that those numbers rightfully – we think rightly have gone down the last couple of quarters. So we think, based on if we continue to trade in the 80s where we are now, we’ll continue at that steady pace, to the extent that NAV, as we anticipate that discount should decrease, we should get closer to trading at NAV, you could see those level of repurchases decline.”
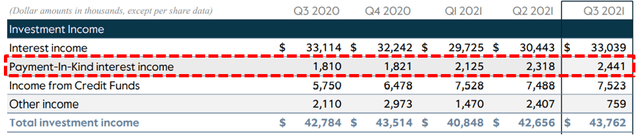
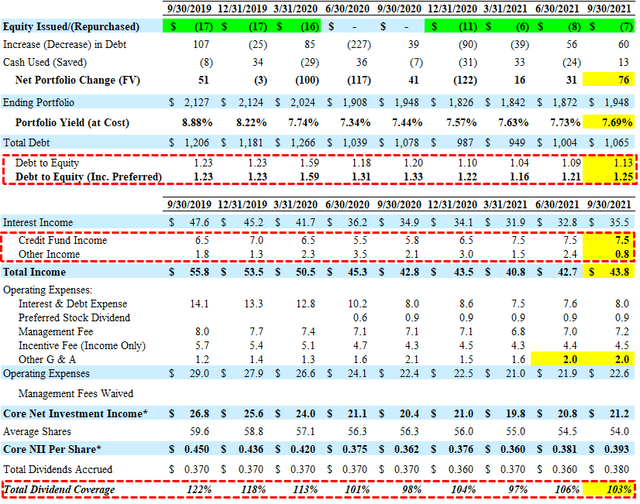
As mentioned in previous reports, the amount of payment-in-kind (“PIK”) interest income has been increasing and needs to be watched as it now accounts for 5.6% of total income as compared to only 1.3% in Q1 2020.
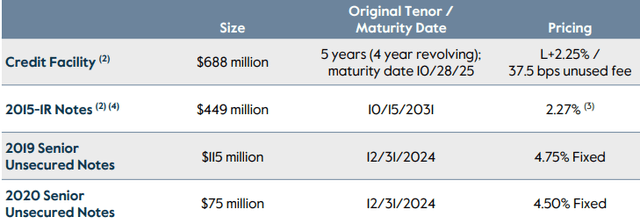
As of September 30, 2021, CGBD had cash of around $46 million and $261 million available for additional borrowings under its revolving credit facilities. Management is targeting a debt-to-equity ratio between 1.00 and 1.40 including the recently issued preferred equity and is taken into account with the projections.
“Statutory leverage was about 1.3 times, while net financial leverage was about 1.1. Both increased modestly quarter-over-quarter, given the net positive deployment in the investment book. We’re still sitting close to the lower end of our target range of 1.0 to 1.4, giving us flexibility to invest judiciously in the current robust deal environment.”
For Q3 2021, CGBD reported between its base and best-case projections covering its regular and supplemental dividends by 103% mostly due to higher-than-expected portfolio growth and repayments driving accelerated original issue discount (“OID”) partially offset by lower amendment and underwriting fees during the quarter. Also, there was a slight decline in its portfolio yield from 7.73% to 7.69%.
“We had another impressive quarter on the earnings front. Total investment income for the third quarter was $44 million, that’s up from $43 million in the prior quarter. The primary driver was an increase in core interest income on our investment book, partially offset by lower other income. OID accretion from repayments experienced a moderate increase.”
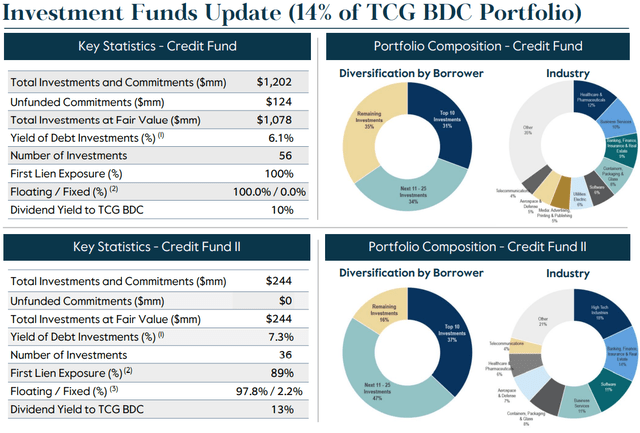
Middle Market Credit FundsUpdate
In November 2020, CGBD announced a joint venture with Cliffwater to create Middle Market Credit Fund II (“Credit Fund II”) for “enhanced balance sheet flexibility, including increased capital to deploy into an attractive origination environment and additional capacity to repurchase shares.” CGBD sold senior secured debt investments of $250 million to Credit Fund II in exchange for 84.13% of membership interests and cash proceeds of $170 million. During Q3 2021 ORCC recognized almost $7.5 million in income (same as previous quarter) related to the funds compared to $6.5 million in Q4 2020. Management expects the amount of dividend income to remain around $7.5 million and is taken into account with the ‘base case’ projections.
“Moving on to the performance of our two JVs. Total dividend income was again, $7.5 million, in line with the last two quarters. On a combined basis, our dividend yield from the JVs was about 11%. Going forward, we continue to expect stable dividend generation from the two JVs similar to this quarter’s results.”
Previous reports predicted a reduction in the regular quarterly dividend (from $0.37 to $0.32) due to lower income from its Credit Fund I, declines in portfolio yield and interest income primarily due to the decrease in LIBOR and additional loans placed on non-accrual as well as the need to reduce leverage.
CGBD Quick Risk Profile
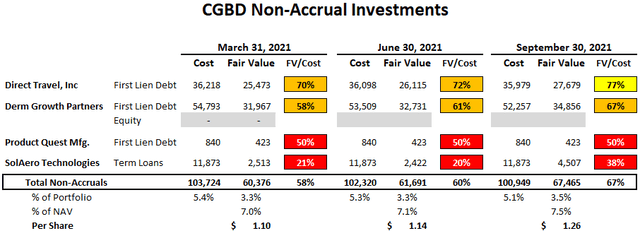
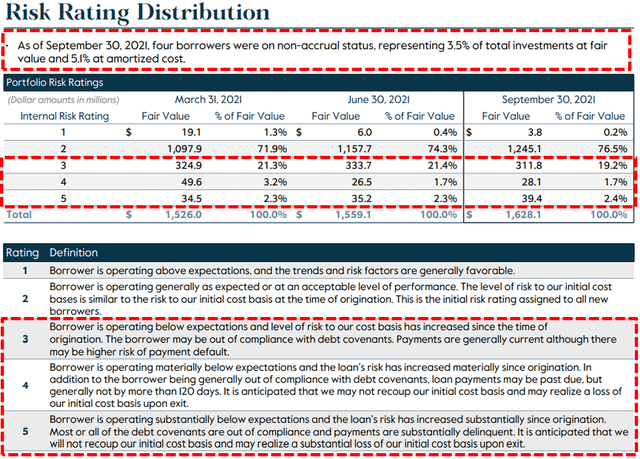
There have been no new investments added to non-accruals status over the last five quarters which recently increased from 3.3% to 3.5% of the portfolio only due to increased valuations which is typically a good sign showing improvement. If these investments were completely written off it would have an impact of around $1.26 to its net asset value (“NAV”) per share or around 7.5%. However, management discussed these investments on the recent call mentioning “we see a path to both NII expansion and increased recovery above our 9/30 valuations”:
“We don’t manage our non-accrual statistics. We manage our non-accrual assets for maximum value realization. These situations often require the right mix of turnaround experience, incremental capital and patience, always we possess. We’ve used the combination in the past to achieve successful recoveries and we’re following a similar playbook on our current non-accruals, dermatology, direct travel and Celero. Based on our continued focus and investment over a number of years, all else equal, we see a path to both NII expansion and increased recovery above our 9/30 valuations.”
It should be noted that Direct Travel and Product Quest currently have a risk ranking of 4 compared to Derm Growth Partners and SolAero with a lower risk ranking of 5 and have been discussed in previous reports.
Risk Rating 4 – Borrower is operating materially below expectations and the loan’s risk has increased materially since origination. In addition to the borrower being generally out of compliance with debt covenants, loan payments may be past due, but generally not by more than 120 days. It is anticipated that we may not recoup our initial cost basis and may realize a loss of our initial cost basis upon exit.
Risk Rating 5 – Borrower is operating substantially below expectations and the loan’s risk has increased substantially since origination. Most or all of the debt covenants are out of compliance and payments are substantially delinquent. It is anticipated that we will not recoup our initial cost basis and may realize a substantial loss of our initial cost basis upon exit.
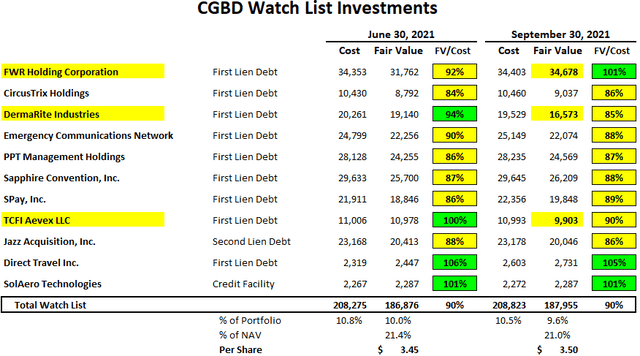
Other ‘watch list’ investments remain around 10% of the total portfolio including DermaRite Industries and TCFI Aevex which were marked down in Q3 2021 and need to be watched along with CircusTrix, Emergency Communications Network, PPT Management, Sapphire Convention, SPay, Inc., and Jazz Acquisition. However, its investment in FWR Holding Corporation also known as First Watch Restaurant Group (FWRG) completed its IPO in October 2021 raising $170 million partially used to repay its first-lien loan which was marked up during Q3 2021 as shown below. Most of the following watch list investments are likely included in the internal risk rating 3 investments discussed next.
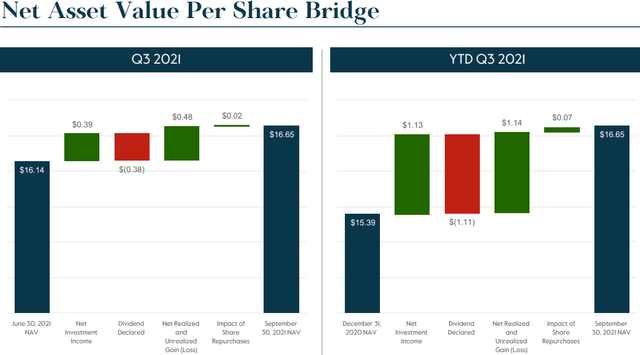
During Q3 2021, CGBD’s net asset value (“NAV”) increased by another $0.51 or 3.2% mostly due to improving credit fundamentals (including non-accruals impacted by COVID, Derm Growth Partners and Direct Travel), realized gains on equity co-investments, and an increase in value of the Credit Fund as well as $0.02 per share due to accretive share repurchases.
“We ended the quarter with net asset value per share of $16.65, up $0.51 or 3.2% from the $16.14 we reported last quarter. Notably, our NAV now sits above what we reported in the fourth quarter of 2019, the final quarter before the onset of the global health crisis. We took aggressive action to manage our portfolio throughout the pandemic. The performing lower COVID impacted names plus our equity investments in the JVs, increased in value about $14 million compared to 6/30. The largest components were an $8 million increase in the value of our investment in MMCF 1 plus $5 million in gains from our equity co-investment book. Second, the assets that have been underperforming pre-pandemic, some which have COVID exposure. We’re up $5 million, marking the six consecutive quarter of stability or improvement. The final category is the moderate to heavier COVID impacted gains. We continue to see improvement in the underlying financial performance of these borrowers. Collectively, they experienced a net $7 million increase in value. Of note, our investment in First Watch Restaurants, which we marked up during the third quarter, repaid in full during October.”
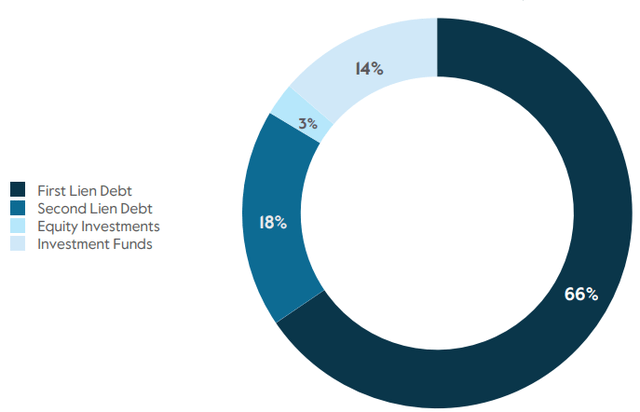
It is important to point out that the previous tables used the percentage of the total portfolio as compared to the following table which excludes ‘Investment Funds’ at 14% and equity investments at 3% of the portfolio.
CGBD previously had 6 categories of risk ratings and basically combined the previous rating 3 and 4 that accounted for 17% of debt investments as of Q1 2020 into the new rating 3 which is now 19% and needs to be watched. However, the total amount of investments with an internal risk rating between 3 and 5 (implies downgraded) decreased from 25.4% in Q2 2021 to 23.3% in Q3 2021:
“Our internal risk ratings again improved as through the performance of our watch list credits. We expect continued positive fundamental performance going forward and see opportunity in 2022 for improvements in our non-accrual investments. We’ve held our current non-accrual investments for an average of 10 quarters. As we look forward, with several years of hard work behind us, we believe these assets now generally stand on sound fundamental footing.”
On the recent call management was asked about impacts from supply chain disruptions and inflation:
Q. “You gave some commentary in your introduction regarding some supply chain shortages and inflation pressures as being a fairly moderate concern right now in the marketplace, which is understandable. Does that change the specific industries that you guys are focusing on today when you guys are looking to deploy new capital? Or does that just influence the way you guys are due diligence-ing specific companies, making sure that the supply chains are set up well or that they can pass on increasing costs to their end markets.”
A. “The answer is, absolutely on the latter, maybe a little less so on the former, meaning that it really causes us to focus a lot more on near-term earnings trajectory and proving out the price pass-through mechanisms of the borrowers that we have. That, of course, is a really important part of any underwrite and always will be, and then seeing those demonstrated in the current period, as costs rise, to recapture those and profitability. So I think that it really causes us to kind of double down in those places where you might see those things happening. And naturally, in an environment like this, you’re going to skew a little less towards highly labor-intensive business models, highly energy-intensive business models, where you’re seeing the most pressure. But it certainly doesn’t rule out those sectors, if you have confidence in your ability to underwrite and understand that the pricing capture is happening on the other side of cost pickup.”
What Can I Expect Each Week With a Paid Subscription?
Each week we provide a balance between easy to digest general information to make timely trading decisions supported by the detail in the Deep Dive Projection reports (for each BDC) for subscribers that are building larger BDC portfolios.
Monday Morning Update – Before the markets open each Monday morning we provide quick updates for the sector including significant events for each BDC along with upcoming earnings, reporting, and ex-dividend dates. Also, we provide a list of the best-priced opportunities along with oversold/overbought conditions, and what to look for in the coming week.
Deep Dive Projection Reports – Detailed reports on at least two BDCs each week prioritized by focusing on ‘buying opportunities’ as well as potential issues such as changes in portfolio credit quality and/or dividend coverage (usually related). This should help subscribers put together a shopping list ready for the next general market pullback.
Friday Comparison or Baby Bond Reports – A series of updates comparing expense/return ratios, leverage, Baby Bonds, portfolio mix, with discussions of impacts to dividend coverage and risk.
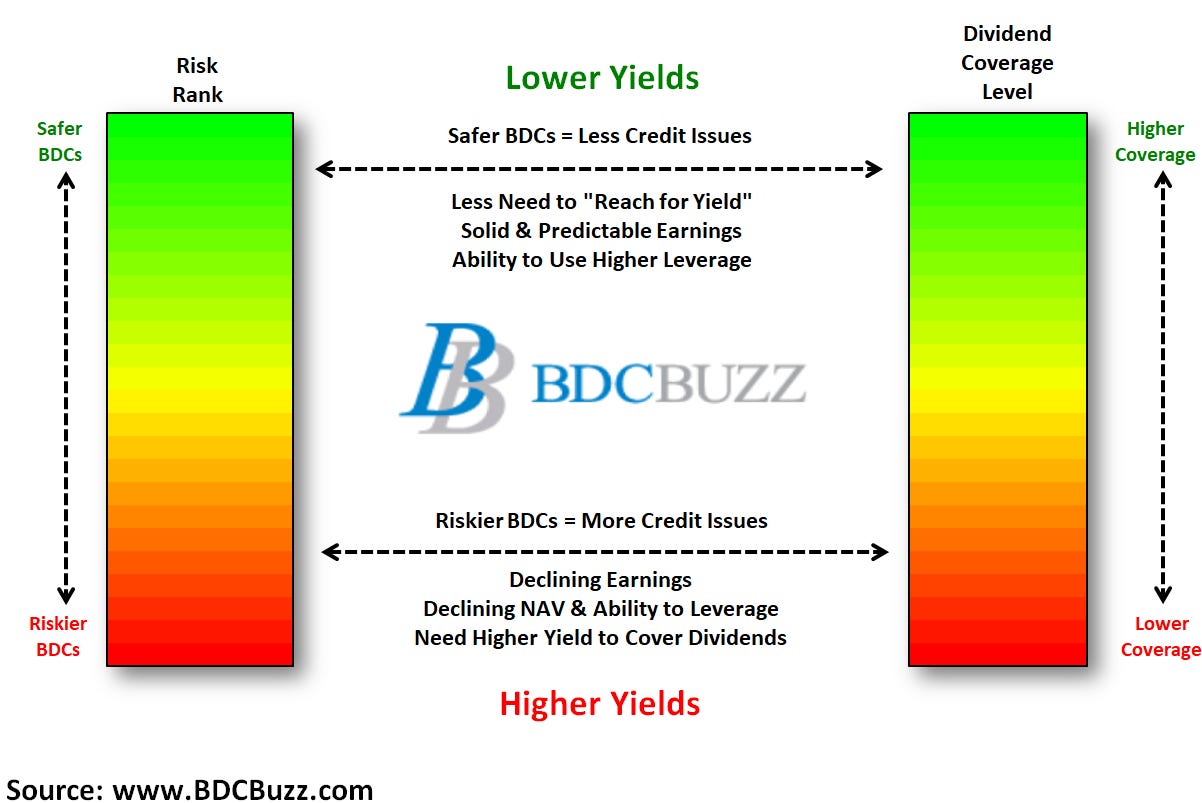
This information was previously made available to subscribers of Premium BDC Reports. BDCs trade within a wide range of multiples driving higher and lower yields mostly related to portfolio credit quality and dividend coverage potential (not necessarily historical coverage). This means investors need to do their due diligence before buying including setting target prices using the portfolio detail shown in this article (at a minimum) as well as financial dividend coverage projections over the next three quarters as discussed earlier.