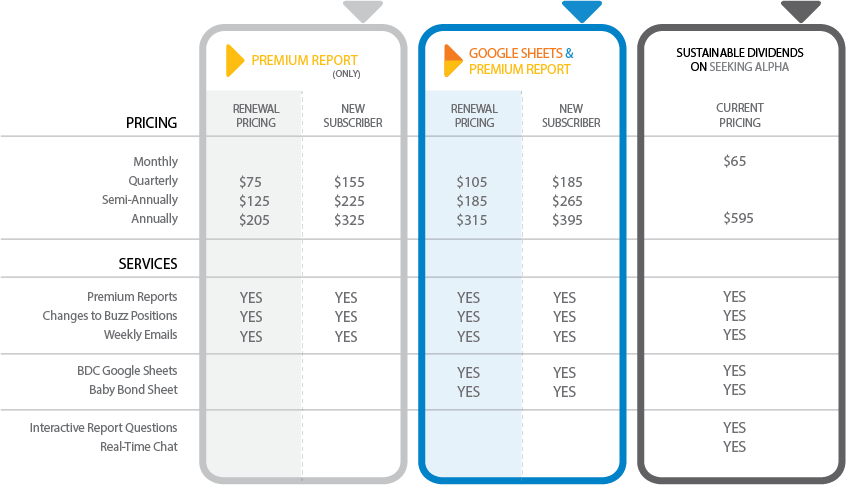
2024 New Subscriber Options
| PRICING |
|---|
| Monthly |
| Through June 30, 2024 |
| Through September 30, 2024 |
| Through March 31, 2025 |
| SERVICES |
| Deep Dive Reports (for each BDC) |
| Weekly BDC Sector Updates |
| Rankings & Comparison Reports |
| BDC Google Sheets |
| Real-Time Buying Recommendations |
| Investment Grade BDC Bond Sheets |
| BDC Baby Bond Rankings & Sheets |

| CURRENT PRICING |
|---|
| Email Us |
| $95 |
| $185 |
| $345 |
| YES |
| YES |
| YES |
| No |
| No |
| No |
| No |

| CURRENT PRICING |
|---|
| Email Us |
| $125 |
| $240 |
| $395 |
| YES |
| YES |
| YES |
| YES |
| YES |
| YES |
| YES |
PREMIUM
BDC REPORTS ONLY
GOOGLE SHEETS
PREMIUM REPORTS:
PREMIUM REPORTS
Individual BDC Deep Dive Reports
(16 to 30 pages for each BDC, updated quarterly) – Taking into account updated portfolio intelligence, operating results, latest debt and equity offerings as well as any preliminary results released by the company. I first focus on changes that might negatively impact portfolio credit quality and dividend coverage making updated recommendations (if needed) before markets open the next day. These reports include:
- Recent and upcoming portfolio credit issues
- Discussions of any changes to risk profile, dividend coverage, quality of management and fee agreements, borrowing facilities, etc.
- Pricing chart showing methods of pricing and my previous purchases (if applicable)
- Base case projections over the next three quarters
- Best and worst case scenarios/projections
- Potential for dividend changes (increased/decreased) and/or special dividends
- Interest rate sensitivity analysis (100, 200, 300 basis points)
- Leverage and lower yield dividend coverage analysis (based on current capital structure)
- Future equity and debt offering forecasts
- Recent insider purchases
Special Reports
Address specific issues or provide general rankings and side-by-side analysis:
Suggested BDC Portfolios
- Risk-averse
- Total return
- Recommended higher yield
- High-yield
Overall BDC ranking Tiers
- Risk (portfolio credit quality and vintage, quality of management, historical credit and NAV performance, portfolio diversification, repayment exposure, rate sensitivity, effective leverage ratios, the “need to reach for yield” to sustain dividends)
- Profitability (historical and projected dividend coverage, yield compression sustainability, prepayment potential, recurring vs. onetime income, PIK vs. cash, NII growth/decline, operational cost efficiency)
- Return (regular and special dividends, sustainable and growing, NAV growth)
- Valuation (NAV, earnings, growth rates, total return, appropriate yields)
Dividend Coverage Levels
- Base, best and worst case performance scenarios
- Optimal leverage and portfolio yield analysis
- Fee structures, operational and borrowing expenses
- Historical performance
BDC Pricing & Charts
- Appropriate yield for risk and dividend coverage levels
- NAV and earnings multiples
- Risk-adjusted total returns
BDC Risk Profiles
- Portfolio vintage analysis, industry sector exposure, and concentration issues
- Comparison of “true” first-lien
- Exposure to subordinated debt and structured products (CLOs and SLPs)
- Quality of management measures
- Shareholder alignment and fee structures
- Top 10 investments concentration risk
- Strong dividend coverage vs. “reaching for yield”
- Recent/historical credit performance and changes to NAV
- “Total Return Hurdle” fee structures
- Internally managed
Interest Rate Sensitivity Comparison
- Compares the impact to each BDC for 100, 200, 300 basis point rate increases
My Personal BDC Positions
- Current holdings and allocations
- Real-time announcements of changes to my portfolio
- Potential upcoming purchases/sales and pricing
- List of previous changes to my portfolio
New BDCs Added To Coverage
- In-depth and early analysis for subscribers with pricing, projections, risk, and returns before discussing in public articles
There are currently around 40 reports available including full analysis for 25 BDCs (currently AINV, ARCC, BXSL, CGBD, CSWC, FDUS, FSK, GAIN, GBDC, GLAD, GSBD, HTGC, MAIN, MCC, MRCC, NMFC, OCSL, ORCC, PFLT, PNNT, PSEC, SUNS, TCPC, TCRD, TPVG, and TSLX).
BDC GOOGLE SHEETS
There are currently 26 BDCs included:
AINV, ARCC, BBDC, CGBD, CSWC, FDUS, FSK, GAIN, GBDC, GLAD, GSBD, HTGC, MAIN, MCC, MRCC, NMFC, OCSL, ORCC, PFLT, PNNT, PSEC, SUNS, TCPC, TCRD, TPVG, and TSLX
Also included are the following Preferred Stocks and Baby Bonds:
GAINL, GAINM, GLADD, GLADN, AFC, CPTAG, CPTAL, CSWCL, FDUSL, FDUSZ, GECCL, GECCM, HCXY, HCXZ, MCV, MCX, MRCCL, NEWTI, NEWTL, NMFX, OCSLL, OSLE, PBB, PBC, TCRW, TCRZ, TPVY
SAMPLE VIEWS:
- Currently, there are various worksheets as shown below including Suggested BDC Portfolios, BDC Ranking Tiers, and Baby Bonds. BDC pricing can be volatile and Google Sheets tracks real-time changes to pricing compared to my price targets so that investors can make quick decisions.
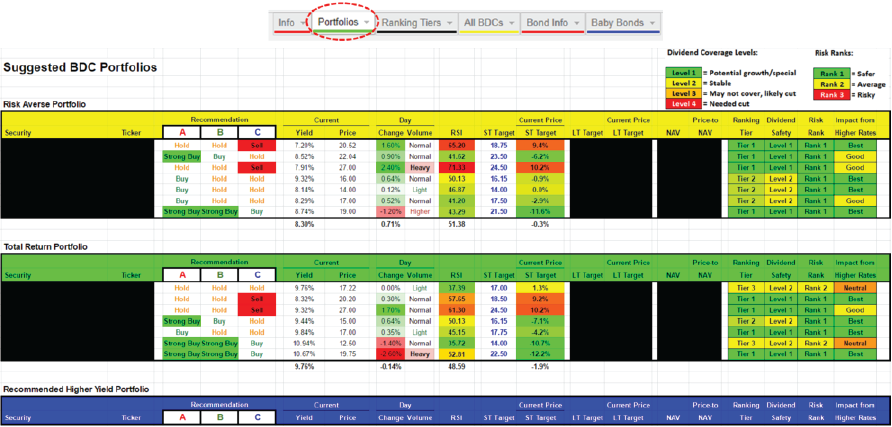
- Recommendation Categories: After investors have identified BDCs that fit their risk profile, I categorize investors’ needs for each BDC holding using the following:
DESCRIPTIONS:
- Investors looking to start a position. Dipping your toe in.
- Investors looking to grow a position to an appropriate allocation.
- Investors looking to opportunistically add to a position beyond an appropriate allocation.
GOALS:
- Mostly for dividend income.
- Dividend income + 5% capital gains within 12 months.
- Dividend income + 10% capital gains within 12 months.
- This is for investors that do not currently have a meaningful position in a certain BDC and would like to “dip their toe in” with a starter position and then continue to buy more on the dips. I suggest buying a small number of shares closer to its short-term target price.
- This s for investors that already have smaller positions and would like to grow them to a full/proper allocation for a diversified portfolio. I suggest adding to these positions at prices closer to 5% below its short-term target price potentially after equity offerings as discussed in previous articles.
- This is for investors that already have full positions and would likely only add at opportunistic prices of around 10% below target prices potentially during general market volatility and pullbacks. Active traders might choose to sell these shares for capital gains at a later date to re-balance the portfolio.
Relative Strength Index (RSI):
“The relative strength index (RSI) is a momentum indicator developed by noted technical analyst Welles Wilder, that compares the magnitude of recent gains and losses over a specified time period to measure speed and change of price movements of a security. It is primarily used to attempt to identify overbought or oversold conditions in the trading of an asset. Traditional interpretation and usage of the RSI is that RSI values of 70 or above indicate that a security is becoming overbought or overvalued, and therefore may be primed for a trend reversal or corrective pullback in price. On the other side of RSI values, an RSI reading of 30 or below is commonly interpreted as indicating an oversold or undervalued condition that may signal a trend change or corrective price reversal to the upside.”
This is a complicated formula because it takes into account changes in daily pricing over a rolling 365 days which takes time to process (as the price changes). I have not found this indicator available in table format with other online services.
I have color coded the RSI values with green showing closer to 30 (indicating oversold), yellow showing near 50 and red showing closer to 70 (indicating overbought). I include a chart with stock pricing and RSI in the Deep Dive Reports on each BDC and I have made many purchases (for safer BDCs) when RSI is closer to 30.

Trading Volume:
I have found a way to measure the average volume being traded for all BDCs to see if it is an active or slow trading day for the sector and then look at individual BDCs to see if they are trading above or below that average (given the time of day).
This is important because investors should know when volumes might be indicating something meaningful is going on with the stock, whether positive or negative.
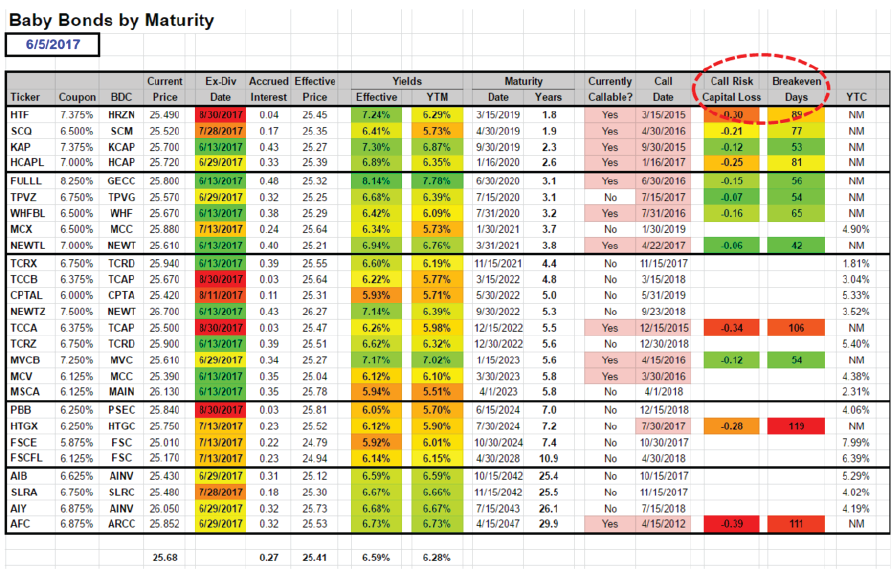
“Baby Bond” Sheet:
- Investors should use limit orders when purchasing exchange-traded debt such as Baby
Bonds. - BDC Baby Bonds trade “dirty” which means that there is a certain amount of accrued
interest in the market price. I have included the amount of accrued interest that updates - You need to own the Baby Bond one trading day before the ex-dividend date to be
eligible for the full quarter of interest. - It is important to take into account which BDCs are “callable” and the potential for
capital losses during the worst case scenario. - The Call Risk Capital Loss column refers to the worst case scenario of a bond being
called tomorrow (if currently callable) and takes into account 30 days of additional
interest accrued before being redeemed. See below. - Breakeven Days refers to the number of days of interest needed to break-even given
the current market price. See below. Type your paragraph here.