Owl Rock Capital (ORCC) Technical Selling From Pre-IPO Shares

The following is from the ORCC Deep Dive that was previously provided to subscribers of Premium BDC Reports along with revised target prices, dividend coverage and risk profile rankings, potential credit issues, earnings/dividend projections, quality of management, fee agreements, and my personal positions for all business development companies (“BDCs”).


Annotation 2020-01-26 193509


Owl Rock Capital Corporation (ORCC) Pre-IPO Share Lock-Ups

As mentioned in previous updates, there is the possibility of technical selling pressure on the stock price as pre-IPO shares start to become available in 2020 including most recently on January 14, 2020 (see below).

This was discussed on the previous earnings calls and management mentioned that they communicate with their larger shareholders frequently and expect that they will continue to support the stock.

  • The Company’s common stock began trading on the New York Stock Exchange (“NYSE”) under the symbol “ORCC” on July 18, 2019.
  • As of October 30, 2019, ORCC had 389,155,516 shares of common stock outstanding.

Following our IPO, without the prior written consent of our Board:

for 180 days, a shareholder is not permitted to transfer (whether by sale, gift, merger, by operation of law or otherwise), exchange, assign, pledge, hypothecate or otherwise dispose of or encumber any shares of common stock held by such shareholder prior to the date of the IPO = January 14, 2020

for 270 days, a shareholder is not permitted to transfer (whether by sale, gift, merger, by operation of law or otherwise), exchange, assign, pledge, hypothecate or otherwise dispose of or encumber two-thirds of the shares of common stock held by such shareholder prior to the date of the IPO = April 13, 2020

for 365 days, a shareholder is not permitted to transfer (whether by sale, gift, merger, by operation of law or otherwise), exchange, assign, pledge, hypothecate or otherwise dispose of or encumber one-third of the shares of common stock held by such shareholder prior to the IPO = July 17, 2020

This means that, as a result of these transfer restrictions, without the consent of our Board, a shareholder who owned 99 shares of common stock on the date of the IPO could not sell any of such shares for 180 days following the IPO; 181 days following the IPO, such shareholder could only sell up to 33 of such shares; 271 days following the IPO, such shareholder could only sell up to 66 of such shares and 366 days following the IPO, such shareholder could sell all of such shares.

Annotation 2020-01-26 194257

ORCC Share Repurchase Plan:

On January 14, 2020, ORCC sent a notice to its shareholders discussing its $150 million share repurchase plan to repurchase of shares below book value:

“Dear Shareholders: As required by Section 23(C)(1) of the Investment Company Act of 1940, we are reminding you that the Board of Directors of Owl Rock Capital Corporation has authorized a stock repurchase program (the “Company 10b5-1 Plan”) to acquire up to $150 million in the aggregate of ORCC’s outstanding common stock. Subject to its terms and conditions, the Company 10b5-1 Plan requires Goldman Sachs & Co. LLC, as ORCC’s agent, to repurchase shares of common stock on ORCC’s behalf when the market price per share is below the most recently reported net asset value per share (“NAV”). ORCC’s most recently reported NAV is $15.22 as of September 30, 2019. The purchase of shares pursuant to the Company 10b5-1 Plan is intended to satisfy the conditions of Rule 10b5-1 and Rule 10b-18 under the Exchange Act, and will otherwise be subject to applicable law, including Regulation M, which may prohibit purchases under certain circumstances. Please see ORCC’s public disclosure for additional information about the Company 10b5-1 Plan. The Company 10b5-1 Plan commenced on August 19, 2019 and will terminate upon the earliest to occur of 18-months (tolled for periods during which the Company 10b5-1 Plan is suspended), the end of the trading day on which the aggregate purchase price for all shares purchased under the Company 10b5-1 Plan equals $150,000,000 and the occurrence of certain other events described in the Company 10b5-1 Plan. To date, no purchases have been made under the Company 10b5-1 Plan.

On July 7, 2019, the Board approved its 10b5-1 Repurchase Plan, to acquire up to $150 million in stock at prices below NAV per share starting August 19, 2019, ending on February 19, 2021 or “as the approved $150 million repurchase amount has been fully utilized.”

“In connection with our IPO, we instituted a 10b5-1 buyback program. As a refresher, this program went into effect shortly after our IPO and is a programmatic plan. It’s not discretionary, and it’s not subject to blackout windows. The plan is administered by Goldman Sachs and starts buying a share of the average daily trading volume below NAV. The size of the plan is $150 million, and it is for an initial 18-month term. We take this buyback plan into consideration when we review our target leverage and liquidity profile. Since the program went into effect, we have not bought back any shares as our trading level has been above our net asset value and IPO price.”

Owl Rock Capital Corporation (ORCC) is the second-largest publicly traded BDC (much larger than MAIN, PSEC, GBDC, NMFC, and AINV) with investments in 96 portfolio companies valued at $8.3 billion that are mostly first-lien secured debt positions. On July 22, 2019, ORCC closed its initial public offering (“IPO”), issuing 10 million shares of its common stock at a public offering price of $15.30 per share. Net of underwriting fees and offering costs, the company received total cash proceeds of $141.3 million. ORCC is one of the few BDCs rated by all of the major credit agencies. The common stock began trading on the NYSE under the symbol “ORCC” on July 18, 2019.


This information was previously made available to subscribers of Premium BDC Reports, along with:

  • ORCC target prices and buying points
  • ORCC risk profile, potential credit issues, and overall rankings
  • ORCC dividend coverage projections and worst-case scenarios
  • Real-time changes to my personal portfolio

To be a successful BDC investor:

  • As companies report results, closely monitor dividend coverage potential and portfolio credit quality.
  • Identify BDCs that fit your risk profile.
  • Establish appropriate price targets based on relative risk and returns (mostly from regular and potential special dividends).
  • Diversify your BDC portfolio with at least five companies. There are around 50 publicly traded BDCs; please be selective.

THL Credit (TCRD) Dividend Coverage & Risk Profile Update

The following is from the TCRD Deep Dive that was previously provided to subscribers of Premium BDC Reports along with revised target prices, dividend coverage and risk profile rankings, potential credit issues, earnings/dividend projections, quality of management, fee agreements, and my personal positions for all business development companies (“BDCs”).


Annotation 2020-01-26 184118


TCRD Dividend Coverage & Risk Profile Update

For Q3 2019, THL Credit (TCRD) hit its base-case projections with lower-than-expected portfolio growth offset by higher-than-expected portfolio yield covering its dividend by 106% due to continued fee waivers. It should be noted that if the company paid the full incentive fee, the dividend would not have been fully covered as shown in the ‘Pro-Forma’ column below. However, management will likely continue to waive fees as it grows the portfolio using higher leverage and rotating out of non-income producing assets to fully cover the dividend.

“We’re not anticipating taking an incentive fee given the losses that we’ve incurred during the portfolio for the remainder of 2020. So we think the dividend itself is sized accordingly and is okay. To the extent, the portfolio itself has been diversified enough to enable us to add more leverage, I think, the leverage that we put on the system would enable us to potentially earn an incentive fee in the future and still cover the dividend.”

On June 14, 2019, shareholders approved increased leverage and management intends to use partially to repurchase shares as well as grow and diversify the portfolio:

“Since our shareholders approved the reduced asset coverage requirement earlier this year, we have the ability to take on increased leverage. Our plan is to target modest leverage levels of 1.05 to 1.15 range in 2020 subject to successfully amending our credit facility. This will allow us to continue to diversify and grow the portfolio.”

—————–

TRCD previously implemented a $15 million 10b5-1 stock repurchase plan and has been repurchasing shares “at levels that are accretive to shareholders with proceeds from exits of additional control equity positions this year”. During Q3 2019, the company repurchased 0.8 million shares at an average price of $6.70 (21% discount to previous NAV). The company continues to repurchase shares especially given that the stock is now trading 24% below NAV/book value:

“Since we initiated this plan in March 2019, we have repurchased $13.7 million of our stock or 91% of the target plan at a substantial discount to NAV. Repurchases in Q3 were accretive to book value by $0.05 per share. At the current repurchase plan in place, we expect to hit the $15 million amount by the end of the next month at which point we will reevaluate a new plan.”

“As there is still a dislocation between our book value and our stock price we’ll continue to aggressively buyback stock and accrete that to our shareholders as a good use of capital. The proceeds from Copperweld, one of our most concentrated positions at over 7% of the portfolio as of June can now be deployed across several new investments was to improve the overall diversity of the portfolio and may also be used for additional share buybacks under our $15 million 10b5-1 Stock Repurchase Plan.”

Undistributed taxable income increased from $0.29 per share to $0.31 per share.


The company continues to ramp its THL Credit Logan JV from $257 million as of December 31, 2017, to $352 million as of September 30, 2019. However, the yield recently declined from 14.1% to 10.7% as shown in the following chart:


TCRD’s net asset value (“NAV”) per share has declined by almost 30% over the last three years due to having previous investments in higher-risk assets that underperformed. During Q3 2019, its NAV per share declined by another $0.15 or 1.8% (from $8.49 to $8.34) due to net realized/unrealized depreciation of $6.6 million or $0.21 per share. TCRD recognized realized losses of $7.7 million, mostly related to a realized loss of $24.6 million in connection with the liquidation of Charming Charlie, offset by a realized gain of $16.7 million from its investment in Copperweld Bimetallics LLC.

Most of the unrealized depreciation was due to a write-down of Holland Intermediate Acquisition Corp. and Logan JV, offset by reversals from Charming Charlie and Copperweld Bimetallics.

“Holland is a first lien investment and one of our three remaining energy credits. The business continued to face market headwinds this quarter due to overall reduced M&A activity in the energy space and was marked down accordingly. We’re very pleased with the results of our Copperweld exit this quarter. Copperweld is one of our control equity positions was originally an unsponsored deal that we took through and restructured in 2016. With managerial changes and the retention of an advisor, operations were stabilized and EBITDA grew, positioning the company for a sale. Cash proceeds received in dollars escrow totaled $35 million which were 1.6 times our original investment and a $1.5 million mark up from June 30. The total return on this investment, including interest and dividends was 3.2 times our original investment.”

It should be noted that TCRD is considered higher-risk as shown in the BDC Risk Profiles report and has a larger amount of investments that are considered ‘watch list’ currently over 15% of the portfolio fair value (similar to MRCC and PNNT) implying that there will likely be additional NAV declines.


Over the last two quarters, non-accruals have decreased from 12.4% to 3.2% of the portfolio at cost but remain around 2.0% at fair value due to Loadmaster Derrick & Equipment that remains on non-accrual status.

4 – The portfolio investment is performing materially below our underwriting expectations and returns on our investment are likely to be impaired. Principal or interest payments may be past due, however, full recovery of principal and interest payments are expected.

5 – The portfolio investment is performing substantially below expectations and the risk of the investment has increased substantially. The company is in payment default and the principal and interest payments are not expected to be repaid in full.

The company has been working to re-positioning its portfolio, including reducing the amount of non-income producing equity investments to 2% of the portfolio and 87% invested into Core Assets (first-lien debt and Logan JV) with a stated goal of 90%.

Christopher Flynn, CEO: “Over the past year, we have made significant progress on our strategic objectives across four dimensions— shifting the composition of our portfolio into primarily first lien floating rate assets, reducing our concentrated positions, increasing our investment in the Logan JV, and exiting our non-income producing securities. We remain confident that the steps we are taking to reduce risk in our portfolio will result in a more diversified senior secured floating rate portfolio that is positioned to deliver more stable and predictable returns for our shareholders over the long term.”

—————–

However, this has resulted in lower overall portfolio yield as shown below:


As mentioned in the previous report, the Advisor decided to waive additional incentive fees through the end of 2019, as well as to lower the base management fee to “more closely align with what it believes is appropriate for a first lien floating rate portfolio”. I believe that the new fee structure is very shareholder-friendly for the following reasons:

  • Annual hurdle remains 8% (this is important as discussed in other reports)
  • Total return hurdle remains (also important and best-of-breed)
  • Base management fee reduced from 1.5% to 1.0% (this is among the lowest)
  • Incentive fee reduced from 20.0% to 17.5%
  • Deferral of PIK and non-cash items until realized


This information was previously made available to subscribers of Premium BDC Reports, along with:

  • TCRD target prices and buying points
  • TCRD risk profile, potential credit issues, and overall rankings
  • TCRD dividend coverage projections and worst-case scenarios
  • Real-time changes to my personal portfolio

To be a successful BDC investor:

  • As companies report results, closely monitor dividend coverage potential and portfolio credit quality.
  • Identify BDCs that fit your risk profile.
  • Establish appropriate price targets based on relative risk and returns (mostly from regular and potential special dividends).
  • Diversify your BDC portfolio with at least five companies. There are around 50 publicly traded BDCs; please be selective.

New Mountain Finance (NMFC) Dividend Coverage & Risk Profile Update

The following is from the NMFC Deep Dive that was previously provided to subscribers of Premium BDC Reports along with revised target prices, dividend coverage and risk profile rankings, potential credit issues, earnings/dividend projections, quality of management, fee agreements, and my personal positions for all business development companies (“BDCs”).


Annotation 2020-01-26 043006


NMFC Recent/Previous Insider Purchases:

In Q3 2019, management was purchasing additional shares at lower prices of around $13.25 to $13.52 per share.

Steve Klinsky, Founder, CEO and Chairman: “I and other members of New Mountain continue to be very large owners of our stock, with aggregate ownership of 10.5 million shares today, inclusive of the 400,000 shares purchased in our most recent equity issuance.”


NMFC Dividend Coverage Update:

NMFC has consistently covered its dividend since its IPO with mostly “cash income generated by stable and predictable sources” as shown below.

“As slide 27 demonstrates our total investment income is recurring in nature and predominately paid in cash. As you can see, 95% of total investment income is recurring and cash income remains strong at 87% in this quarter. We believe this consistency shows the stability and predictability of our investment income”

As discussed in previous reports and shown below, income from recurring sources (including its SLPs) has increased over the previous quarters and accounted for 95% of total income in Q3 2019. However, there was a decline in the amount of income from its fully ramped its NMFC Senior Loan Program III LLC (“SLP III”):

—————–

The company was firmly above its previous targeted leverage that was recently increased due to shareholder approval to increase leverage (effective June 9, 2018). The company previously amended its credit facility and note agreements to include a requirement that the company does not exceed a total debt-to-equity ratio of 1.65 to 1.00. However, management is targeting a statutory debt-to-equity ratio between 1.20 and 1.40 depending on the amount of first-lien debt as a percentage of the total portfolio and I have taken into account with the updated projections.

“We have seen significant growth in the portfolio over the last year as we have increased our statutory leverage from 0.81 to 1.20, inclusive of our October equity offering. Consistent with the strategy we articulated when we received shareholder authorization to increase leverage, the preponderance of our asset increase has been in the form of senior loans. The step-up in leverage over the past three quarters is in line with our new target statutory debt to equity ratio of 1.2 times to 1.4 times.”

“Our mix of originations continues to skew meaningfully towards first lien loans, accounting for 73% of total new originations this quarter. Our sales and repayments were balanced evenly between first and second lien assets. Overall, our Q3 mix showed a continued shift towards first lien assets, consistent with our stated plan to avoid increased portfolio level leverage with a more senior-oriented asset mix.”

As mentioned earlier, on October 25, 2019, NMFC completed its offering of 9.2 million shares at a price of $13.25 per share. The Investment Adviser paid a $0.35 per share portion of the $0.41 per share underwriters’ sales load for net proceeds of $13.60 per share or $125 million. NMFC had around $122 million of originations and commitments since the end of Q3 2019through November 1, 2019, and management is expecting to fully invest in the proceeds from recent equity offering:

Robert Hamwee, CEO, commented: “The third quarter represented another strong quarter of performance for NMFC. We originated $452 million of investments and once again had no new investments placed on non-accrual. Additionally, after our recent equity raise in October, we anticipate remaining fully levered in the fourth quarter.”

“Page 19 shows our continued origination momentum since the end of the quarter, where we have invested $122 million in new transactions, with $89 million of sales and repayments. Notable post quarter end transactions included a new net lease deal originated in our REIT subsidiary and 2 new loans purchased in our SBIC investing program, which we continue to expand.”

“For Q4 pace of originations for the balance of the quarter, we wouldn’t expect Q4 to be as heavily — origination Q3. I think that was an idiosyncratically very strong quarter. But we do have a robust pipeline, as John mentioned, and we’d certainly expect to see significant addition to the portfolio through the end of the year.”

“On October 8, 2019, the SEC issued an exemptive order (the “New Order”) permitting us and certain of our affiliates to co-invest together in portfolio companies subject to certain conditions included therein. The New Order supersedes our existing co-investment exemptive order, which was granted by the SEC on December 18, 2017, and expands on our ability to co-invest with certain affiliates.”

—————–

On October 16, 2019, the company entered into a Joinder Agreement pursuant to which Hitachi Capital America Corp. was added as a lender under the DB Credit Facility for an aggregate commitment of $20 million thereby increasing the aggregate commitments under the DB Credit Facility from $210 million to $230 million.

“Taking into account SBA-guaranteed debentures, we had over $2 billion of total borrowing capacity at quarter end. During Q3, we successfully upsized both our Wells Fargo and Deutsche Bank credit facilities by $80 million and $60 million, respectively. Finally, on Slide 30, we show our leverage maturity schedule. As we’ve diversified our debt issuance, we have been successful at laddering our maturities to better manage liquidity. We currently have no near-term maturities.”

On August 12, 2019, NMFC amended and increased its Deutsche Bank Credit Facility from $150 million to $210 million. There will likely be additional issuances of unsecured notes similar to the $52 million at 5.75% due October 2023 publicly traded under the symbol “NMFX” that are included in the BDC Google Sheets.

As of September 30, 2019, the company had cash equivalents of almost $70 million and over $211 million of available borrowing capacity under its credit facility and SBA debentures.

—————–

For Q3 2019, NMFC reported near its best-case projections with another quarter of active portfolio growth fully covering its dividend since its IPO. The company continues to increase its use of leverage to offset the impact from lower portfolio yields.

“NMFC’s asset-level portfolio yield has declined since Q1 due to the downward shift in the LIBOR and 20 basis points of the decline is due to the aforementioned shift towards first-lien in assets. We have offset this decrease in asset-level yield, primarily through our proactive strategy of increasing portfolio-level leverage. While we are mindful of the potential continued decrease in LIBOR, we remain comfortable with our portfolio yield which solidly supports our quarterly dividend.”

—————–

“First, we look at realized gains and realized credit and other losses. As you can see looking at the row, highlighted in green, we’ve had success generating real economic gains every year through a combination of equity gains, portfolio company dividends and trading profits. Conversely, realized losses, including default losses, highlighted in orange, have generally been smaller and less frequent, and show that we are typically not avoiding nonaccruals by selling poor credits at a material loss prior to actual default. As highlighted in blue, we continue to have a net cumulative realized gains, which currently stands at $18 million. Looking further down the page, we can see that cumulative net unrealized depreciation, highlighted in gray, stands at $58 million, and cumulative net realized and unrealized loss, highlighted in yellow, is at $40 million. The net result of all this is that in our over 8 years as a public company, we have earned net investment income of $674 million against total cumulative net losses, including unrealized, of only $40 million.”

There is the potential for increased earnings in the coming quarters with additional leverage available through its previously approved second SBIC license, additional SLPs and the continued ramp of its real-estate entity “Net Lease” structured as a REIT. Its SLPs currently account for 7% of the portfolio with expected returns between 11% and 13% and its Net Lease accounts for around 4% of the portfolio with expected returns in the “low-to-mid teens”.


NMFC Risk Profile Update:

For the fifth quarter in a row, and for 10 out of the last 11 quarters, there were no new non-accruals in the portfolio. Previously, its first-lien positions in Education Management (“EDMC”) were placed on non-accrual status as the company announced its intention to wind down and liquidate the business. As of September 30, 2019, the company’s investments in EDMC had a cost basis of $1.0 million and fair value of $0.0 million. Portfolio credit quality remained stable with only EDMC (0% of the portfolio) with an investment rating of “4”. An investment rating of a “4” includes non-accruals or investments that could be moved to non-accrual status, and the final development could be an actual realization of a loss through a restructuring or impaired sale.


For Q3 2019, net asset value (“NAV”) per share decreased by $0.06 or 0.3% from ($13.41 to $13.35) due to markdowns of previously discussed investments including its equity investments in UniTek Global Services (similar to Q2 2019) and was discussed on the recent call:

“The new name on the list is the previously restructured Unitek representing 2 different securities, CL and CN, for a few operational missteps led to weaker financial results in 2019, but where secular trends continue to be strong in the company’s key operating division, providing us with optimism for improvement in 2020.”


Management also discussed UniTek on the previous call:

Q. “UniTek seem to have been a driver this quarter unrealized markdowns, is there any key shift I know you’ve been — this has been obviously a longstanding name that has required attention.”

A. “Yeah. I mean, the high-level color is it’s nothing that we think has any impact on the long-term realizable value of UniTek. There were a couple of operating hiccups at the company in the last quarter. And we try to be sort of real time from a valuation perspective, and in fact as a percentage of the overall position, even the change wasn’t bad meaningful. But we don’t think anything that’s happened there as any impact on our long-term ability to recognize and create value there as one of our kind of key equity portfolio companies. Obviously update everybody and as that evolves.”

Brave Parent Holdings which provides security software solutions was added to the watch list and marked down during Q3 2019 to 95% of cost. The company was recently rated by Moody’s and needs to be ‘watched’ due to high leverage and “execution risk surrounding the integration and restructuring activities related to the recent BeyondTrust and Avecto acquisitions”:

Moody’s Investors Service: “Brave Parent Holdings, Inc.’s (“BeyondTrust”) B3 Corporate Family Rating is constrained by its high financial risk profile, due in part by its very high leverage following the LBO, Avecto and BeyondTrust acquisitions. The rating also reflects the highly competitive privileged access management (“PAM”) market, along with execution risk surrounding the integration and restructuring activities related to the recent BeyondTrust and Avecto acquisitions. However, the rating is supported by BeyondTrust’s leading market position in the PAM and secure remote support markets, along with the strong track record of organic growth. Additionally, the company’s strong retention rates and recurring revenue allow for healthy free cash flow generation.”

NMFCs’ ‘watch list’ is around 8% of the portfolio and includes previously discussed investments including NHME Holdings, Permian Holdco, Ansira Holdings, AAC Holding, PPVA Black Elk, ADG LLC, and Sierra Hamilton. Many of these investments were marked during the quarter including PPVA that remains in a “liquidating trust” and was discussed on the recent call including being valued at 74% of cost which “reflects the midpoint of likely scenarios”:

“Credit performance continues to be strong, with material quarter-over-quarter credit deterioration in only one significant name, PPVA, which has effectively been an ongoing liquidating trust under Cayman law for a number of years, and which has been added to our internal watch list as a 3. As our one significantly troubled asset, we continue to spend a lot of time attempting to maximize our recoveries from the PPVA entity to state. Given the complex mix of underlying assets and litigation claims, while we believe our valuation of $0.74 currently fairly reflects the midpoint of likely scenarios, significant volatility exists around the midpoint.”

The markdowns for UniTek, Brave Parent, and PPVA were partially offset by a markup in Edmentum Ultimate Holdings that was previously restructured and “operating results and enterprise value continue to meaningfully improve”:

“There are currently three names that have had negative migration of 2.5 turns or more. Two are names we have discussed for many previous quarters, the previously restructured Edmentum, where operating results and enterprise value continue to meaningfully improve.”

Its investment in NHME was previously on non-accrual and then restructured in November 2018 resulting in a material modification of the original terms and an extinguishment of its original investments in NHME driving a realized loss. As a result of the restructuring, NMFC received second lien debt in NHME and common shares. In addition, NMFC funded additional second lien debt and received warrants to purchase common shares for this additional funding.


NMFC has oil/energy-related exposure of around 3% of the total portfolio including Tenawa Resource (large scale natural gas processing plant), Sierra Hamilton (provider of services to oil and gas industry) and Permian Tank (supplier of above-ground storage tanks and processing equipment to oil and gas exploration/production).

—————–

The company has a safer-than-average portfolio for many reasons including its focus on “defensive growth” middle-market companies and mostly secured debt investments of first and second-lien that account for 82% of the portfolio. Also, management has been forthcoming with information related to potential underperforming assets.

“We have a diversified portfolio with our largest investment at 3.3% of fair value, and top 15 investments accounting for 33% of fair value. We have added more position diversity in each of the last 4 quarters to decrease our risk to any one borrower.”

“Since the inception of our debt investment program in 2008, we have taken a New Mountain’s approach to private equity and applied it to corporate credit, with a consistent focus on defensive growth business models and extensive fundamental research with an industry that are already well known to New Mountain. Or more simply put, we invest in recession resistant businesses that we really know and really like. We believe that this approach results in a differentiated and sustainable model that allows us to generate attractive, risk adjusted rates of return across changing cycles and market conditions.”

As mentioned earlier, the company will likely invest in higher amounts of first-lien assets at lower yields, shifting the portfolio back to historical levels:

“Our mix of originations continues to skew meaningfully towards first lien loans, accounting for 73% of total new originations this quarter. Our sales and repayments were balanced evenly between first and second lien assets. Overall, our Q3 mix showed a continued shift towards first lien assets, consistent with our stated plan to avoid increased portfolio level leverage with a more senior-oriented asset mix.”

From previous call: “Our expectation is that the portfolio will be 50% first lien, 50% non-first lien plus or minus 10% in either direction, so 60/40 or 40/60. To be clear though irrespective of the rate environment or the spread environment we are not interested in increasing risk in the portfolio. Now, we have the view that there are second liens we do that are frankly less risky than first liens that we do.”

First-lien debt increased slightly to 55.5% (previously 52.3%) of the portfolio as the company “shifted originations towards senior investments as we have accessed incremental leverage”.

Out of $7.4 billion of investments in 282 portfolio companies, only 8 representing just $125 million of cost have migrated to non-accrual and only 4 representing $43 million of cost has resulted in a realized default loss (see below). The $43 million includes the previously discussed $15 million realized loss from NHME and another $28 million associated with its investment in Transtar Holding Company as discussed at the end of this report.


This information was previously made available to subscribers of Premium BDC Reports, along with:

  • NMFC target prices and buying points
  • NMFC risk profile, potential credit issues, and overall rankings
  • NMFC dividend coverage projections and worst-case scenarios
  • Real-time changes to my personal portfolio

To be a successful BDC investor:

  • As companies report results, closely monitor dividend coverage potential and portfolio credit quality.
  • Identify BDCs that fit your risk profile.
  • Establish appropriate price targets based on relative risk and returns (mostly from regular and potential special dividends).
  • Diversify your BDC portfolio with at least five companies. There are around 50 publicly traded BDCs; please be selective.


Monroe Capital (MRCC) Upcoming NAV Decline & Potential Dividend Cut

The following is from the MRCC Deep Dive that was previously provided to subscribers of Premium BDC Reports along with revised target prices, dividend coverage and risk profile rankings, potential credit issues, earnings/dividend projections, quality of management, fee agreements, and my personal positions for all business development companies (“BDCs”).


The following are excerpts from an article that will come out on Sunday, January 26, 2020.


Why Investors Are Selling 12% Yielding Monroe Capital

  • I have recently suggested to my subscribers to sell or at least trim current positions of MRCC and wait for the company to report Q4 results.
  • On January 7, the WSJ reported “Creditors are seeking to force ECA into chapter 11…filed papers claiming the company isn’t paying debts. ECA/NECB account for 3.1% of MRCC’s NAV.
  • Also, I’m expecting California Pizza Kitchen ($6.1 million or $0.30/share and 2.4% of NAV) to be placed on non-accrual status in Q4 2019 for the reasons discussed in this report.
  • My primary concerns are additional markdowns and non-accruals related to its ‘watch list’ that currently account for almost 18% of the portfolio and 46% of NAV.
  • On the last call, management was asked about “sustaining the current dividend” and mentioned “we’ll be in a much better position to respond to that question at the following quarter”.

The information used in this article was as of January 23, 2020, and pricing has changed as I suggested that subscribers of Premium BDC Reports to sell or at least trim current positions of MRCC and wait for the company to report Q4 results (see dates below). The stock was headed down on the morning of January 24, 2020:

Annotation 2020-01-26 200040


MRCC Risk Profile Update

MRCC was previously downgraded in my Risk Rankings due to continued credit issues including adding Education Corporation of America (“ECA”) to non-accrual status, previous markdowns of Rockdale Blackhawk and realized losses from TPP Operating, Inc. During Q3 2019, MRCC’s net asset value (“NAV”) decreased by $0.18 or 1.4% (from $12.52 to $12.34) mostly due to additional markdowns in previously discussed ‘watch list’ investments including Luxury Optical Holdings Co. and The Worth Collection that were added to non-accrual status during Q3 2019. Also added to non-accrual were its loans to Curion Holdings as its promissory notes were already on non-accrual. The total fair value of investments on non-accrual increased to $30.7 million and account for around 4.7% of the portfolio fair value and $1.50 per share or around 12.2% of NAV.

While we are pleased with the growth in our portfolio, an increase of $26.6 million during the quarter, and the continued coverage of our dividend by net investment income, we are not happy with the slight decline of 1.4% in our per share NAV. Over the past several quarters, we have seen some idiosyncratic credit issues with a few borrowers. We do not believe these isolated issues are representative of our portfolio as a whole. We feel we are on the right track in resolving some of these credit issues and we hope to be able to see the results of our efforts in the coming quarters.

Source:  MRCC Q3 2019 Results – Earnings Call Transcript 

Other non-accruals include Incipio, LLC third lien tranches, and Rockdale Blackhawk, LLC (“Rockdale”). However, the Curion promissory notes and the Incipio third lien tranches were obtained in restructurings during 2018 for no cost. The company has identified around $122 million or 18.6% of the portfolio as 4 and 3 ratings: “loan payments may be past due” or “may be out of compliance with debt covenants”. It should be noted that The Worth Collection was and still has an investment risk rating of 3 as discussed on the recent call:

Q. “What were the ratings on Worth and Luxury at the end of last quarter?”

A. “Worth was a 3-rated credit, which has not changed and Curion is a 4-rated credit, and Luxury Optical’s also a 4-rated credit, which has not changed.”

Source: MRCC Q3 2019 Results – Earnings Call Transcript

Another issue that needs to be watched is the amount of payment-in-kind (“PIK”) that continues to increase from 5.3% of total income in Q3 2018 to 9.4% during Q3 2019:

My primary concern is the potential for additional non-accruals and markdowns of the investments listed in the previous table that currently account for almost 18% of the portfolio and 46% of NAV per share. The worst-case projections take into account additional credit issues that could result in a dividend reduction of around 25% as discussed at the end.

We’re in an uncertain market and things are happening very often beyond our control as investors. And some of the things that happen from time to time that are beyond our control very really affect industries, in particular, companies in those industries, and it’s very hard to predict. So, we’re going to continue to do that, and we’ll be back to you next quarter with a report. Hopefully, we’ll see more stability in world affairs and other things that are happening that are the more uncontrollable factors.

Source: Previous MRCC Earnings Call

Education Corporation of America (“ECA”) was added to non-accrual status during Q4 2018 and MRCC’s series G equity portion was marked up by $1.6 million in Q3 2019 as shown in the previous table. However, this was partially offset by marking down its equity portion of New England College of Business (“NECB”). During Q2 2019, MRCC participated in a credit bid to acquire the assets of NECB, which was a subsidiary of ECA resulting in a 20.8% equity stake in NECB in exchange for a $1.5 million reduction of secured loan position in ECA as well as a follow-on revolver commitment to NECB. MRCC’s investments in ECA/NECB were valued at $7.7 million or $0.38 per share and 3.1% of NAV. Management discussed on the recent call:

on a net basis, it ended up around flat, when you think about the two pieces. And it really had to do with some — in the case of NECB, there was some buying interest in the company, which faded a little bit, which impacted the value negatively. And as applies to the ECA, it gets into a little bit of specifics, but there was a change in, sort of, how we calculated the recovery based on some negotiations with the trustee in that case, which impacted the value a little bit. But I think what we said in the past, which we continue to believe, is we don’t expect there to be much resolution on this case for some period of time because a lot of the recovery, particularly applied to ECA is related to some longer-term legal settlements that could be occurring.”

Source: MRCC Q3 2019 Results – Earnings Call Transcript

However, on January 7, 2020, the Wall Street Journal reported:

“Creditors are seeking to force defunct Education Corp. of America into chapter 11 more than a year after the for-profit college chain shut down, leaving roughly 20,000 students in the lurch. A lender, a landlord and a crisis communications firm filed papers in the U.S. Bankruptcy Court in Wilmington, Del., claiming the company isn’t paying its debts as they come due. Monroe Capital LLC, BSF Richmond LP and Reputation Partners LLC said in the filing they are owed a total of $3.0 million.”

Another investment that is included in MRCC’s watch list is California Pizza Kitchen, Inc. which was marked down in Q3 2019 but still valued at $6.1 million or $0.30 per share and 2.4% of NAV. Many of these locations have recently been closed often due to higher rents.

January 14, 2020 – Chicago’s Only California Pizza Kitchen Closes in River North: “International chain California Pizza Kitchen has closed its only city of Chicago restaurant inside the Shops at North Bridge, according to a recorded phone message, and wiped any mention of the 52 E. Ohio Street location from its website.”

October 20, 2019 – California Pizza Kitchen closes in Westbury, NY: “The Oct. 20 closure of the restaurant after 25 years of serving a variety of pizzas, soups, salads, pastas and more was confirmed by a restaurant representative, who said its “lease term has concluded.” No other details were provided.”

August 6, 2019 – California Pizza Kitchen Will Close Its Last Two Washington Locations on Thursday: “the 34-year-old franchise famous for its chicken barbecue pies — will close its locations in the Northgate Mall and Bellevue on Thursday, currently the only two CPK restaurants left in the entire state (there was another location in Tukwila that closed last year). A rep for the chain confirmed the news to Eater Seattle but did not reveal a reason for the closures. Those two particular branches ran into difficult circumstances: Northgate Mall is turning into a ghost town, and Bellevue’s rents continue to skyrocket.”

July 2019 – California Pizza Kitchen – Cherry Hill, NJ: “Pizza franchise California Pizza Kitchen closed its Cherry Hill Mall restaurant in July. A sign on the door said its “lease term has concluded. Now, the closest franchise of the nationwide chain is located on the outskirts of Philadelphia on City Avenue. The closest location in New Jersey is 48 miles away in Bridgewater.”

May 21, 2019 – California Pizza Kitchen’s Only Manhattan Location Will Close on Friday: “California Pizza Kitchen will stop serving its famed Barbecue Chicken pie in Midtown later this week. The 12-year-old branch will shut its doors on Friday, leaving zero outposts of the American pizza chain in Manhattan. The lease is up for the big, highly visible corner space at 440 Park Avenue South, on East 30th Street, and the rising costs are forcing it to close, a spokesperson says. “Despite our strong performance here, rising rent costs have simply become too high to continue in this specific location,” he says.

American Community Homes, Inc. was marked up slightly but remains discounted at 79% of cost and discussed on the recent call including the potential for improvement due to lower interest rates. Hopefully, this investment will be marked up in Q4 2019 offsetting likely markdowns including ECA, NECB, and California Pizza Kitchen.

“with our independent third-party value of the company this quarter, there was a belief that we shared that the company is improving and the valuation, therefore, on a fair value basis increased. The company has got a new management team in place. They are — they’re in the mortgage origination and mortgage servicing business for residential mortgages. So they’re impacted clearly in a negative way by the decline in rates as it applies to their MSR book, which is effectively an interest rate IO. But they benefit from an increase in refi volume on the origination side. So this company has a bit of a natural hedge. And they’ve taken advantage of the market and their turnaround strategy by bringing over additional teams, in most cases, at no cost into their origination engine, which drives both origination volume, therefore, fee income, as well as additional mortgage servicing rights, which have value that are valuable and can trade. So we’re just seeing some benefits, some trends that are positive. And that’s why this company’s mark went up, and that’s why this company is still on accrual status. And that’s why this company we think should continue to generate a positive recovery for us.”

Source: MRCC Q3 2019 Results – Earnings Call Transcript

MRCC Dividend Coverage Update

MRCC was previously downgraded due to continued credit issues driving increased reliance on fee waivers to cover its dividend. Over the last four quarters, the company has covered its dividend only due to the ability to use higher leverage through its SBIC license and management willing to waive incentive fees to ensure dividend coverage. Previously, MRCC had higher dividend coverage only due to the ‘total return requirement’ driving no incentive fees paid.

On November 4, 2019, the Board approved a change to the Investment Advisory Agreement to amend the base management fee structure:

Effective July 1, 2019, the base management fee is calculated initially at an annual rate equal to 1.75% of average invested assets (calculated as total assets excluding cash, which includes assets financed using leverage); provided, however, the base management fee is calculated at an annual rate equal to 1.00% of the Company’s average invested assets (calculated as total assets excluding cash, which includes assets financed using leverage) that exceeds the product of 200% and the Company’s average net assets. For the avoidance of doubt, the 200% is calculated in accordance with the asset coverage limitation as defined in the 1940 Act to give effect to the Company’s exemptive relief with respect to MRCC SBIC’s SBA debentures. This change has the effect of reducing the Company’s base management fee rate on assets in excess of regulatory leverage of 1:1 debt to equity to 1.00% per annum.

Source: SEC Filing

The reduced rate will not have a meaningful impact to dividend coverage as it only applies to regulatory leverage (debt-to-equity) over 1.00 which excludes SBA debentures. The new rate became effective in Q3 2019 and the management fee increased from $2.7 million to $2.8 million with a blended rate of around 1.67% compared to 1.75%. If management would have been paid the full fee of 1.75%, it would have been less than $0.1 million higher for the quarter implying that this is not a long-term solution for dividend coverage. As of September 30, 2019, MRCC had regulatory leverage of 1.29 which is near the high end of its targeted debt-to-equity ratio to 1.25 to 1.30:

We intended to go above 1:1 and continue to expect to grow our regulatory leverage over the next couple of quarters, I’d say. I don’t know where we’ll wind up. It really depends on how the portfolio shakes out in the new origination shakeout, but I’d say think of it as maybe up to 1.25 to 1.3 times kind of regulatory leverage as a next target.”

Source: MRCC Q3 2019 Results – Earnings Call Transcript

For Q3 2019, MRCC hit its base-case projections due to continued fee waivers to cover the current dividend. As shown below, dividend coverage would have been around 91% without fee waivers even after taking into account in the reduced base management fee.

The last four quarters of higher-than-expected portfolio growth have driven its debt-to-equity ratio from 0.89 to 1.75 and its regulatory debt-to-equity ratio (excluding SBA debentures) has increased from 0.46 to 1.29. MRCC’s leverage is now approaching the highest in the sector and is partly due to continued declines in NAV including another 1.4% in Q3 2019. However, dividend coverage has not improved due to additional non-accruals.

At the end of the quarter, our regulatory leverage was approximately 1.29 debt to equity. This is nearing the top end of the targeted leverage range we have guided you to on prior quarters. This higher level of leverage was temporary as we were aware of a couple of portfolio paydowns that were expected to close shortly after quarter end, which have since occurred. Since quarter end, both total assets, as well as our total leverage, have decreased with total repayments of $38.6 million received since September 30. We would expect to reinvest a portion of these prepayments in the fourth quarter of 2019.”

Source: MRCC Q3 2019 Results – Earnings Call Transcript

As mentioned earlier, my primary concern is the potential for additional non-accruals and markdowns of certain investments (including ECA, NECB, and California Pizza Kitchen) that currently account for almost 18% of the portfolio and 46% of NAV per share.

We continue to believe that our adjusted NII can cover our dividend assuming no other material changes in our portfolio.

Source: Previous MRCC Earnings Call

The worst-case projections take into account additional credit issues and could result in a dividend reduction of around 25%. On the last call, management was asked about “sustaining the current dividend” and mentioned “we’ll be in a much better position to respond to that question at the following quarter”:

Q. “Given all the headwinds, particularly the interest rate headwinds, do you think that the business model can sustain the current dividend? And management is willing to do whatever it takes to support the dividend through waivers and all that other stuff?”

A. “We’re going to look at everything here. But at the end of the day, we’re going to try and do what we can to generate the best overall returns for our shareholders, both in terms of dividends, NAV, value accretion. And we’ve got a couple of things that we’re going to work on in the next quarter. And I think we’ll be in a much better position to respond to that question at the following quarter. So I guess, just hold on to that.”

Source: MRCC Q3 2019 Results – Earnings Call Transcript

Also mentioned earlier, there has been a meaningful increase in the amount of non-cash payment-in-kind (“PIK”) interest income from around 5.3% to 9.4% and included many of the “watch list” investments discussed earlier

Source: SEC Filings

Summary & Recommendations

As shown in the Leverage Analysis below, the dividend is stable mostly only due to management waiving incentive fees to ensure dividend coverage.

However, if there are continued credit issues and management decides to reset the dividend as discussed later in this report without fee waivers and/or change in the management fee, the quarterly dividend will likely be reduced to between $0.25 and $0.30. This is also shown in the worst-case projections that take into account continued credit issues likely from the investments discussed later in this report.

BDCs are not CEFs

Many investors do not understand business development companies (“BDCs”) and use price-to-NAV as a measure of valuation. I find this to be simplistic at best and maybe it is okay for closed-end fund (“CEF”) but not for BDCs as it does not take into account operating cost structures, quality of management, borrowing rates, portfolio credit quality, potential declines in book value, expected returns, etc.

That said……the following table is for simple investors and indicates that MRCC is overpriced relative to other BDCs that trade below NAV:

Previous Insider Purchases

It should be noted that the most recent insider purchases were at prices below $10.00 when the stock was trading at a 25% discount to the reported NAV per share which was $12.95 (at that time).

Source: GuruFocus

As of January 23, 2020, MRCC had a relative strength index (“RSI”) of almost 75 indicating overbought conditions:

The following chart is not pretty if you are a long-term investor in MRCC and I have recently suggested to my subscribers to sell or at least trim current positions and wait for the company to report Q4 results (see dates below).

As BDCs start to report results two weeks from now starting with CSWC that was discussed in “DGI Capital Southwest Yielding 9.5% Before Upcoming Increases” and easily a better choice compared to MRCC.

Investors should be watching for potential portfolio credit issues that could lead to credit rating downgrades. Lower ratings would likely drive higher borrowing expenses that could put downward pressure on net interest margins and dividend coverage over the coming quarters.


This information was previously made available to subscribers of Premium BDC Reports, along with:

  • MRCC target prices and buying points
  • MRCC risk profile, potential credit issues, and overall rankings
  • MRCC dividend coverage projections and worst-case scenarios
  • Real-time changes to my personal portfolio

To be a successful BDC investor:

  • As companies report results, closely monitor dividend coverage potential and portfolio credit quality.
  • Identify BDCs that fit your risk profile.
  • Establish appropriate price targets based on relative risk and returns (mostly from regular and potential special dividends).
  • Diversify your BDC portfolio with at least five companies. There are around 50 publicly traded BDCs; please be selective.

Capital Southwest (CSWC) Dividend Coverage & Risk Profile Update

The following is from the CSWC Deep Dive that was previously provided to subscribers of Premium BDC Reports along with revised target prices, dividend coverage and risk profile rankings, potential credit issues, earnings/dividend projections, quality of management, fee agreements, and my personal positions for all business development companies (“BDCs”).


This update discusses Capital Southwest (CSWC) and its Baby Bond that trades publicly on the NASDAQ under the symbol “CSWCL”.

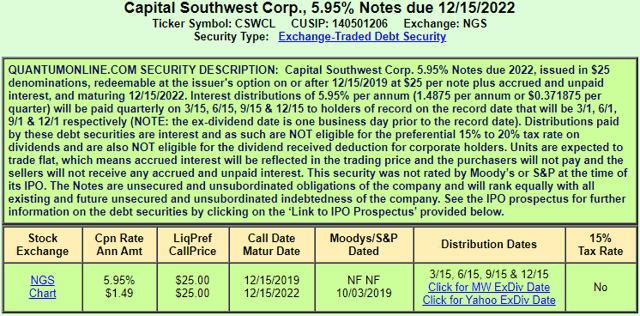
Capital Southwest 5.95% Notes due 12/15/2022 (CSWCL):

There is a good chance that the company will be redeeming its Baby Bond and are currently listed as a “Sell” in the BDC Google SheetsManagement discussed reducing its borrowing costs by potentially redeeming CSWCL in December 2019:

“I think that we will look to see if there is opportunistic capital raises on the debt side to take out the older version of the bonds that are at 5.95%. I don’t think there’s anything in a foreseeable future. But if the call period does end in December of this year, so if there is an opportunity to reduce cost and extend the maturity, we certainly will look like that on the fixed rate side.”


CSWC Dividend Coverage Discussion

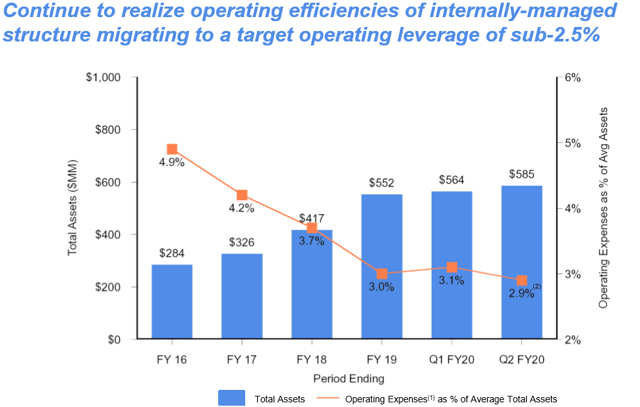
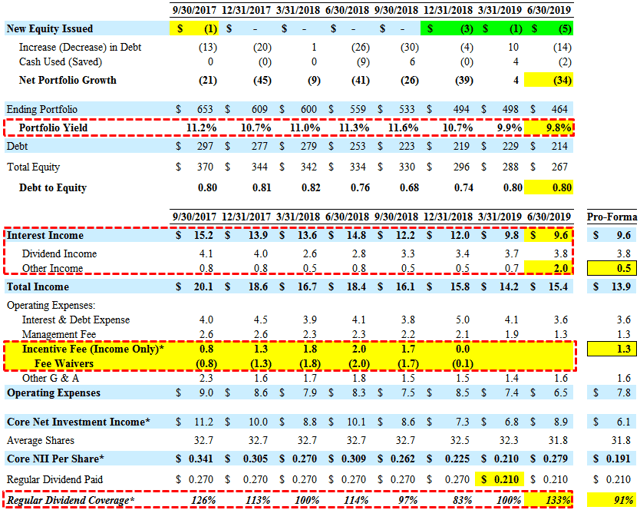
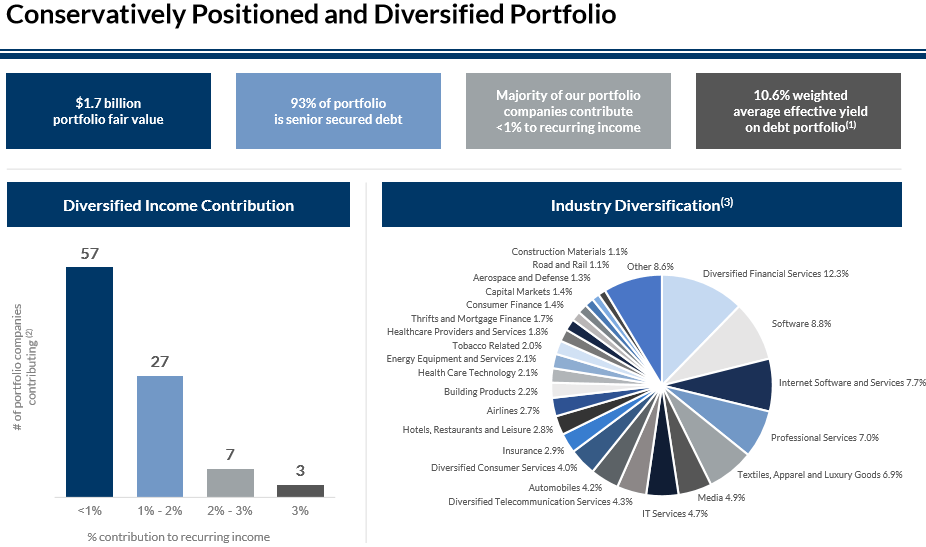
CSWC has the ability to leverage its internally managed cost structure combined with a history of stable portfolio credit quality that delivers a consistent and growing stream of recurring cash interest income with the potential for increased earnings through higher leverage and its I-45 Senior Loan Fund.

“Our operating leverage, which as of the end of the quarter was 2.9%. Excluding the aforementioned onetime deferred offering cost write off, our run rate operating leverage for the quarter would have been approximately 2.6%, which puts us near our initial target operating leverage of 2.5%. We are fully committed to actively managing our operating costs in lockstep with portfolio growth and will now set our sights on our longer term goal of achieving target operating leverage of 2% or better. With senior professionals and corporate infrastructure largely in place, operating leverage should continue to improve as the investment portfolio grows due to our internally managed structure.”

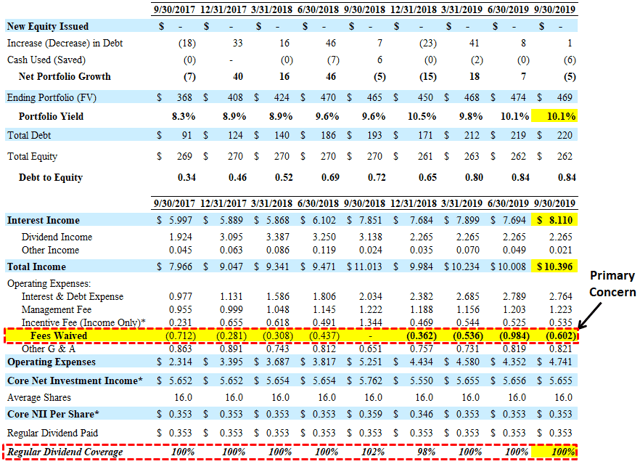
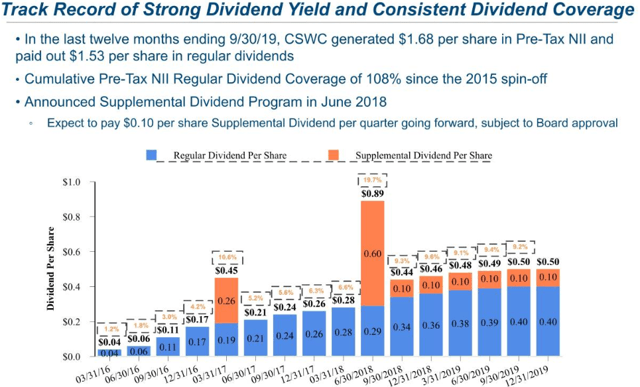
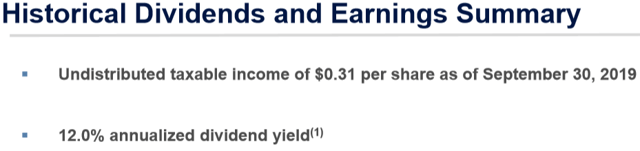
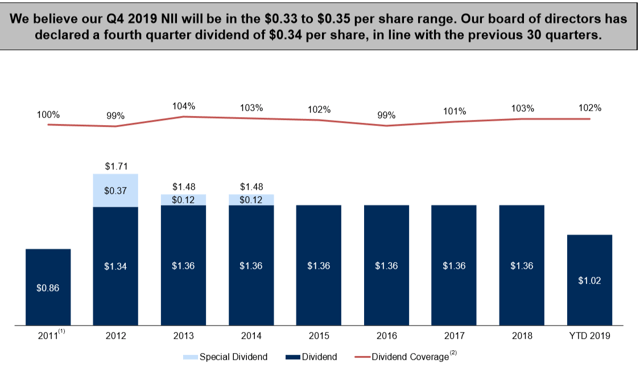
However, for the first quarter in the last four years, the company did not increase its regular quarterly dividend (discussed next) but will continue to pay its $0.10 per share supplemental dividends. CSWC had undistributed taxable income generated by excess income and capital gains accumulated through September 30, 2019, of over $18 million or $1.02 per share which is used to fund its supplemental dividends.

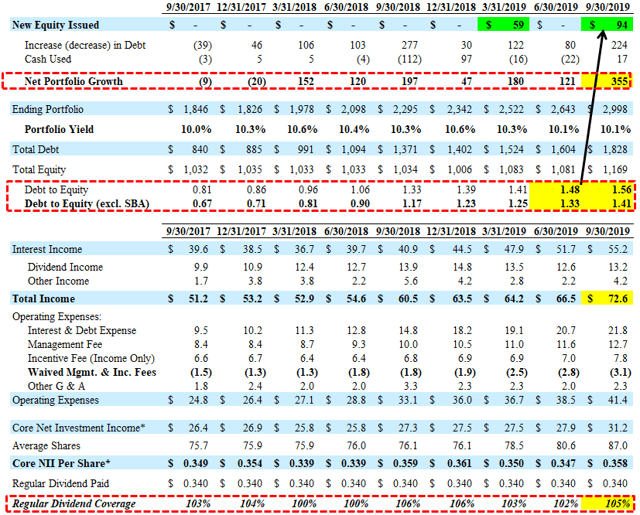
“We paid out our regular dividend during the quarter of $0.40 per share, achieving a 105% dividend coverage on pre-tax net investment income per share. Additionally we distributed $0.10 per share through our supplemental dividend program, funded by our sizable undistributed taxable income balance or UTI, which was generated by excess income and capital gains accumulated from our investment strategy to date. As of September 30 2019, we had approximately $18.3 million or $1.02 per share in UTI, providing visibility to continuing the quarterly supplemental dividend program well into the future.”

Management discussed the rate of future regular dividend increases that will likely be slower due to the timing of portfolio growth and the upcoming repayment Media Recovery, Inc. (“MRI”):

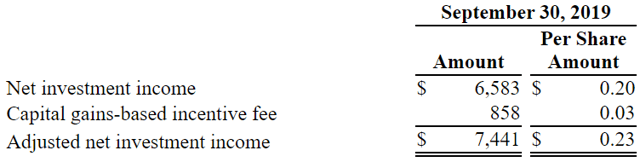
“We look at recurring income and a run rate of net investment income going forward. So this quarter, I think, we posted our number. We look at the $0.03 of expense that was incurred as a onetime, and we’d add that back to our run rates. So really our NII for the period was $0.45 So I’d tell you, going forward, we think our run rate of NII is certainly in — above the level of our dividend. We probably are going to be slowing the dividend pace as we just announced $0.40 for this current quarter. And then also has to do with our expectations potentially for MRI in the future as well.”

“So we look at all of that and we try to set a dividend at a level that is a level that frankly shareholders can rely on going forward and then will increase as our portfolio grows as it should, based on where we are in a leverage level, based on the liquidity we have available to us and our cash and credit facility availability. It’s just a matter of we need to go find the deals that are good deals. So we’ve never really been in a rush to grow portfolio or increase dividends or earnings. We want to hustle to find the deals, find the opportunities and be very diligent and careful and thoughtful and actually which ones we close. If that makes sense. It may stabilize for the moment as we absorb the capital we just received, as well as the potential for an MRI exit, but we would definitely to tell you that we expect that the dividend to grow as we redeploy capital.”

I am expecting strong portfolio growth in calendar Q4 2019 as guided by management and taken into account with the updated projections:

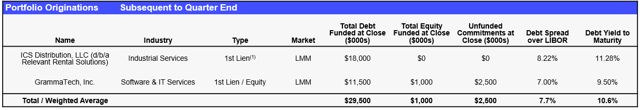
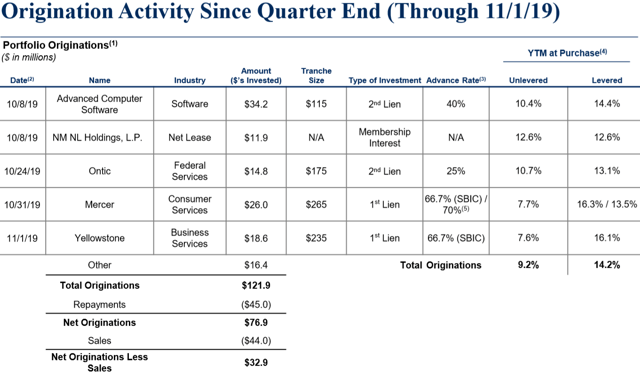
“Subsequent to quarter-end, we have originated $33 million in new commitments to two new portfolio companies. This included $30 million in first lien senior secured debt, $2.5 million in an unfunded revolving credit facility and $1 million in an equity co-investment. We are pleased with the pipeline as it stands today and expect that two or three additional deals currently in diligence should close by calendar year-end.”

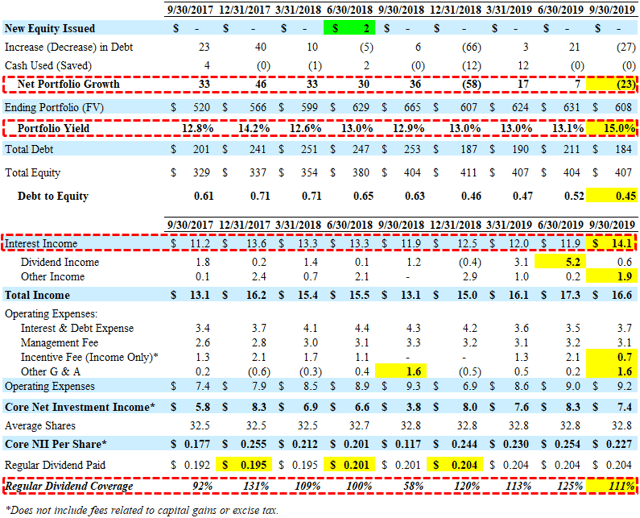
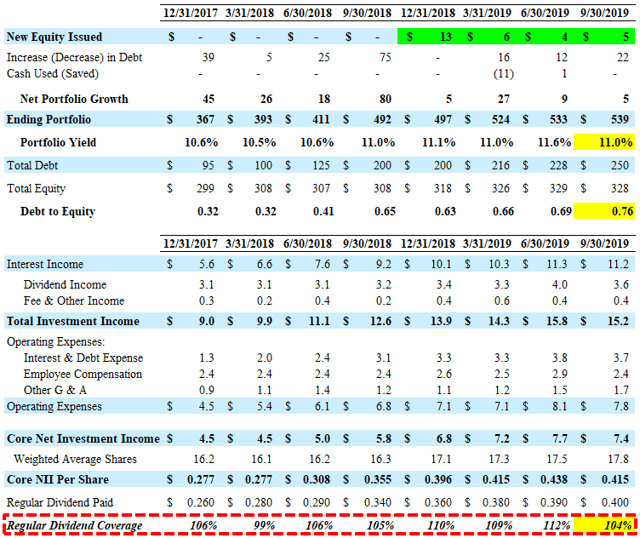
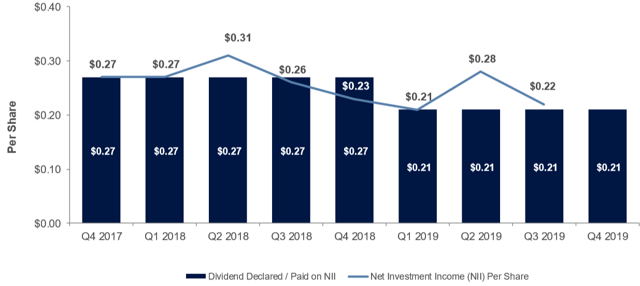
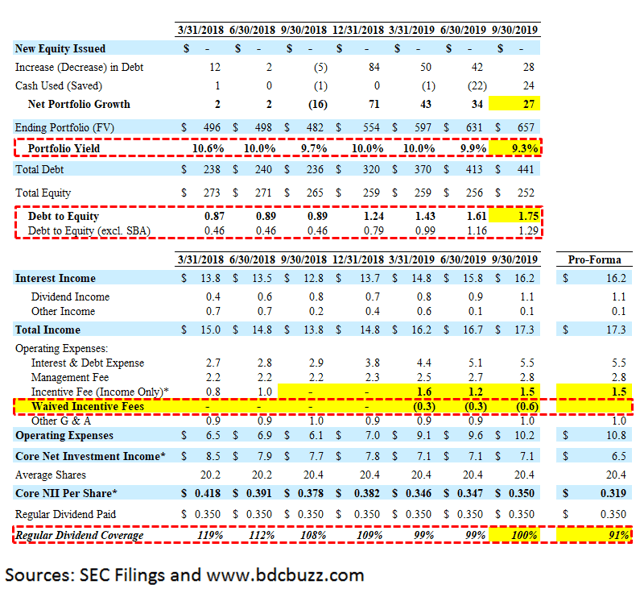
For calendar Q3 2019, Capital Southwest (CSWC) beat its base-case projections with a decline in portfolio yield closer to previous levels and covered its increased dividend by 104% even after taking into account $0.03 per share of one-time expenses.

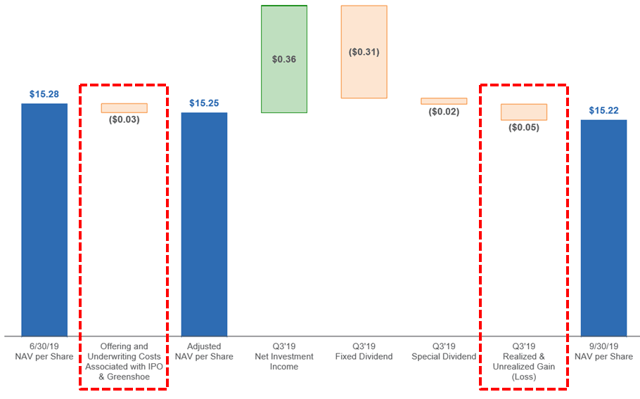
“We are pleased with our results this quarter, having posted a solid $0.42 per share in Net Investment Income despite incurring a $472,000, or $0.03 per share, one-time expense to retire our previous registration statement.”

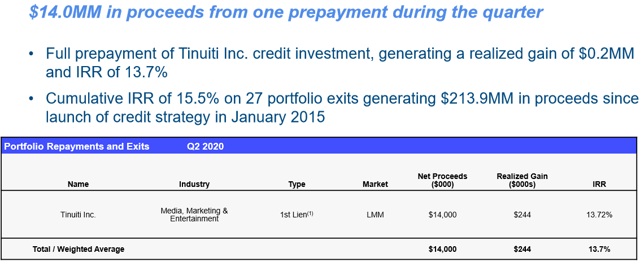
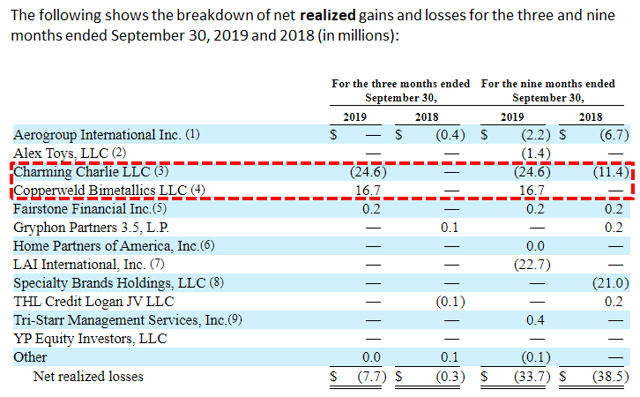
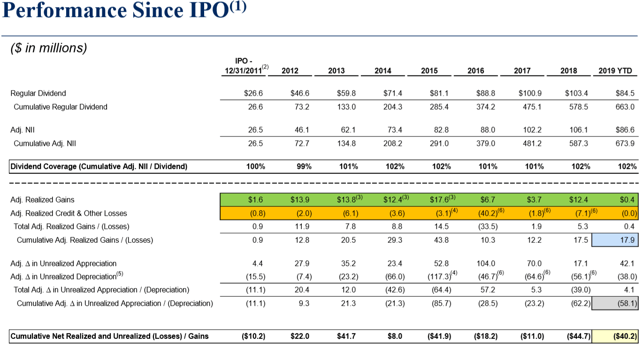
Similar to MAIN, the supplemental dividends are typically covered by realized capital gains and over-earning the regular dividend. CSWC had net realized gains of $0.3 million during calendar Q3 2019 mostly related to the $14 million prepayment of Tinuiti Inc.

“As shown on slide 12, we also had a full prepayment of one credit investment during the quarter for $14 million in total proceeds, generating a realized gain of $244,000 and an IRR of 13.7% on total invested capital.”

—————–

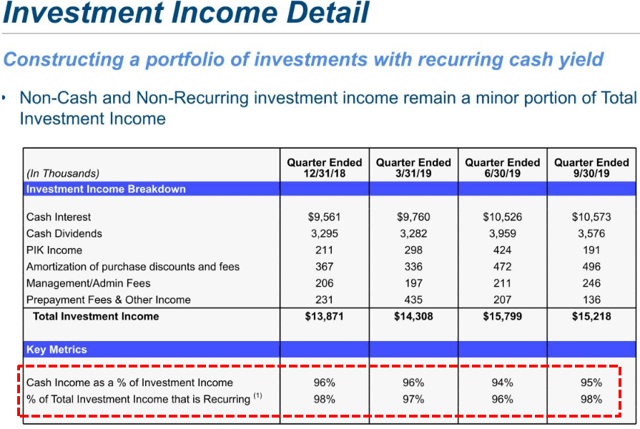
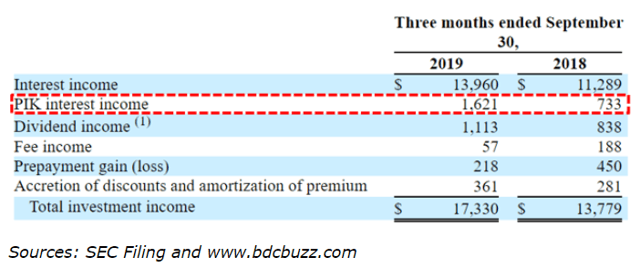
Its regular quarterly dividends are covered mostly through recurring cash sources:

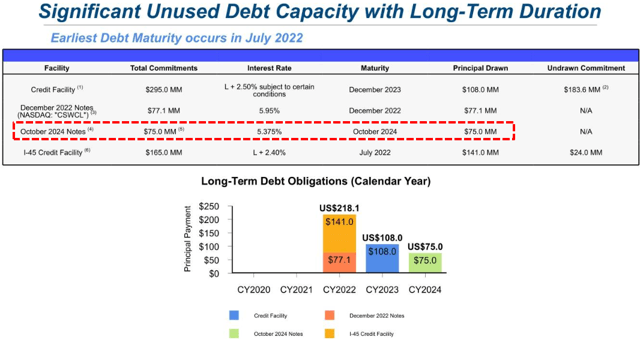
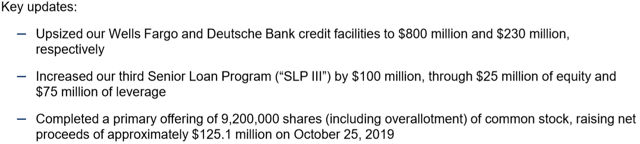
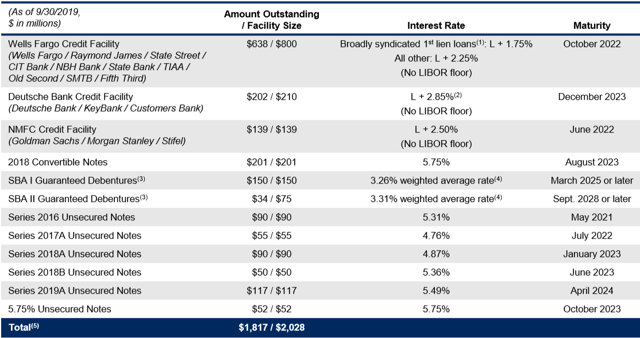
In September 2019, the company issued $65 million in 5.375% Notes due 2024 and on October 8, 2019, the Company issued an additional $10 million of the October 2024 Notes. As of September 30, 2019, CSWC had $30 million in unrestricted cash and almost $184 million in available borrowings under its credit facility for upcoming portfolio growth.

“From a capitalization standpoint, we further solidified our balance sheet by raising $75 million in an all institutionally-placed bond offering at an attractive yield of 5.375% with a 5-year maturity. The bond transaction was a unique one in the BDC space, as we believe that we are the only BDC in recent history with sub $1 billion in market cap to be able to access this market.”

“In addition, we raised $5 million in gross proceeds through our equity ATM program during the quarter, selling over 231,000 shares at a weighted average price of $21.62 per share, representing a 16% premium to book value. I am pleased to report that since the initiation of our equity ATM program, Capital Southwest has sold almost 700,000 shares at similar premiums to book value, raising approximately $15 million in gross proceeds. Our equity ATM program continues to provide a steady flow of equity capital raised on a just-in-time basis and lockstep with our ability to thoughtfully put the capital to work.”

On March 4, 2019, CSWC established its equity “At-The-Market” (“ATM”) program of slowly issuing small amounts of shares at a premium to book value/NAV and accretive to shareholders. During calendar Q3 2019, the company sold 231,272 shares of its common stock under the ATM program at a weighted-average price of $21.62 per share (~16% premium to previous NAV), raising $5 million of net proceeds after commissions to the sales agents on shares sold. Management will likely continue to use the ATM program for raising equity capital, rather than larger equity offerings. This approach is beneficial for many reasons including being more efficient, delivering higher net proceeds to the company and less disruptive to market pricing.

“We believe our equity ATM program is a prudent and cost-effective way to issue equity over time at tight spreads to the latest trade, while selling equity on a just-in-time basis so it can be thoughtfully invested in income generating assets. We certainly intend to do that by growing the portfolio, but we want to be, and we use the word prudent, we want to be prudent and diligent of raising kind of on a just-in-time basis and certain amount of equity, again, allowing us to get to target leverage in a reasonable timeframe, but being diligent about being in on a just-in-time basis. ”

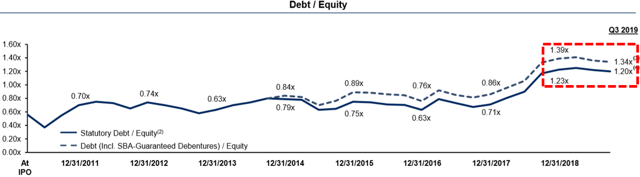
On May 23, 2019, the company announced the expansion of total commitments under its revolving credit facility from $270 million to $295 million. The increase was executed under the accordion feature which allows for an increase up to $350 million in total commitments. On April 25, 2018, the Board of Directors unanimously approved the application of the modified asset coverage requirements and the minimum asset coverage ratio applicable to the company was decreased from 200% to 150%, which became effective April 25, 2019. Management is targeting a debt-to-equity ratio between 1.00 and 1.20.

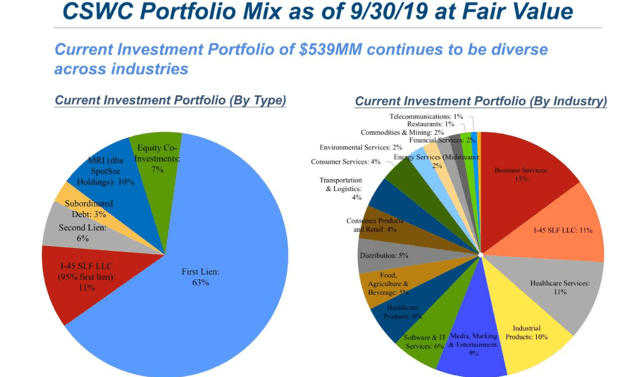
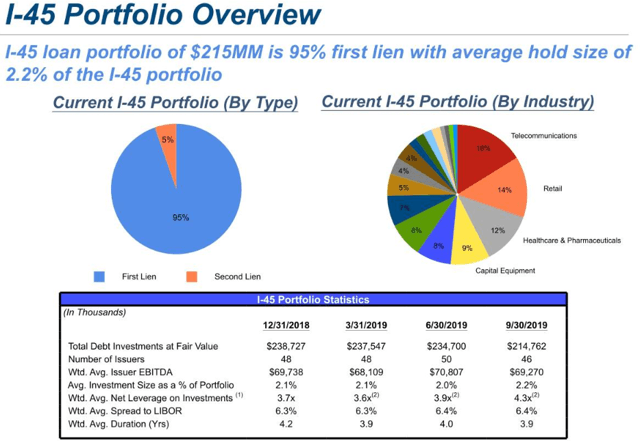
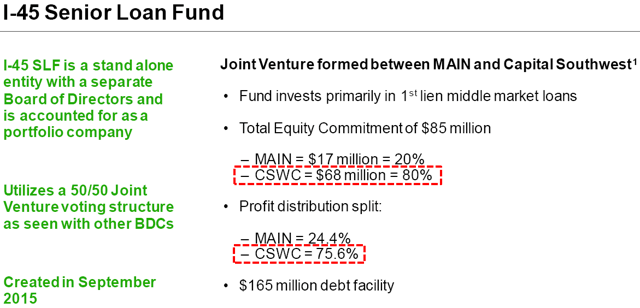
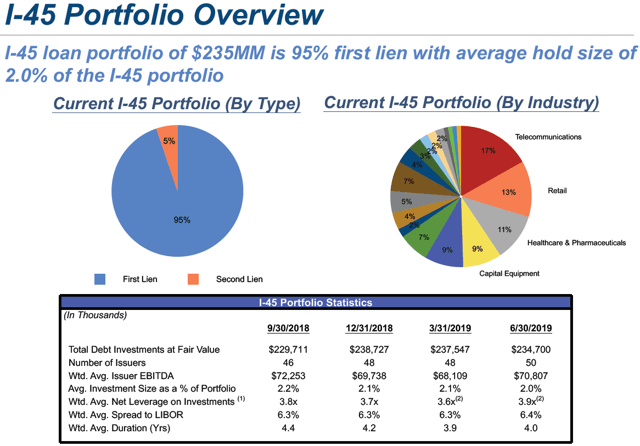
Its I-45 Senior Loan Fund accounts for 11% of the portfolio (previously 12%) and is a joint venture with MAIN created in September 2015. The portfolio is 95% invested in first-lien assets with CSWC receiving over 75% of the profits providing 16% annualized yield:

“Our I-45 senior loan fund provided dividends to Capital Southwest, representing a 16% annualized yield at fair value on our capital in the fund for the quarter.”

From previous call: “Overall, we have been pleased with the solid performance of I-45 over the past 3.5 years. We and our partner in I-45, Main Street Capital, have invested approximately $500 million through the fund and have harvested 50 exits generating $196 million in proceeds at a weighted average IRR our on the exit for the 11.4%. Our senior loan fund, I-45 also continued its solid performance producing a 15% annualized yield on our capital in the fund for the quarter.”


CSWC Risk Profile Update

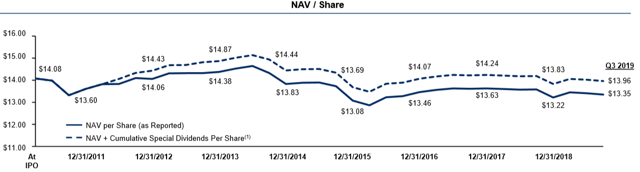
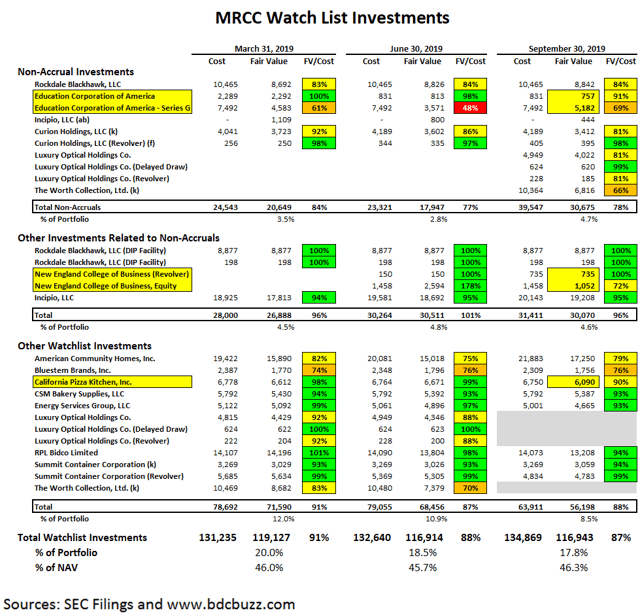
As mentioned in the previous report, my primary credit concerns for CSWC’s portfolio include its positions in AG Kings Holdings Inc., American Addiction Centers (AAC), and American Teleconferencing Services. During calendar Q3 2019, its net asset value (“NAV”) per share declined by $0.28 or 1.5% partially due to markdowns in these investments.


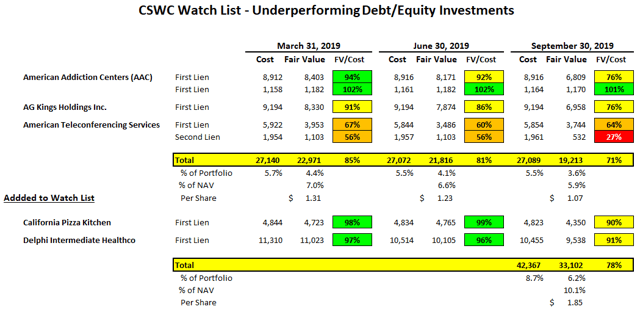
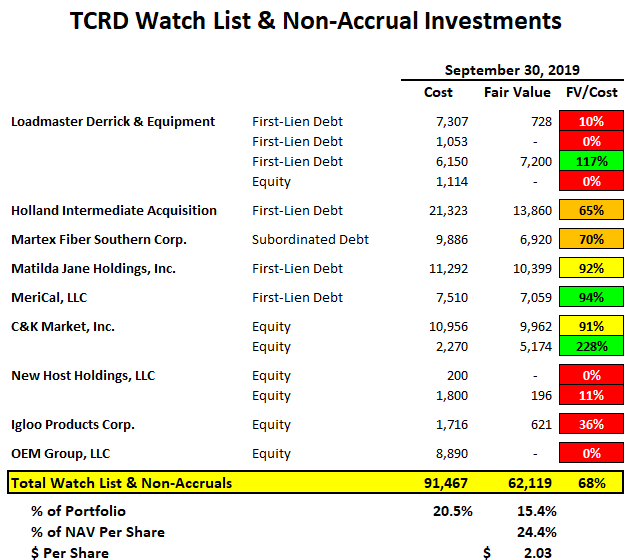
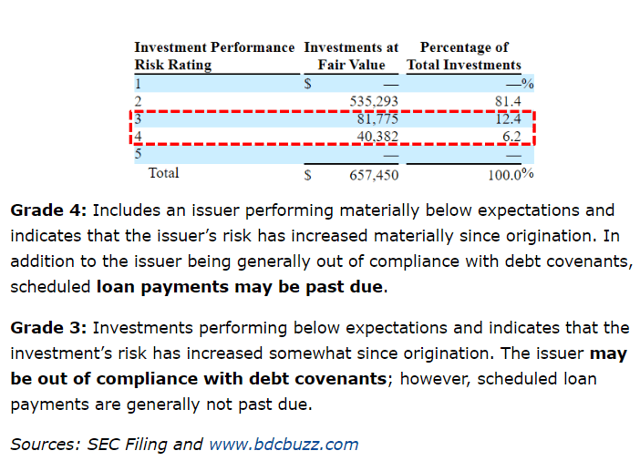
Also, there were markdowns in California Pizza Kitchen and Delphi Intermediate Healthco that have been added to the watch list that now accounts for around 6.2% of the portfolio fair value and 10.1% of NAV per share. Management discussed Delphi on the recent call:

“We’ve got another company Delphi that we made a three this quarter. It’s also in the behavioral health space in the upper middle market. But if you look at that — I think I attribute it mainly more of the structures and the quote dynamic in the upper middle market would be how I would see — how I’d react to that divergency you referenced.”

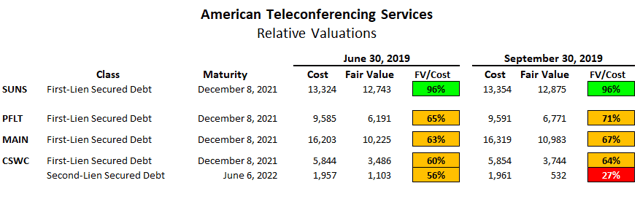
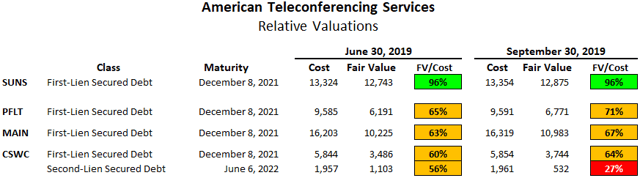
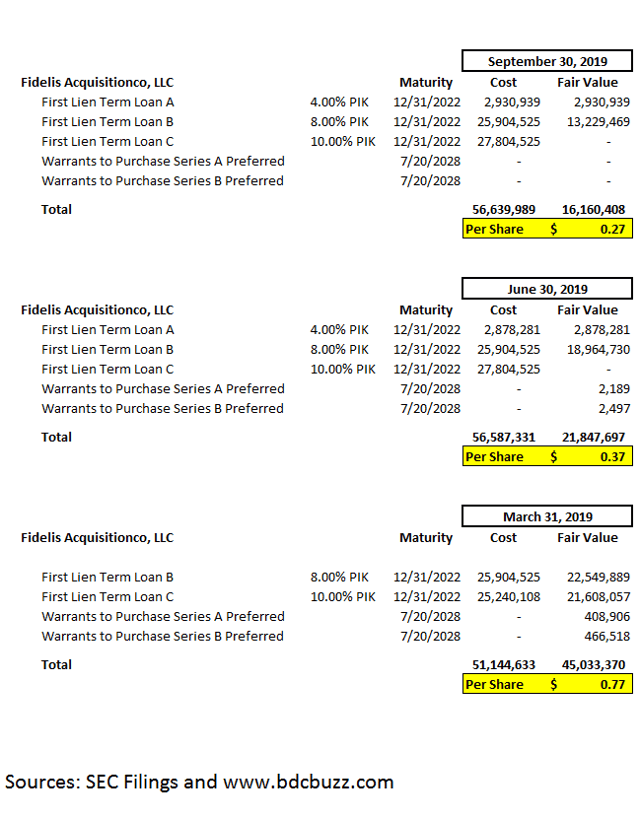
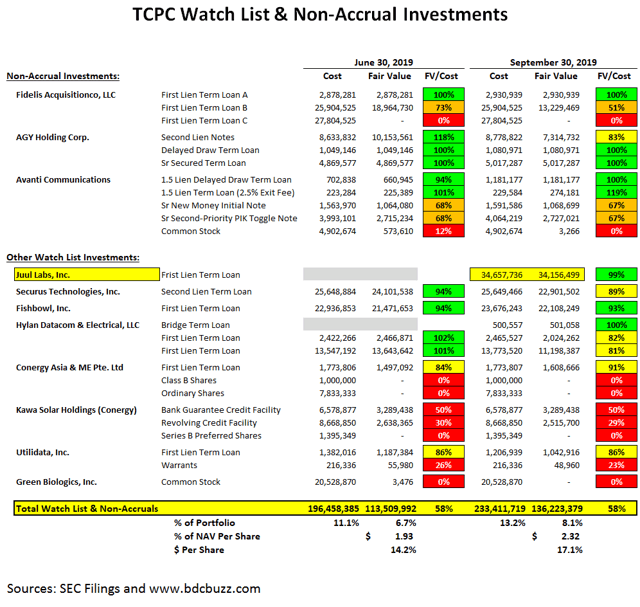
American Teleconferencing Services, Ltd. (“ATS”) is an investment also held by MAIN, PFLT and SUNS that operates as a subsidiary of Premiere Global Services (“PGi”), offering conference call and group communication services. As shown in the previous and following tables, the second-lien portion of ATS was marked down again during calendar Q3 2019. On January 28, 2019, Moody’s downgraded PGi’s debt to Caa2.


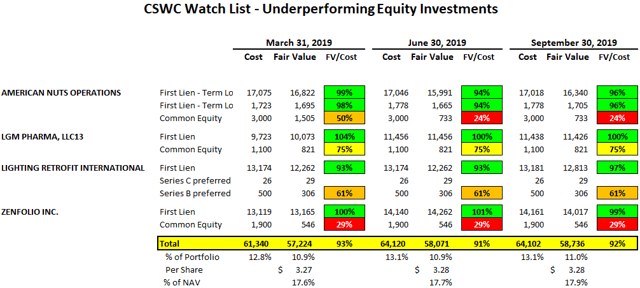
Another concern is additional unrealized losses from companies with equity positions that have been previously marked down including American Nuts which is an importer, mixer, roaster, and packager of bulk nuts, LGM Pharma, Lighting Retrofit International, and Zenfolio, Inc. These investments account for 11% of the portfolio and almost 18% of NAV per share and need to be watched.


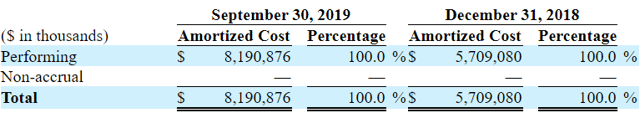
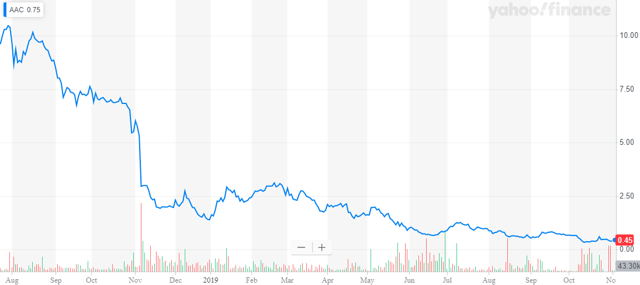
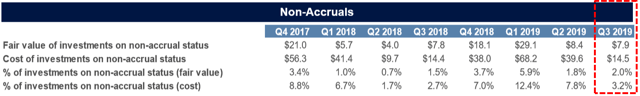
The largest markdown during calendar Q3 2019 was American Addiction Centers which was added to non-accrual status and is a subsidiary of AAC Holdings, Inc. (AAC) to which CSWC has invested $8.9 million marked down to $8.2 million. On June 14, 2019, Michael Nanko, President and Chief Operating Officer of AAC resigned from his positions according to an AAC filing with the SEC. Mr. Nanko leaves AAC one month after CEO Michael Cartwright and CFO Andrew McWilliams conducted a call with investors to map out a 10-year strategy for the company to reverse a slide that began in 2015. On July 1, 2019, AAC submitted a plan to the NYSE regarding the company’s efforts to improve its total market capitalization, following notice on May 17, 2019 from the NYSE that its stock was at risk of being delisted as its average market capitalization was less than the required $50 million over a 30-day trading period.

AAC received waiver defaults to remain operating but needs to improve its positive cash flows/EBITDA to avoid a bankruptcy/restructuring. CSWC management discussed its investment in AAC on the recent call:

“With respect to American Addiction, the company continues to have challenges. As in prior quarters, due to being a public company, we want to be careful not to effectively announce developments prior to the American Addiction management team appropriately communicating to their shareholders. What we will say is that the lender group continues to work with the company on solutions to the capital structure. The company’s lending — leading market position in the substance abuse industry, the company’s cost savings and business development initiatives and its large owned real estate portfolio, all provide reasons to remain optimistic on the prospects of a favorable resolution. American Addiction was placed on non-accrual this quarter and remains rated 3 on our internal rating system.”

However, there is a good chance that AAC will be selling its real estate assets to avoid bankruptcy and is likely why CSWC has only slightly marked down its first-lien loan. AAC still accounts for around 1.5% of CSWC’s portfolio and 2.5% of NAV per share.

“Despite its underperformance, we continue to feel reasonably confident about our 1st Lien position in the company, due to the value of its national substance abuse treatment franchise, managements operational efficiency initiatives, the tremendous demand for drug addiction treatment in the U.S., and the company’s large real estate portfolio associated with its street facilities.”

On March 15, 2019, S&P Global Ratings downgraded AAC Holdings Inc.’s issuer credit rating to CCC from B- after the company took out a $30 million term loan.

“The outlook is negative for AAC, which provides substance use treatment services for people with drug and alcohol addiction, and co-occurring mental and behavioral issues in the U.S. S&P Global Ratings said the downgrade reflects an increased risk of default and risk that AAC’s liquidity will not be sufficient over the next 12 months as the loan matures in about one year. The rating agency expects AAC to monetize its real estate assets to repay the new term loan March 31, 2020, and fund its operations in 2019. It believes there are risks that proceeds from a potential sale-leaseback may not be sufficient to cover operating needs and repay the term loan. S&P Global Ratings noted that AAC’s solvency heavily depended on executing its cost-saving initiatives.”

AG Kings was previously on non-accrual but marked down again now at 76% of cost and was discussed on the recent call:

Q. “AG Kings, we don’t have the 10-Q in front of us. Was that credit marked up or down at all this quarter and is — or materially and is there any update to pass along?”

A. “Yes, company is kind of still on the same — it’s just — it’s kind of bumping along. It hasn’t gotten worse. It really hasn’t gotten a whole lot better. We did market down by 10 points this quarter. So down from the mid 80s to the mid 70s.”

“We have had some of our portfolio, it’s a small handful, but it’s a couple of, like you referenced American Addiction and AG Kings. So we have had some softening in certain names, no question about it. Most of it’s really more idiosyncratic on a small handful of names. Across the portfolio, I would say, EBITDA performance is softened slightly from what it was the last couple of quarters, maybe by now a little bit on the economy. But generally from a first lien senior secured lender perspective not — yes, disappointing in some of the company’s performance. But from an investor perspective sitting in the first lien loan, less worrisome. But I mean, everything worries us. We’re managing the portfolio. Obviously, it’s our job to worry. But generally speaking, I think the structures are working as designed.”

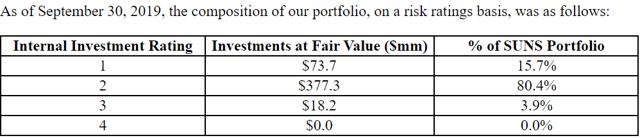
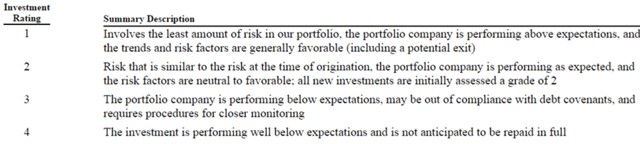
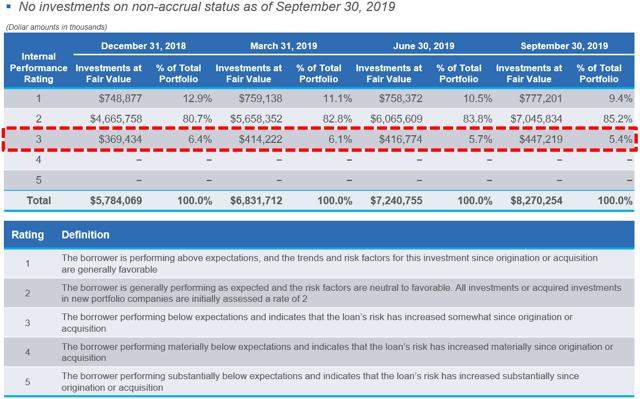
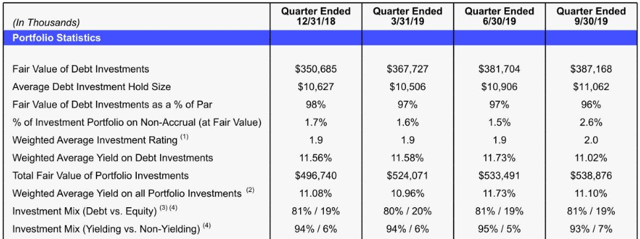
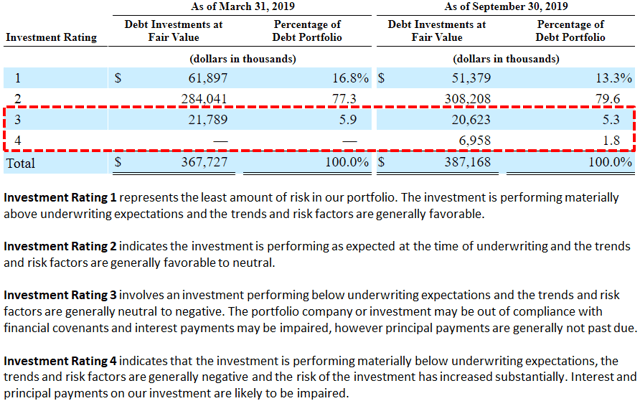
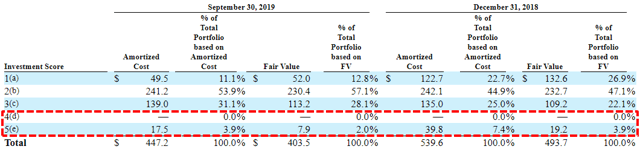
“As of the end of the quarter, of the 40 loans in the portfolio at fair value, we had three with the highest rating of one, representing 13% of the credit portfolio; we had 32 loans rated at two, representing 80% of the credit portfolio; we had four loans rated at three, representing 5% of the credit portfolio, and we had one loan rated at four, representing 2% of the credit portfolio.”

—————–

The portfolio has energy/oil-related exposure of around 2% and commodities/mining exposure of 2%. The energy investments are considered “midstream” as compared to “upstream” which usually involves more commodity-related risk.

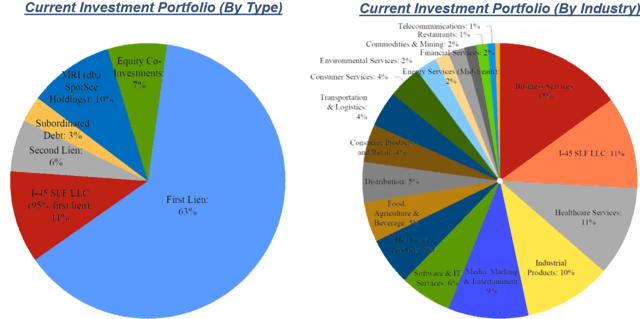
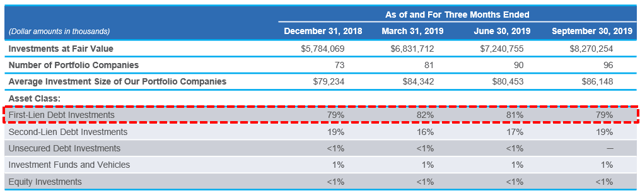
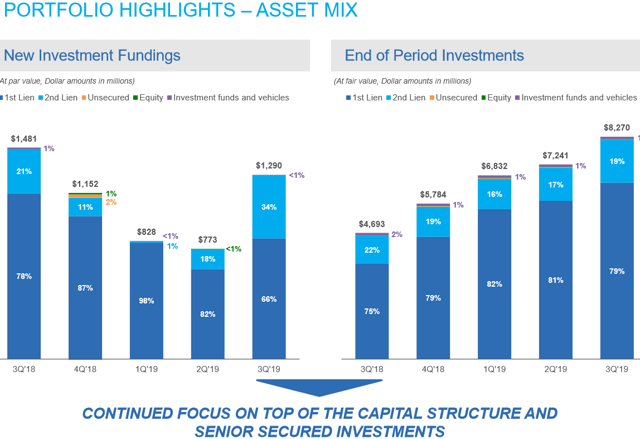
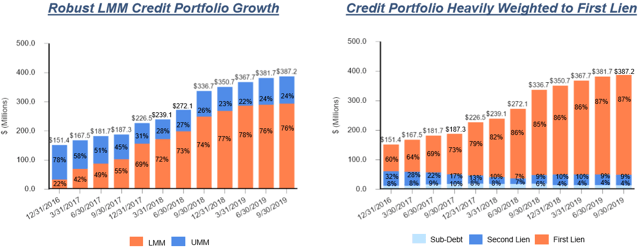
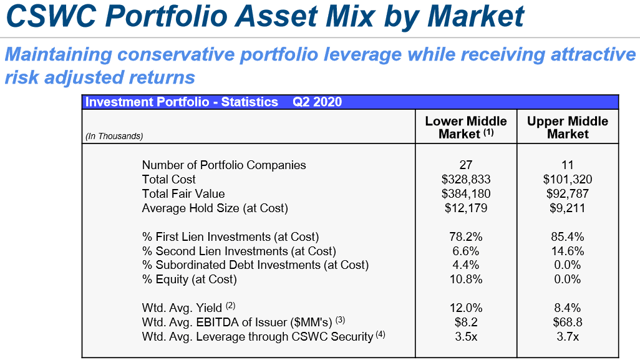
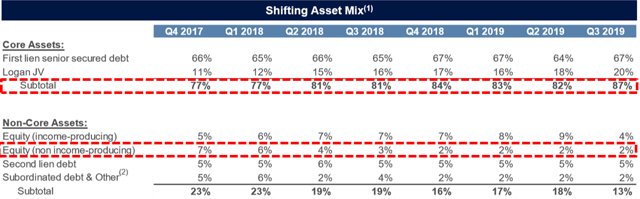
As the portfolio has grown, the percentage of its debt investments (excluding I-45 SLF) represented by the lower middle market has increased to 76% and first-lien accounts for 87%:

“While we have increased the percentage of the portfolio represented by the lower middle market, we have also continued to heavily emphasize Senior Secured 1st Lien Debt in our investment strategy. As of the end of the quarter, we had 76% of our on-balance sheet credit portfolio invested in lower middle market companies, while having 87% of the credit portfolio in first lien senior secured debt.”

—————–

Its I-45 Senior Loan Fund accounts for 12% of the portfolio and is a joint venture with MAIN created in September 2015, 95% invested first-lien.

—————–

CSWC’s debt portfolio is mostly first-lien positions with the potential for realized gains from its equity investments, especially in its lower middle-market investments (similar to MAIN). Equity participation is partially responsible for growing its NAV per share as well as ‘recurring non-recurring’ income, which contributes to the growing amount of undistributed spillover income and gains used to support continued supplemental dividends.

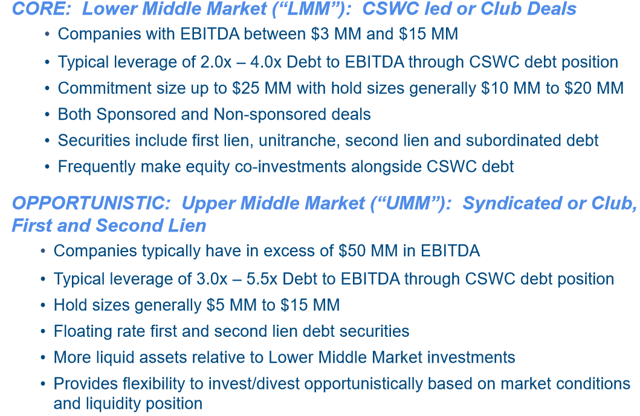
“We had 27 lower middle market portfolio companies with an average hold size of $12.2 million, a weighted average EBITDA of $8.2 million, a weighted average yield of 12% and a leverage ratio measured as debt-to-EBITDA through our security of 3.5 times. Within our lower middle market portfolio, as of the end of the quarter, we held equity ownership in 70% of our portfolio companies. Our on-balance sheet upper middle market portfolio consisted of 11 companies with an average hold size of $9.2 million, a weighted average EBITDA of $68.8 million, a weighted average yield of 8.4% and a leverage ratio through our security of 3.7 times.”

“In our core market, the lower middle market, we directly originate opportunities consisting of debt investments and equity co-investments. Building out a highly performing and granular portfolio of equity co-investments is important to driving growth in NAV per share, while aiding in the mitigation of future credit losses. At the same time, our capability and presence in the upper middle market provides us the ability to opportunistically invest in a more liquid market when attractive risk-adjusted returns exist. Capital Southwest continues to have an equity co-investment in the company with significant unrealized appreciation. This continues our strong track record of successful exits as we have now had 27 portfolio exits since launch of our credit strategy, generating $214 million in total proceeds and a cumulative IRR of 15.5%. ”


This information was previously made available to subscribers of Premium BDC Reports, along with:

  • CSWC target prices and buying points
  • CSWC risk profile, potential credit issues, and overall rankings
  • CSWC dividend coverage projections and worst-case scenarios
  • Real-time changes to my personal portfolio

To be a successful BDC investor:

  • As companies report results, closely monitor dividend coverage potential and portfolio credit quality.
  • Identify BDCs that fit your risk profile.
  • Establish appropriate price targets based on relative risk and returns (mostly from regular and potential special dividends).
  • Diversify your BDC portfolio with at least five companies. There are around 50 publicly traded BDCs; please be selective.


Comparison Of Venture Debt Players Yielding 9% To 10%: HTGC, TPVG, HRZN

The following information was previously provided to subscribers of Premium BDC Reports along with revised target prices, dividend coverage and risk profile rankings, potential credit issues, earnings/dividend projections, quality of management, fee agreements, and my personal positions for all business development companies (“BDCs”).


  • The following is a portion of a public article that will be published soon discussing HTGC, TPVG, and HRZN.
  • I currently do not cover HRZN for the reasons discussed in this update.

Hercules Capital (HTGC), TriplePoint Venture Growth (TPVG) and Horizon Technology Finance (HRZN) provide capital to venture capital (“VC”) backed technology and high growth companies paying dividend yields of 9% to 10%.

HTGC is the leading and largest specialty finance company focused on providing senior secured venture growth loans to high-growth, innovative venture capital-backed companies in a broad variety of technology, life sciences, and sustainable and renewable technology industries.

Source: HTGC Website

TPVG is the leading global provider of financing across all stages of development to technology, life sciences and other high growth companies backed by a select group of venture capital firms.

Source: TPVG Website

HRZN is a leading specialty finance company that provides capital in the form of secured loans to venture capital-backed companies in the technology, life science, healthcare information and services, and sustainability industries

Source: HRZN Website

Source: TPVG Investor Presentation

Why Would Venture-Backed Companies Use Venture Debt?

  1. Less dilutive than new VC round
  2. Lengthens time before next equity round
  3. Provides negotiating leverage for higher valuations
  4. Leverages returns for equity investors

Source: HTGC Investor Presentation


Dividend Yield, Market Cap, & Trading Volumes

I typically cover larger BDCs with adequate trading volumes as the sector can be volatile with meaningful swings during markets ‘flight to safety’. Larger investors prefer having liquidity especially when BDCs report ‘good’ or ‘bad’ results so that they can take advantage of the timing of trades etc. In a down market, you do not want to be holding a smaller BDC. Also, larger companies typically have more institutional investors that can drive management to do the right thing at times.

Quality of Management

This is likely the most important part of BDC analysis as management is responsible for building a portfolio to deliver returns to shareholders while protecting the capital invested. BDC management controls all the levers including the quality of the origination/credit platform, managing the capital structure with appropriate leverage, meaningful share repurchases, accretive equity offerings, and dividend policy, creating an efficient operating cost structure and willingness to “do the right thing” by waiving management fees or having a best in class fee structure that protects returns to shareholders. I’m not going to get into all of the details for each BDC here as it would be an entire article for each company.

The following table ranks each company by the amount or regular dividends paid annually divided by the current book value or net asset value (“NAV”):

HTGC is obviously the winner with an internally-managed structure driving increased dividends and NAV per share with continued accretive equity offerings. TPVG is externally-managed with a stable dividend and pays specials when they can as well as equity offerings that are less accretive but the company uses the proceeds quickly.

HRZN is an outlier in the BDC sector and is one of the few BDCs that has issued shares below NAV as well as the previously discussed dividend cuts and the 33% decline in NAV per share. On March 24, 2015, HRZN completed a follow-on public equity offering of 2 million shares for net proceeds of $26.7 million or $13.35 per share which was 7% below its NAV per share of $14.36.

Source: HRZN SEC Filing

I do not like to point out that there have been bad actors (including MCC and PSEC) that have done this in the past because shareholders are reluctant to vote for giving this option to the management of quality BDCs that might need simply to lower borrowing rates on facilities.

Historical Changes in Book Values & Dividends

As discussed in previous articles, changes in book value or net asset value (“NAV”) per share are not always a clear indicator of historical credit issues because there are many items that impact NAV including over or underpaying the dividend, equity issuances and general changes in values for assets and liabilities (borrowings). It is also important to recognize the difference between “realized” and “unrealized” gains and losses. BDCs that have recently cut dividends due to credit issues likely had larger amounts of realized losses from investments sold or written off. Many higher quality BDCs have had previous NAV per share declines mostly related to unrealized losses and conservatively marking assets down to reflect general market pricing rather than changes to credit quality. However, if you use a longer-term when measuring changes it becomes a more meaningful measure. Clearly, HTGC is the winner in this category. However, I am expecting a decline in TPVG’s NAV per share of around $0.18 due to Harvest Power, Inc. and publicly traded equity positions.

HRZN has cut its dividend twice and does not pay special dividends.


Conclusion and Recommendations

Historically, investors paid a premium for HTGC driving a lower yield but TPVG was overpriced last month at $17 temporarily driving its yield lower but has come back a bit for various reasons. HRZN’s yield has averaged around 10.6% but is currently 9.0% and likely overbought as discussed next.

HRZN’s price has recently shot up driving its Relative Strength Index or RSI which is an indicator that I use after I already know which BDC I would like to purchase, but waiting for a good entry point. This is the definition from Investopedia:

The relative strength index (RSI) is a momentum indicator developed by noted technical analyst Welles Wilder, that compares the magnitude of recent gains and losses over a specified time period to measure speed and change of price movements of a security. It is primarily used to attempt to identify overbought or oversold conditions in the trading of an asset. Traditional interpretation and usage of the RSI is that RSI values of 70 or above indicate that a security is becoming overbought or overvalued, and therefore may be primed for a trend reversal or corrective pullback in price. On the other side of RSI values, an RSI reading of 30 or below is commonly interpreted as indicating an oversold or undervalued condition that may signal a trend change or corrective price reversal to the upside.”

HRZN’s RSI is currently over 88 as shown below compared to HTGC near 46 and TPVG near 35.

I recently had to lower my projections for TPVG due to updated information included in the SEC filings associated with the recent equity offering but I’m still expecting dividend coverage of around 105% for Q4. I’m assuming that other analysts will revise their estimates lower before the company reports results next month so there could be lower prices coming. Analysts (not me) are expecting HRZN to cover its dividend by 103% for Q4.

If you want to increase your exposure to one of these companies, I would choose HTGC as the safer higher quality internally-managed option. HTGC’s pricing is not ideal but adequate for a starter position and purchase additional shares during any pullbacks (which are likely coming). TPVG is more favorably priced but due to the previously discussed reasons. HRZN has had a nice run and hopefully, management has learned from past mistakes.


This information was previously made available to subscribers of Premium BDC Reports, along with:

  • HTGC and TPVG target prices and buying points
  • HTGC and TPVG  risk profile, potential credit issues, and overall rankings
  • HTGC and TPVG  dividend coverage projections and worst-case scenarios
  • Real-time changes to my personal portfolio


To be a successful BDC investor:

  • As companies report results, closely monitor dividend coverage potential and portfolio credit quality.
  • Identify BDCs that fit your risk profile.
  • Establish appropriate price targets based on relative risk and returns (mostly from regular and potential special dividends).
  • Diversify your BDC portfolio with at least five companies. There are around 50 publicly traded BDCs; please be selective.


Juul Labs Investor BlackRock TCP Capital (TCPC) Yielding 10.3%

The following is from the TCPC Deep Dive that was previously provided to subscribers of Premium BDC Reports along with revised target prices, dividend coverage and risk profile rankings, potential credit issues, earnings/dividend projections, quality of management, fee agreements, and my personal positions for all business development companies (“BDCs”).


  • Each quarter, I go through the results for each BDC assessing ongoing/upcoming credit issues for risk rankings and target prices as I recently did for TCPC discussed in this update.
  • TCPC’s largest new investment during Q3 2019 was Juul Labs which produces electronic cigarettes/vaping products that have been under recent pressure from the Food and Drug Administration (“FDA”).
  • The FDA has issued a ban on most flavored vaping products, with the exception of tobacco and menthol.

ta1

This update discusses BlackRock TCP Capital (TCPC) currently yielding over 10% annually. As mentioned below, each quarter I go through the results for each BDC assessing ongoing or upcoming credit issues to asses risk rankings and target prices as I recently did for TCPC some of which are presented in this update.

TCPC Risk Profile “Quick Update”

During Q3 2019, TCPC’s net asset value (“NAV”) per share declined by $0.05 or 0.4% (from $13.64 to $13.59) due to unrealized losses from previously discussed ‘watch list’ investments mostly offset by overearning the dividend and markups of  Edmentum and Snaplogic, Inc.:

Leading portfolio gains was a $5.2 million increase in the value of our investment in Edmentum. As we have previously discussed, we have been working alongside the Edmentum management team to improve operations and we are pleased to see meaningful ongoing improvements to the Company in our holdings as a result of those efforts. We also recognized $4 million in gains and prepayment income on the payoff of our loan to SnapLogic during the third quarter.”

Source: TCPC Q3 2019 Results – Earnings Call Transcript

ta2

Similar to the previous quarter, the largest markdown was its investment in Fidelis Acquisitions, LLC (“Fidelis”) that was added to non-accrual in Q2 2019 and marked down another $5.7 million during Q3 2019. Fidelis still accounts for around 1.0% of the portfolio and $0.27 per share of NAV and has been discussed in previous reports.

The largest markdown in the quarter was a $5 million markdown of our investment in Fidelis, driven in large part by an ongoing liquidity shortfall at the company. We are actively engaged with management and potential co-investors to both address the shortfall and to proactively deal with the issues that drove the under-performance in the past. As discussed on last quarter’s call, we expect the value of this investment to be volatile, as we work toward a solution to strengthen the balance sheet and we plan to provide updates as appropriate.”

Source: TCPC Q3 2019 Results – Earnings Call Transcript

ta3

Management discussed Fidelis on the recent call including bringing on additional financing that would likely result in a restructuring driving realized losses in the coming quarters but also put back on accrual status:

Q. Can you guys provide any update on Fidelis?”

A. This is obviously a very important, but I would say isolated position and that we’re dealing with the company. We continue to see some benefit both topline and as well as the outlook for the business based on the work we’ve done over – going back over a year-ago in terms of switching out management and making some changes. But there is an ongoing liquidity need and we are actively working to address that and hopefully resolve it and that may ultimately include us with the financing partner taking over the business or it might be an alternative. Where I parsed the business outlook from the liquidity outlook and it’s an ongoing activity that we will just continue to try to update you all on.”

Source: TCPC Q3 2019 Results – Earnings Call Transcript

Most of the previous NAV declines were due to 5 investments discussed in previous reports including Real Mex, Kawa Solar, AGY Holding, Green Biologics and most recently Fidelis.

  • Its loan to Real Mex was part of the legacy pre-IPO strategy and had generated significant income. During Q4 2018, TCPC exited this investment resulting in $25.8 million of losses with no further impact to NAV.
  • Kawa Solar Holdings was previously on non-accrual but restructured in Q3 2018 and is now in the process of “winding down”.
  • Its debt investments in Green Biologicswere restructured into common equity and mostly written off with no further impact to NAV.

Along with Fidelis, TCPC has loans to AGY Holding (“AGY”) and Avanti Communications on non-accrual status account for around 1.4% of the portfolio fair value.

We had loans to three portfolio companies on non-accrual status, Fidelis, AGY and Avanti, representing 1.4% of the portfolio at market value and 3.8% at cost. We placed Fidelis on non-accrual last quarter and Avanti has been challenged for some time. AGY is a fundamentally good company, whose valuation is currently less than its debt.

Source: TCPC Q3 2019 Results – Earnings Call Transcript

Its equity investments in AGY were previously written off with no further impact to NAV but the second-lien notes were marked down by $3 million. Management discussed AGY including “weakness on the international front” due to “record high commodity prices for certain raw materials” and “some customers slowdowns due to international trade uncertainty”:

Additionally, we took mark downs of $3 million on each of our investments in Hylan and AGY, both for company-specific reasons. AGY continues to be a fundamentally good company that has faced a series of external challenges, including record high commodity prices for certain raw materials, particularly rhodium, as well as some customers slowdowns due to international trade uncertainty. AGY is a fundamentally good business. We’ve had a couple of markdowns in that, we’ve been disappointed. It’s a maker of high-end resins that go into a series of sophisticated end-use products. The markets for most of these have been strong. This quarter we saw some weakness on the international front, due to what we think is trade uncertainty and the Company was significantly impacted as some of its raw materials, particularly rhodium has soared and is at record price levels. As a result this, our valuation providers decreased the value of the Company to a level lower than where the instrument was valued and we thought that it called into question the collectability of the PIK to a sufficient point that it belonged on non-accrual.”

Source: TCPC Q3 2019 Results – Earnings Call Transcript

The other large markdown during the quarter was its watch list investment Hylan Datacom & Electrical that contributed around $2.7 million of unrealized losses during the quarter:

Hylan is a leading telecom and wireless engineering and construction company whose customers are experiencing project delays in certain end markets, including from delayed 5G projects.”

Source: TCPC Q3 2019 Results – Earnings Call Transcript

The following table shows the ‘watch list’ investments that account for around 8.1% of the total portfolio fair value. The updated watch list includes its new investments in Juul Labs, Inc. as discussed next.

ta4


The largest new investment during Q3 2019 was Juul Labs, Inc. (JUUL) which produces electronic cigarettes/vaping products that have been under recent pressure from the Food and Drug Administration (“FDA”).


On January 2, 2020, the FDA issued a ban on most flavored vaping products, with the exception of tobacco and menthol. Under the new rule, companies that do not stop the distribution of fruit and mint flavors within 30 days are at risk of regulatory action by the FDA. However, Juul stopped selling its mint and fruit-based flavors in Q4 2019 and continues to sell flavors based on tobacco and menthol. Also, there are other issues including various lawsuits but TCPC management mentioned “we believe this is a well-structured and well-covered loan” with “multiple sources of repayment, including a very low loan-to-value, cash well in excess of our debt and successful business operations in multiple locations”:

They include a $35 million senior secured loan to Juul Labs and investment generated from a relationship we had through our private funds. We made this investment in early August, and while we are aware of the recent headlines about Juul, we believe this is a well-structured and well-covered loan.”

Q. Can you maybe talk a little bit about how your investment in Juul Labs? That deal was source to you and then maybe specifically with Juul, but also just broader, that obviously company has some controversy to it. So how do you guys get comfortable making investment, would you guys obviously view as an attractive risk-adjusted return, but potentially could have some reputation risk there?”

A. As we mentioned about half our investments come from existing sources, and this is one of those. It wasn’t an investment in the BDC that was a company that we had been involved with in one of our private funds, no longer involved within that capacity. And so, we had a pre-existing relationship. I think it’s always difficult to answer a hypotheticals. But we invested in Juul in early August. On the premise that the company has developed an alternative to combustible cigarettes, that could dramatically reduce cigarette consumption. And our investment was based on fundamentally sound underwriting, which includes multiple sources of repayment, including a very low loan-to-value, cash well in excess of our debt and successful business operations in multiple locations. Having said that, we’re very conscious of the headlines and the circumstances surrounding the company and we continue to monitor.”

Source: TCPC Q3 2019 Results – Earnings Call Transcript

As mentioned in previous articles, its debt investments in Green Biologics were restructured into common equity and discussed on a previous call: “Green Bio missed projections, but received an equity infusion from its strategic owner during the quarter.” Kawa Solar Holdings was previously on non-accrual but restructured in Q3 2018 and is now in the process of “winding down”. Other investments that need to be watched include Securus Technologies, Inc., Conergy, Fishbowl, Inc., Utilidata, Inc. and Avanti Communications Group. TCPC has investments in 105 portfolio companies and a certain amount of credit issues are expected.

It’s important to note that on a combined basis, these investments account for a very small percentage of our portfolio. We are focused on maximizing their value along with the rest of the portfolio and our team has a strong long-term track record and experience working through challenging situations, as demonstrated by the increase in value of our investment in Edmentum and the gains we realized on SnapLogic.”

As of September 30, we held investments in a record 105 companies across a wide variety of industries. Our largest position represented only 3.8% of the portfolio and taken together, our five largest positions represented only 15.8% of the portfolio.”

Source: TCPC Q3 2019 Results – Earnings Call Transcript

Source: BlackRock TCP Capital Corp 2019 Q3 – Results – Earnings Call Presentation

The overall credit quality of the portfolio remains strong, with 93% of the portfolio in senior secured debt (mostly first-lien positions) and low non-accruals and low concentration risk:

At quarter-end, our portfolio had a fair market value of $1.7 billion, 93% of which was in senior secured debt. In constructing our portfolio, we have consistently focused on seniority as well as diversification. As of September 30, we held investments in a record 105 companies across a wide variety of industries. Our largest position represented only 3.8% of the portfolio and taken together, our five largest positions represented only 15.8% of the portfolio. Our recurring income is distributed across a diverse set of portfolio companies. We are not reliant on income from any one portfolio company. In fact, on an individual company basis, well over half of our portfolio companies each contribute less than 1% to our recurring income. ”


This information was previously made available to subscribers of Premium BDC Reports, along with:

  • TCPC target prices and buying points
  • TCPC risk profile, potential credit issues, and overall rankings
  • TCPC dividend coverage projections and worst-case scenarios
  • Real-time changes to my personal portfolio


To be a successful BDC investor:

  • As companies report results, closely monitor dividend coverage potential and portfolio credit quality.
  • Identify BDCs that fit your risk profile.
  • Establish appropriate price targets based on relative risk and returns (mostly from regular and potential special dividends).
  • Diversify your BDC portfolio with at least five companies. There are around 50 publicly traded BDCs; please be selective.

Gladstone Investment (GAIN): Upcoming Gains & Projected Deemed Dividend

The following is from the GAIN Deep Dive that was previously provided to subscribers of Premium BDC Reports along with revised target prices, dividend coverage and risk profile rankings, potential credit issues, earnings/dividend projections, quality of management, fee agreements, and my personal positions for all business development companies (“BDCs”).


Gladstone Investment (GAIN) Update Summary:

  • The updated projections take into account the exit of Nth Degree Inc. as well as potential credit issues.
  • GAIN announced the sale of its portfolio company Nth Degree, Inc. to MSouth Equity Partners. Nth Degree, Inc. which represented 11.7% of the portfolio at fair value and is marked $52 million over cost, driving significant realized gains.
  • These gains will be partially offset by the exit of its investment in B-Dry, LLC in October 2019 resulting in a realized loss of $14.7 million ($0.45 per share).
  • Included in the announcement management mentioned “realizing gains on equity, provides meaningful value to shareholders through stock appreciation and dividend growth” implying that this will likely not be paid in cash but retained to reinvest and grow the regular dividends.
  • As mentioned in the previous reports, the amount of preferred/common equity accounts for 33% of the portfolio fair value (marked well above cost) which needs to be partially monetized and reinvested into secured debt.
  • For calendar Q3 2019, GAIN had realized gains of $21.1 million or $0.64 per share mostly due to the exit of Alloy Die Casting.
  • In October 2019, the company announced an increase to its semiannual/supplemental dividend of $0.09 per share payable in December 2019.
  • NAV per share increased by 0.8% mostly due to various markups including Alloy Die Casting and Nth Degree, Inc. (similar to the previous quarter).
  • Total non-accruals still have a cost basis of $56.4 million, or 9.5% of the portfolio (at cost) but fair value declined to $29.0 million, or 4.8% of the portfolio (at fair value; previously 5.7%). It should be noted that the equity positions in most of these companies have been marked down to $0 fair value
  • Due to previous repayments, GAIN has a higher portfolio concentration risk with the top five investments accounting for 40% of the portfolio and over 30% of investment income.

On December 11, 2019, GAIN announced the sale of its portfolio company Nth Degree, Inc. to MSouth Equity Partners, an Atlanta-based private equity firm resulting in “significant capital gain on its equity investment. As of September 30, 2019, Nth Degree, Inc. represented 11.7% of the total investment portfolio at fair value and is marked $52 million over cost with a potential realized gain of $1.59 per share using its September 30, 2019, fair value. However, there is a good chance that this amount will be less as discussed next.

Description: https://static.seekingalpha.com/uploads/2019/12/24/2549371-1577194894361403.png

Nth Degree is a provider of exhibit management services and event services to clients across the globe and was acquired by Capitala Group in partnership with GAIN and management in December of 2015 “providing capital and insights to advance Nth Degree to the next phase of growth.”

Capitala Finance Corp (CPTA) received $7.3 million for full repayment of its senior secured debt and received total consideration of $29.4 million for its equity investment, resulting in a realized gain of $25.9 million. Also, as part of the total consideration, CPTA received $6.1 million in rollover equity in the successor entity to Nth Degree.

As shown below, CPTA had its preferred stock portion marked up by around 8 times cost as compared to GAIN which had it marked up by 10 times cost (shown in the previous table) as of September 30, 2019.

Description: https://static.seekingalpha.com/uploads/2019/12/24/2549371-15772006187429645.png

The gains from Nth Degree will be partially offset of by the exit of its investment in B-Dry, LLC in October 2019 resulting in a realized loss of $14.7 million ($0.45 per share) but will not impact NAV per share as it was already written off to $0 (discussed later).

Q. “On the B-Dry write off subsequent to quarter end, how does that impact these excess – the $0.82 you were talking about of excess income for distribution?

A. “Good question. So it would reduce that once that number is realized. The unrealized loss will slip into a realized loss and therefore, reduce the number that I quoted. If you look on our balance sheet, that number actually includes the unrealized piece of the portfolio as well. So if you were to go with a liquidating as of 9-30 perspective and I would point you to the balance sheet of amounts.”

Included in the announcement was the following comment from management mentioning “realizing gains on equity, provides meaningful value to shareholders through stock appreciation and dividend growth” implying that this will likely not be paid in cash but retained to reinvest and grow the regular dividends:

“With the sale of Nth Degree and from inception in 2005, Gladstone Investment has exited 20 of its management supported buy-outs, generating significant net realized gains on these investments in the aggregate,” said David Dullum, President of Gladstone Investment. “Our strategy as a buyout fund, realizing gains on equity, while also generating strong current income during the investment period from debt investments alongside our equity investments, provides meaningful value to shareholders through stock appreciation and dividend growth.”

Previously, GAIN declared a deemed distribution of long-term capital gains of $50 million or $1.52 per share. Shareholders, including myself, were likely disappointed as the “deemed distribution” is not paid in cash to shareholders and is a way for the company to retain the capital with the exception of the taxes paid. It should be noted that if this dividend was paid in cash it would be classified as long-term capital gains to shareholders (20% tax rate).

Also, on the recent earnings call, management mentioned that the Board will evaluate “any further deemed distributions of capital gains similar to the one we declared in March”:

“We anticipate continuing to pay semi-annual supplemental distribution as the portfolio matures and grows and we’re able to manage exits and realize additional capital gains. Of course, we and our Board of Directors will evaluate the ability to make these additional supplemental distributions, the amount and timing as well as any further deemed distributions of capital gains similar to the one we declared in March of 2019.”

As mentioned in the previous reports, the amount of preferred/common equity accounts for 33% of the portfolio fair value (marked well above cost) which needs to be partially monetized and reinvested into secured debt.

Also, there is a good chance for an increase to the regular dividend in 2020 due to retaining the realized gains, preserving NAV per share and the ‘math’ driven coverage of the dividend discussed next.

“Well, we certainly don’t want to cut the dividend. That’s always been a no-no for us and we’ll raise the dividend when we get in a position to raise it. So I would hope that we can raise it sometime in the near future. But we’re – we debate that every time the board gets together. And as you know, our next board meeting is in January, so we’ll keep our eyes on that and I want to raise the dividend. I’m a big proponent of raising the dividend and Dave Dullum and Julia who have to manage the balance sheet and the P&L always pushing back and making sure I don’t get too excited about raising the dividend. But we have a good discussion every quarter about raising the dividend. And I think you should look at the capital gain side of the business. It’s still strong and if you looked at what we could do, if everything works, I think you’ll get really, really happy with the aspect of getting some extra dividends during the next year.”

As mentioned in previous reports, the Board approved the modified asset coverage ratio from 200% to 150%, effective April 10, 2019. However, the company is subject to a minimum asset coverage requirement of 200% with respect to its Series D Term Preferred Stock. Historically, the company has maintained its leverage with a debt-to-equity ratio between 0.60 and 0.70 but is currently 0.45 giving the company plenty of growth capacity.

For the three months ended September 30, 2019, GAIN reported just over its best-case projections with higher-than-expected portfolio yield partially offset lower-than-expected portfolio growth and leverage (debt-to-equity). ‘Other Income’ and ‘Other G&A’ (net of credits) are inconsistent and have a meaningful impact on dividend coverage.

“Investment income declined slightly due to a $2.9 million decrease in other income, the timing of which can be variable, which affects the $2.3 million increase in interest income which was primarily driven by the collection of past-due amounts upon the exit of one portfolio company.”

Please keep in mind that ‘Core NII’ does not include capital gains incentive fees which are also broken out by the company:


This information was previously made available to subscribers of Premium BDC Reports, along with:

  • GAIN target prices and buying points
  • GAIN risk profile, potential credit issues, and overall rankings
  • GAIN dividend coverage projections and worst-case scenarios
  • Real-time changes to my personal portfolio

To be a successful BDC investor:

  • As companies report results, closely monitor dividend coverage potential and portfolio credit quality.
  • Identify BDCs that fit your risk profile.
  • Establish appropriate price targets based on relative risk and returns (mostly from regular and potential special dividends).
  • Diversify your BDC portfolio with at least five companies. There are around 50 publicly traded BDCs; please be selective.


Solar Senior Capital (SUNS): Downside For ATS Still An Issue

The following is from the SUNS Update that was previously provided to subscribers of Premium BDC Reports along with revised target prices, dividend coverage and risk profile rankings, potential credit issues, earnings/dividend projections, quality of management, fee agreements, and my personal positions for all business development companies (“BDCs”).


SUNS Update Summary:

  • NAV per share decreased by 0.2% and there was around $7 million or $0.43 per share in realized losses during the quarter related to exiting the previously discussed non-accrual investment in Trident USA Health Services.
  • I was expecting a decline in NAV per share related to American Teleconferencing Services being relatively overvalued compared to other BDCs unless there were positive developments with this investment during the recent quarter.
  • However, SUNS did not markdown ATS and the other BDCs still have discounted values implying that there is still downside associated with this investment.
  • SUNS hit its base-case projections covering its dividend only due to continued fee waivers. My primary concern is the continued reliance on fee waivers needed to cover its dividend implying that there could be longer-term dividend coverage issues.
  • However, there will likely be higher returns over the coming quarters from its equity investment in North Mill Capital that previously acquired the $40 million portfolio of Summit Financial Resources.
  • SUNS remains underleveraged with plenty of growth capital and debt-to-equity of 0.84 compared to its target a range of 1.25 to 1.50.

Solar Senior Capital (SUNS) net asset value (“NAV”) per share decreased by 0.2% or $0.03 (form $16.34 to $16.31) and there was around $7 million or $0.43 per share in realized losses during the quarter related to exiting the previously discussed non-accrual investment in Trident USA Health Services. However, NAV per share was not impacted due to mostly being written off during the previous quarter. As mentioned in the previous report, I was expecting a decline in NAV per share related to American Teleconferencing Services being relatively overvalued compared to other BDCs “unless there were positive developments with this investment during the recent quarter”. SUNS did not markdown ATS during Q3 and the other BDCs still have the same discounts for their ATS investments as shown in the following table. CSWC marked a portion lower so there is clearly some downside coming for SUNS NAV and is likely not priced into the stock yet. PFLT has not released its SEC filings for calendar Q3 2019, and this investment will likely be discussed on the upcoming earnings call.


SUNS hit its base-case projections covering its dividend only due to continued fee waivers. My primary concern is the continued reliance on fee waivers needed to cover its dividend over the last four quarters (see details below) implying that there could be longer-term dividend coverage issues. However, there will likely be higher returns over the coming quarters from its equity investment in North Mill Capital (“NMC”) that previously acquired the $40 million portfolio of Summit Financial Resources:

“The Company continued its solid operating performance during the third quarter of 2019 with strong fundamentals of our portfolio companies and at 9/30/2019, 100% of the portfolio is performing. While it is early in the integration of North Mill Capital’s acquisition of Summit Financial Resources last quarter, we are encouraged by the broader geographic coverage and expanded pipeline of attractive investment opportunities across the platform. We continue to actively seek acquisitions to further build our asset-based lending capabilities. SUNS has ample capital to expand our specialty finance platform while continuing to be highly selective in cash flow lending.”


Its equity investment in NMC remains around 14% of the total portfolio but the weighted average yield from NMC increased from 13.5% to 14.2%.


SUNS remains a component in the ‘Risk Averse’ portfolio due to “true first-lien” positions, historically stable net asset value (“NAV”) and low non-accruals. Management has a history of doing the right thing including waiving fees to cover the dividend without the need to “reach for yield” and deploying capital in a prudent manner. The Board declared a monthly distribution for November of $0.1175 per share payable on December 3, 2019.


SUNS Liquidity and Capital Resources

As mentioned in previous reports, shareholders approved the reduced asset coverage ratio allowing for higher leverage and the immediate integration of its First Lien Loan Program (“FLLP”). SUNS will target a range of 1.25 to 1.50 debt-to-equity and took on additional debt associated with the FLLP but its debt-to-equity is still only 0.84.

Previously, SUNS announced that it had amended its credit facilities’ leverage covenants to allow for the asset coverage ratio minimum of 150%. As of September 30, 2019, SUNS had over $75 million of unused borrowing capacity under its revolving credit facilities. However, including NMC and Gemino non-recourse credit facilities, the company had approximately $155 million of unused borrowing capacity under its revolving credit facilities.


This information was previously made available to subscribers of Premium BDC Reports, along with:

  • SUNS target prices and buying points
  • SUNS risk profile, potential credit issues, and overall rankings
  • SUNS dividend coverage projections and worst-case scenarios
  • Real-time changes to my personal portfolio

To be a successful BDC investor:

  • As companies report results, closely monitor dividend coverage potential and portfolio credit quality.
  • Identify BDCs that fit your risk profile.
  • Establish appropriate price targets based on relative risk and returns (mostly from regular and potential special dividends).
  • Diversify your BDC portfolio with at least five companies. There are around 50 publicly traded BDCs; please be selective.


Owl Rock Capital (ORCC) Dividend Coverage & Risk Profile Update

The following is from the ORCC Update that was previously provided to subscribers of Premium BDC Reports along with revised target prices, dividend coverage and risk profile rankings, potential credit issues, earnings/dividend projections, quality of management, fee agreements, and my personal positions for all business development companies (“BDCs”).


ORCC Q3 2019 Update Summary

  • ORCC hit its base case projected earnings of $0.36 per share covering its total Q3 dividends of $0.33 per share by 109%. But please keep in mind that this is only due to waived management and incentive fees (discussed later) until the company can grow the portfolio increasing its debt-to-equity which is only 0.42.
  • Management previously provided guidance of growing its portfolio to around $10 billion with a targeted debt-to-equity ratio of 0.75 over the next two to three years.
  • ORCC’s net asset value per share declined slightly by around 0.4% or $0.06 due to expenses associated with its IPO of $0.03 per share and minor markdowns in select investments that will be discussed in the updated ORCC Deep Dive report.
  • Credit quality remains strong with no non-accruals and 79% first-lien. However, ORCC has a relatively new portfolio which has grown quickly over the last 5 quarters. Portfolio investments typically take at least 6 to 8 quarters before becoming credit issues so this needs to be watched closely over the coming quarters.
  • There is the possibility for pressure on the stock price as pre-IPO shares start to become available in 2020. However, many of these shares are held by longer-term investors. Management mentioned that they communicate with their larger shareholders frequently and expect that they will continue to support the stock.
  • I will alert subscribers well before these dates so that they can be ready to make potential purchases.
  • On July 7, 2019, the Board approved its 10b5-1 Repurchase Plan, to acquire up to $150 million in stock at prices below its $15.22 NAV per share.

Owl Rock Capital Corporation (ORCC) is the second-largest publicly traded BDC (much larger than MAIN, PSEC, GBDC, NMFC, and AINV) with investments in 96 portfolio companies valued at $8.3 billion that are mostly first-lien secured debt positions. On July 22, 2019, ORCC closed its initial public offering (“IPO”), issuing 10 million shares of its common stock at a public offering price of $15.30 per share. Net of underwriting fees and offering costs, the company received total cash proceeds of $141.3 million. ORCC is one of the few BDCs rated by all of the major credit agencies. The common stock began trading on the NYSE under the symbol “ORCC” on July 18, 2019.


For Q3 2019, Owl Rock Capital Corporation (ORCC) hit its base case projected earnings of $0.36 per share covering its total Q3 dividends of $0.33 per share by 109%. But please keep in mind that this is only due to waived management and incentive fees (discussed later) until the company can grow the portfolio increasing its debt-to-equity which is only 0.42. Management has provided guidance of growing its portfolio to around $10 billion with a targeted debt-to-equity ratio of 0.75 over the next two to three years.


On October 30, 2019, the Board declared a distribution of $0.31 per share, for shareholders of record on September 30, 2019, payable on or before November 15, 2019. The Board previously declared the following special distributions that are likely temporary and only due to the five quarters of waived management and incentive fees discussed later.


As of September 30, 2019, based on fair value, the portfolio consisted of 79% first lien senior secured debt investments, 19% second lien senior secured debt investments, 1% investment funds and vehicles, and less than 1% in equity investments.


There was a slight shift in portfolio mix toward second-lien due to 34% of new investments considered second-lien during Q3 2019:


ORCC’s net asset value per share declined slightly by around 0.4% or $0.06 due to expenses associated with its IPO of $0.03 per share and minor markdowns in select investments that will be discussed in the updated ORCC Deep Dive report.


Similar to previous quarters, there were no investments on non-accrual status. However, ORCC has a relatively new portfolio which has grown quickly over the last 5 quarters. Portfolio investments typically take at least 6 to 8 quarters before becoming credit issues so this needs to be watched closely over the coming quarters.


Credit quality remains strong with no previous non-accruals and only 5.4% with “Investments Rating 3” which is a borrower “performing below expectations and indicates that the loan’s risk has increased somewhat since origination or acquisition”:


The portfolio is highly diversified with the top 10 positions accounting for around 25% of the portfolio with oil, energy and gas exposure of around 4.1%.


ORCC Stock Repurchase Plan, Use of Leverage & Capital Structure

On July 7, 2019, the Board approved its 10b5-1 Repurchase Plan, to acquire up to $150 million in stock at prices below NAV per share starting August 19, 2019, ending on February 19, 2021 or “as the approved $150 million repurchase amount has been fully utilized.”

“The Company agent will repurchase shares of common stock on the Company’s behalf when the market price per share is below the most recently reported net asset value per share. This corresponds to a market price of $15.21 based on September 30, 2019 NAV per share of $15.22. The Company 10b5-1 Plan commenced August 19, 2019 and will terminate upon the earliest to occur of (I) February 19, 2021 or (II) such time as the approved $150 million repurchase amount has been fully utilized, subject to certain conditions. The Company 10b5-1 Plan is intended to allow us to repurchase our common stock at times when we otherwise might be prevented from doing so under insider trading laws. Under the Company 10b5-1 Plan, the agent will increase the volume of purchases made as the price of our common stock declines, subject to volume restrictions.”

As of September 30, 2019, ORCC had a debt-to-equity ratio of around 0.42 with plenty of growth capital including $198 million of cash and $1.6 billion available under its credit facilities. Neither the Board nor the shareholders are being asked to approve a reduced asset coverage ratio which means a maximum debt-to-equity ratio of 1.00. Also, before incurring any such additional leverage, the company would have to renegotiate or receive a waiver from the contractual leverage limitations under the existing credit facilities and notes.


ORCC Pre-IPO Share Lock-Ups

There is the possibility for technical pressure on the stock price as pre-IPO shares start to become available in 2020.I will alert subscribers well before these dates so that they can be ready to make potential purchases.

However, this was discussed on the recent earnings call and many of these shares are held by longer-term institutional investors. Management mentioned that they communicate with their larger shareholders frequently and expect that they will continue to support the stock.

Upon completion of this offering, we will have 383,193,244 shares of common stock outstanding (or 384,618,244 shares of common stock if the underwriters’ exercise their option to purchase additional shares of our common stock). The shares of common stock sold in the offering will be freely tradable without restriction or limitation under the Securities Act.

Any shares purchased in this offering or currently owned by our affiliates, as defined in the Securities Act, will be subject to the public information, manner of sale and volume limitations of Rule 144 under the Securities Act. The remaining shares of our common stock that will be outstanding upon the completion of this offering will be “restricted securities” under the meaning of Rule 144 promulgated under the Securities Act and may only be sold if such sale is registered under the Securities Act or exempt from registration, including the exemption under Rule 144. See “Shares Eligible for Future Sale.”

Following our IPO, without the prior written consent of our Board:

for 180 days, a shareholder is not permitted to transfer (whether by sale, gift, merger, by operation of law or otherwise), exchange, assign, pledge, hypothecate or otherwise dispose of or encumber any shares of common stock held by such shareholder prior to the date of the IPO;

for 270 days, a shareholder is not permitted to transfer (whether by sale, gift, merger, by operation of law or otherwise), exchange, assign, pledge, hypothecate or otherwise dispose of or encumber two-thirds of the shares of common stock held by such shareholder prior to the date of the IPO; and

for 365 days, a shareholder is not permitted to transfer (whether by sale, gift, merger, by operation of law or otherwise), exchange, assign, pledge, hypothecate or otherwise dispose of or encumber one-third of the shares of common stock held by such shareholder prior to the IPO.

This means that, as a result of these transfer restrictions, without the consent of our Board, a shareholder who owned 99 shares of common stock on the date of the IPO could not sell any of such shares for 180 days following the IPO; 181 days following the IPO, such shareholder could only sell up to 33 of such shares; 271 days following the IPO, such shareholder could only sell up to 66 of such shares and 366 days following the IPO, such shareholder could sell all of such shares.

ORCC Management Fees

On February 27, 2019, the Adviser agreed at all times prior to the fifteen-month anniversary of an Exchange Listing (which includes the IPO), to waive any portion of the Management Fee that is in excess of 0.75% of the Company’s gross assets, excluding cash and cash equivalents but including assets purchased with borrowed amounts at the end of the two most recently completed calendar quarters, calculated in accordance with the Investment Advisory Agreement.

On February 27, 2019, the Adviser agreed at all times prior to the fifteen-month anniversary of an Exchange Listing (which includes the IPO), to waive the Incentive Fee (including, for the avoidance of doubt, the Capital Gains Incentive Fee).

The management fee is 1.5% and excludes cash and after the offering, the advisor is entitled to pre-incentive fees NII of 17.5% with a hurdle rate of 6% annually as well as 17.5% of cumulative realized capital gains:

“The second component of the incentive fee, the capital gains incentive fee, payable at the end of each calendar year in arrears, equals 17.5% of cumulative realized capital gains from the date on which the Exchange Listing becomes effective (the “Listing Date”) to the end of each calendar year, less cumulative realized capital losses and unrealized capital depreciation from the Listing Date to the end of each calendar year, less the aggregate amount of any previously paid capital gains incentive fee for prior periods.”


This information was previously made available to subscribers of Premium BDC Reports, along with:

  • ORCC target prices and buying points
  • ORCC risk profile, potential credit issues, and overall rankings
  • ORCC dividend coverage projections and worst-case scenarios
  • Real-time changes to my personal portfolio

To be a successful BDC investor:

  • As companies report results, closely monitor dividend coverage potential and portfolio credit quality.
  • Identify BDCs that fit your risk profile.
  • Establish appropriate price targets based on relative risk and returns (mostly from regular and potential special dividends).
  • Diversify your BDC portfolio with at least five companies. There are around 50 publicly traded BDCs; please be selective.