Ares Capital (ARCC) Dividend Coverage & Risk Profile Update

The following is from the ARCC Update that was previously provided to subscribers of Premium BDC Reports along with revised target prices, dividend coverage and risk profile rankings, potential credit issues, earnings/dividend projections, quality of management, fee agreements, and my personal positions for all business development companies (“BDCs”).


Quick Update:

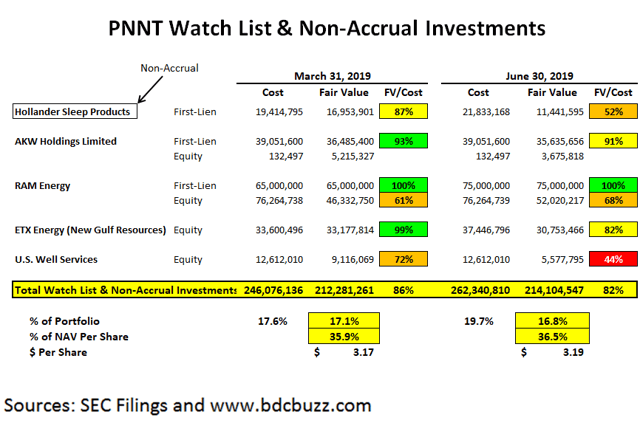
Last month, there was a notice of “3,000 more layoffs are expected in New Jersey as health care industry changes and store closings are expected to impact the state” that included Alcami Corporation which is expected to layoff 27 people on December 27, 2019. It should be noted that this investment is already included in Ares Capital (ARCC) ‘watch list’ and will be discussed in the updated Deep Dive report.


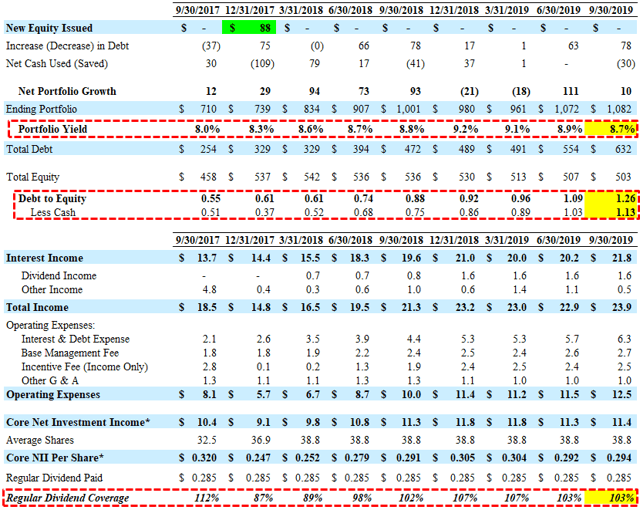
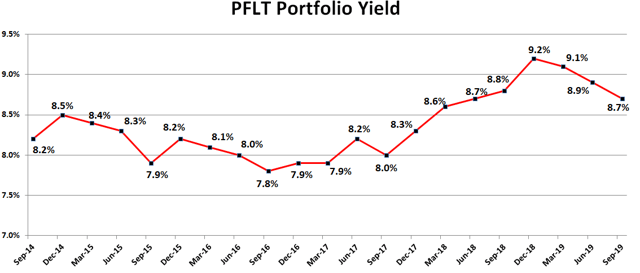
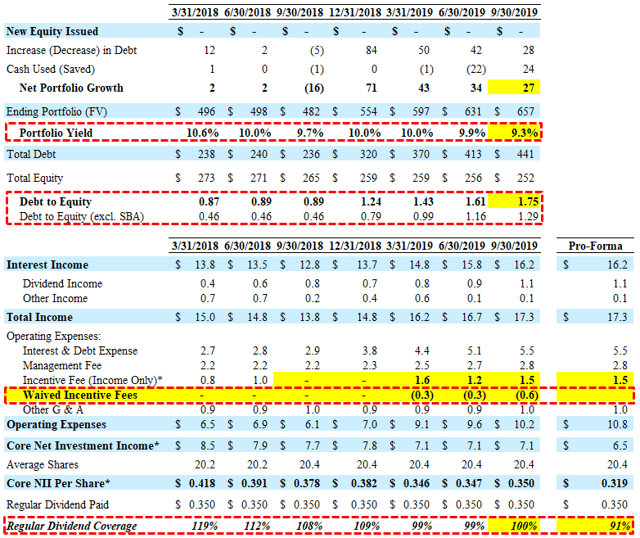
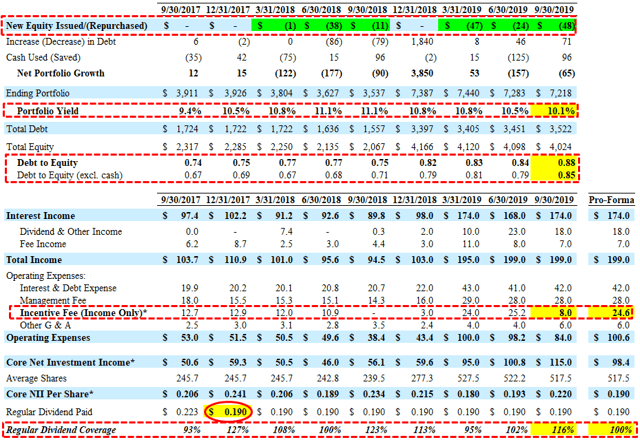
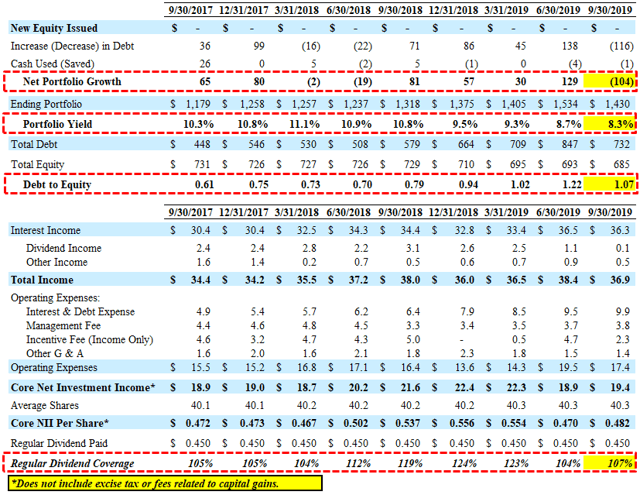
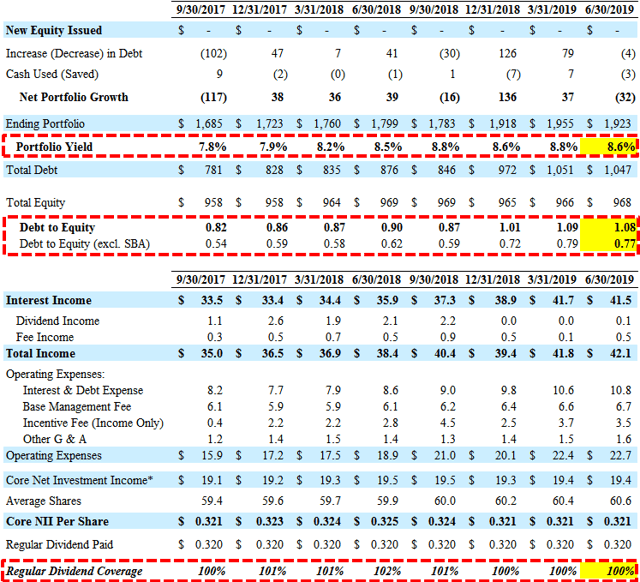
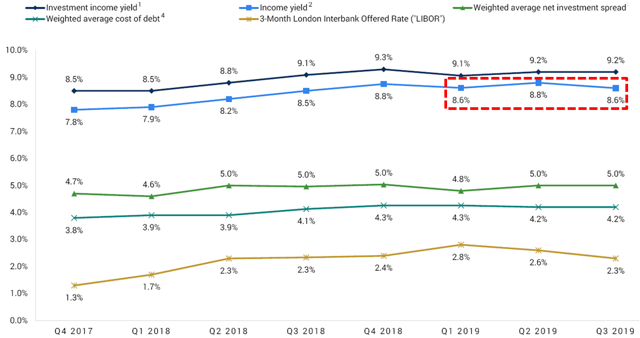
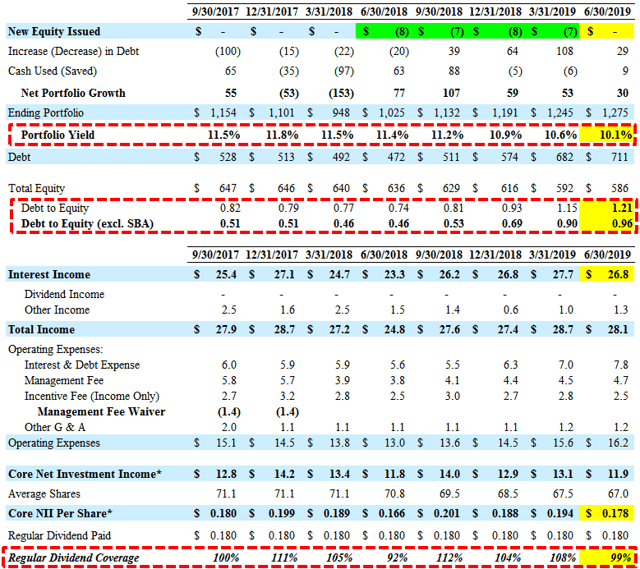
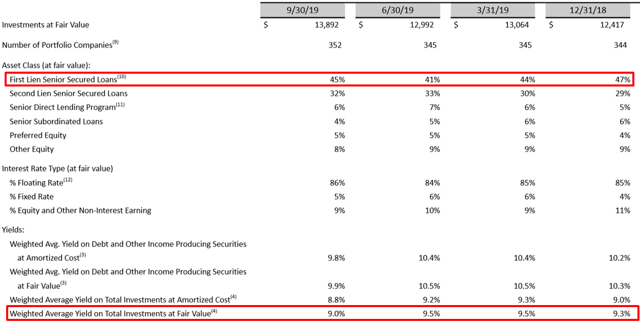
Ares Capital (ARCC) beat its base-case Q3 2019 projections mostly due to higher-than-expected portfolio growth and continued higher dividend and fee income covering its regular dividend by 123%. Its portfolio yield declined more than expected (from 9.5% to 9.0%) due to onboarding investments at lower yields. The company declared a fourth quarter dividend of $0.40 per share and confirmed the additional dividend of $0.02 per share per quarter.

Kipp deVeer, CEO: “We reported another strong quarter of core earnings well in excess of our dividend and experienced continued stable credit quality. We continue to benefit from our broad market coverage and extensive relationships which enable us to originate attractive investments and remain highly selective.”

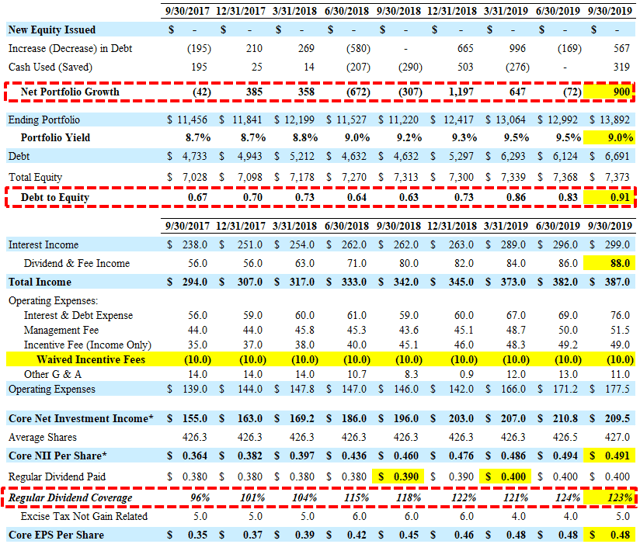
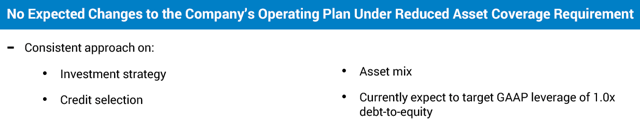
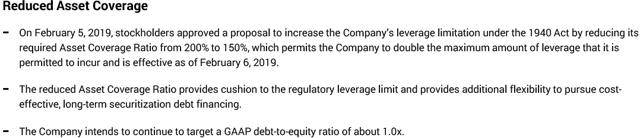
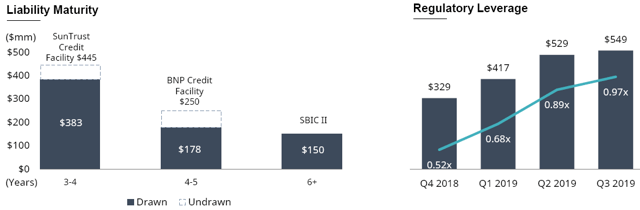
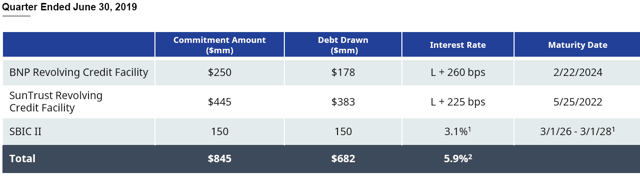
Its debt-to-equity reached its highest level increasing from 0.83 to 0.91 As mentioned in previous reports, ARCC expects to use incremental leverage to continue to invest “primarily in its current mix of investments with no fundamental change in its investment objective and intends to target a debt to equity range of 0.90x to 1.25x.” Effective June 21, 2019, Ares Capital’s asset coverage requirement applicable to senior securities was reduced from 200% to 150% and its annual base management fee was reduced from 1.5% to 1.0% on all assets financed using leverage over 1.0x debt to equity.

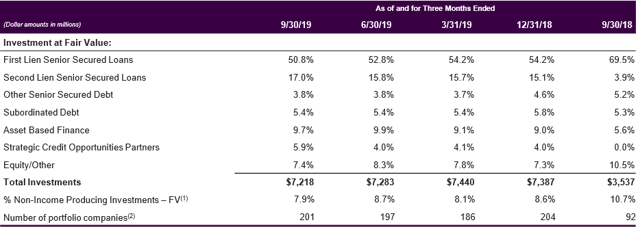
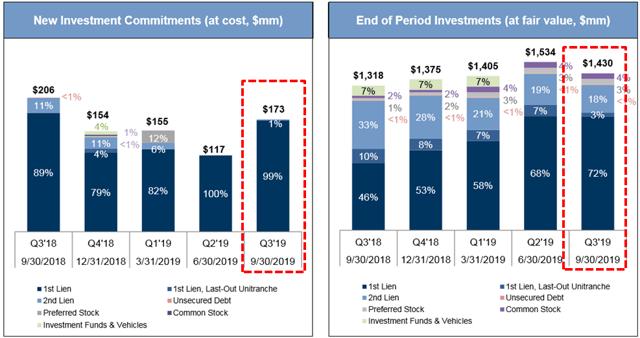
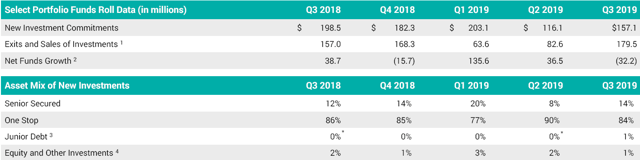
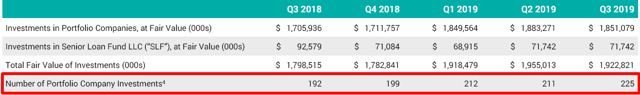
During Q3 2019, ARCC made $2.4 billion in new investment commitments, 90% were in first lien senior secured loans, 7% were in second lien senior secured loans, 1% were in the subordinated certificates of the Senior Direct Lending Program (“SDLP”), and 2% were in other equity securities. Also, the company exited $1.4 billion of investment commitments, 73% were first lien senior secured loans, 9% were second lien senior secured loans, 10% were senior subordinated loans, 7% were subordinated certificates of the SDLP, and 1% were other equity securities.

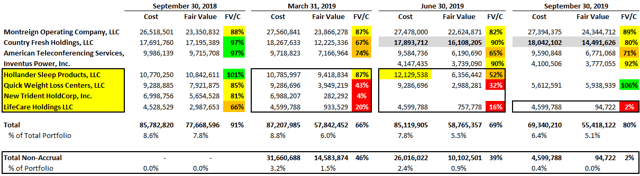
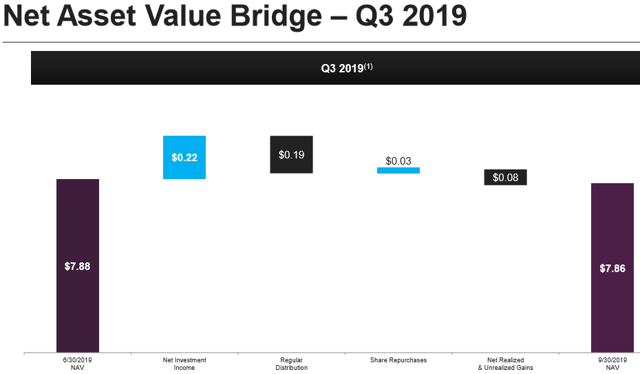
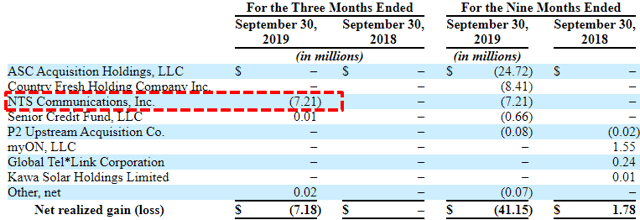
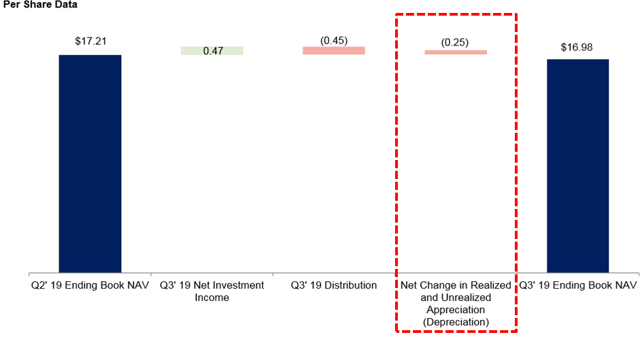
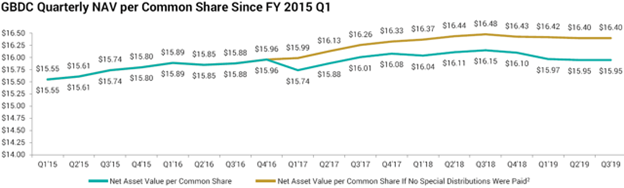
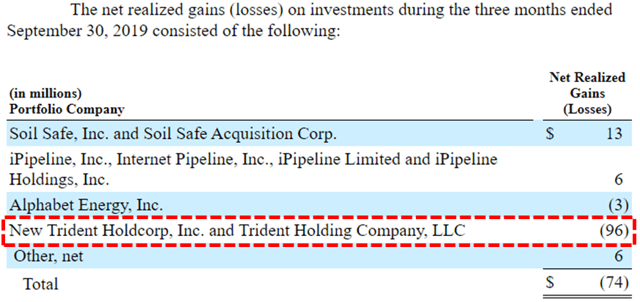
Its net asset value (“NAV”) per share remained mostly stable (decreased from $17.27 to $17.26) due to net unrealized/realized losses during the quarter mostly offset by overearning the dividends. ARCC experienced net realized losses of $63 million during Q3 2019 due to exiting its investment in New Trident Holdcorp that was previous its largest non-accrual investment:

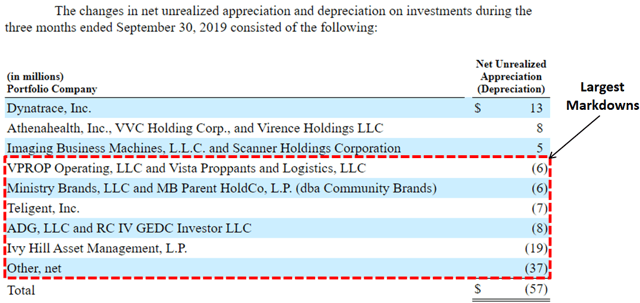
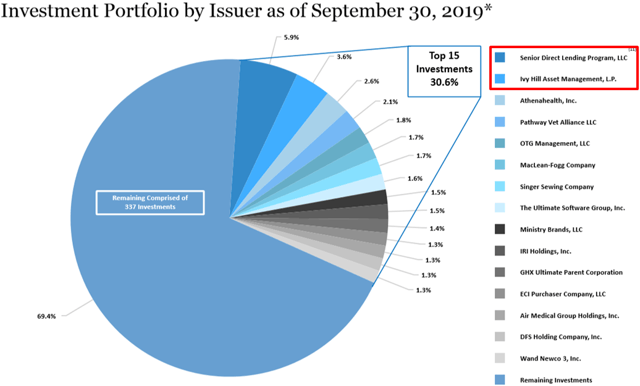
Some of the largest markdowns during Q3 2019 were Ivy Hill Asset Management (same as the previous quarter), and watch list investment ADG, LLC and RC IV GEDC.

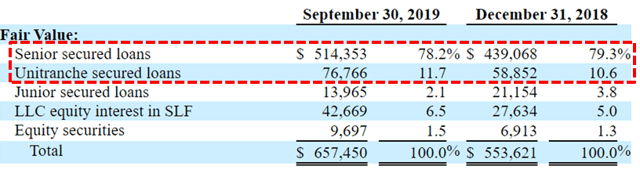
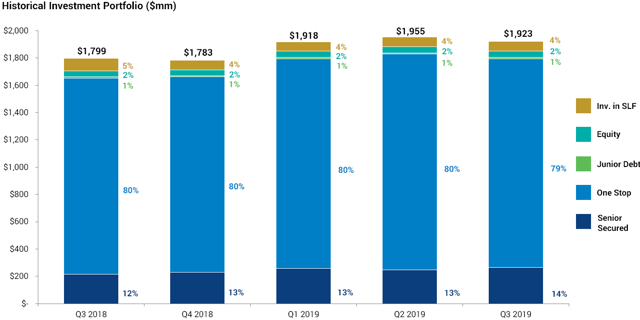
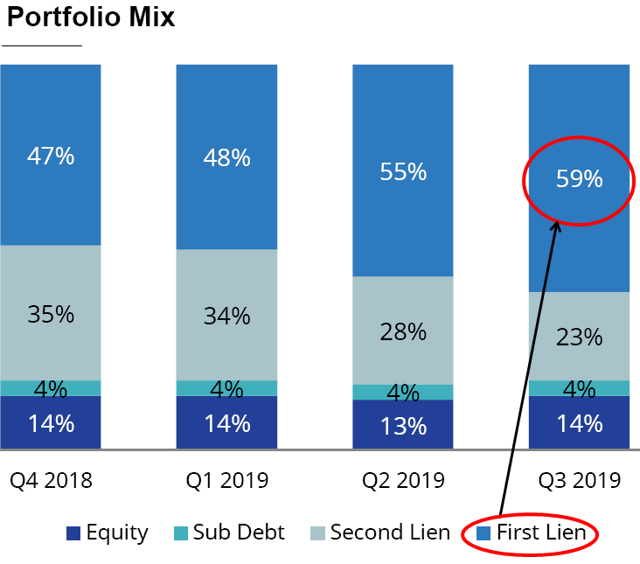
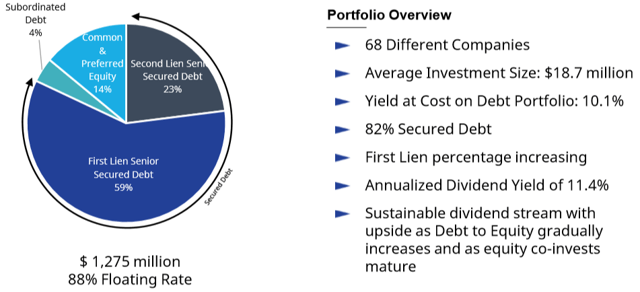
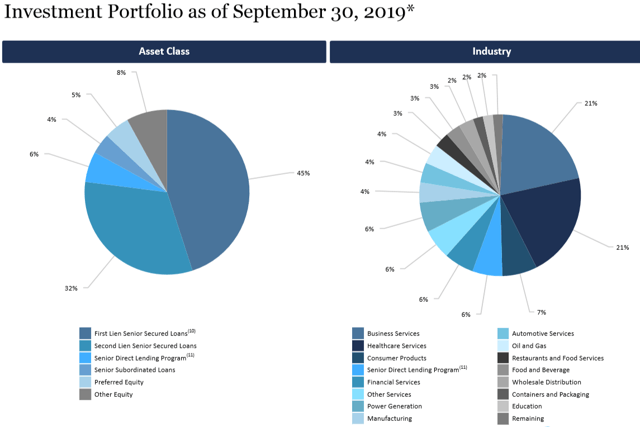
There was a positive shift in its portfolio asset mix toward first-lien positions that now account for 45% of the portfolio (previously 41%) along with 32% second-lien, 6% of subordinated certificates of the SDLP, 4% of senior subordinated loans, 5% of preferred equity securities and 8% of other equity securities.

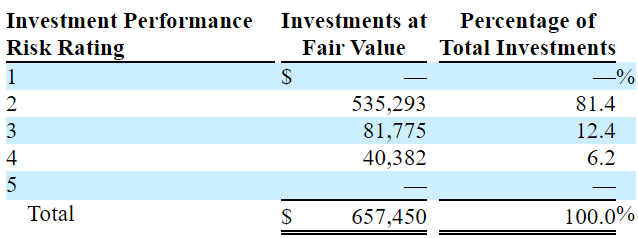
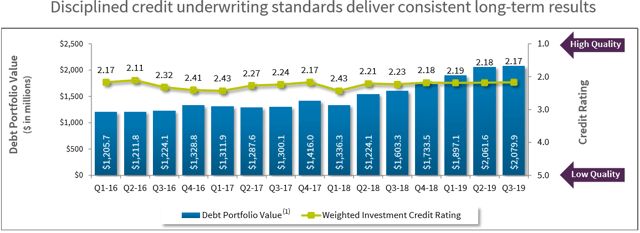
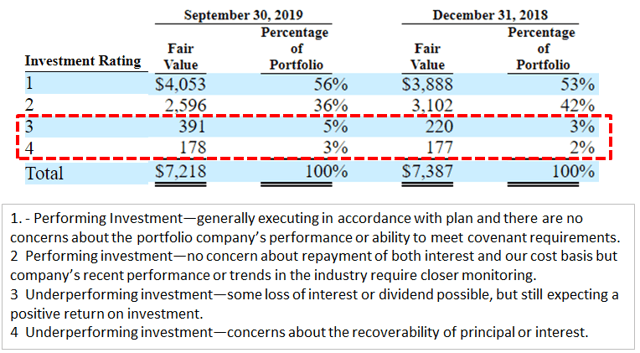
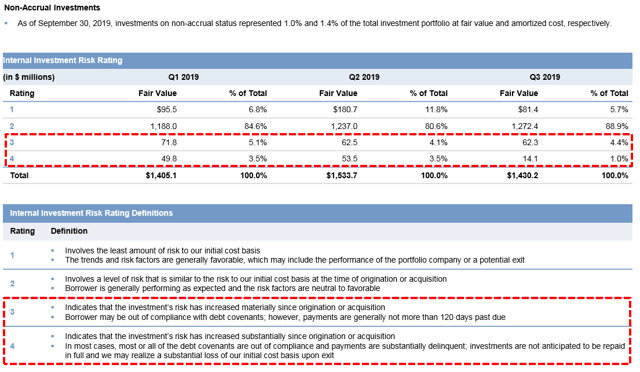
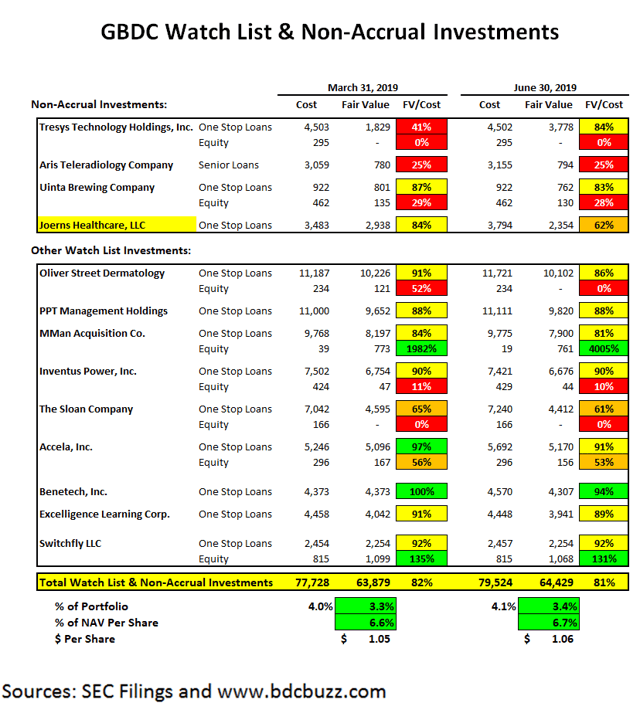
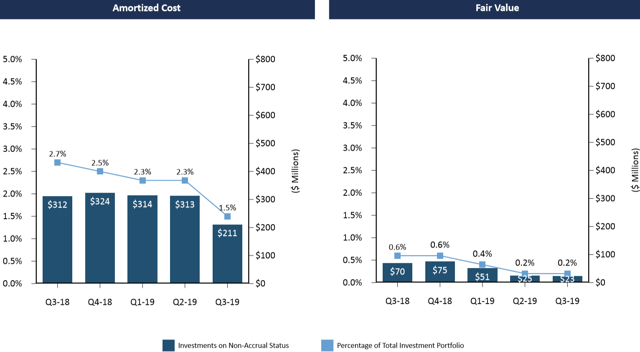
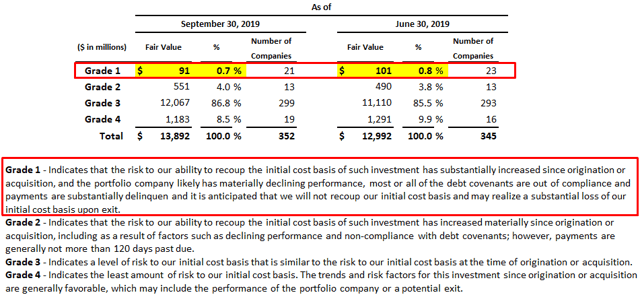
Non-accrual investments declined due to exiting New Trident Holdcorp and remain low at 0.2% fair value and 1.5% of cost with the weighted average grade of the investments in the portfolio at fair value remains around 3.0.

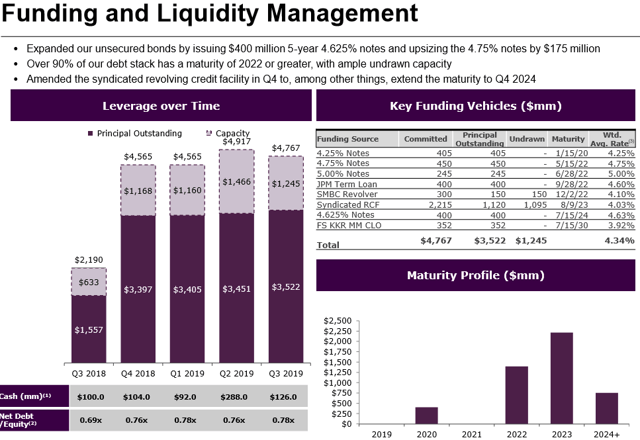
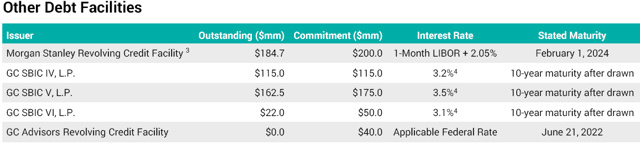
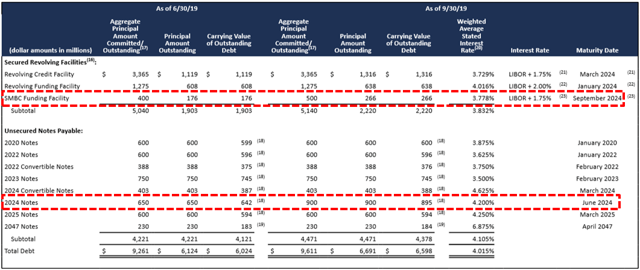
As of September 30, 2019, ARCC had $253 million in cash and cash equivalents and approximately $2.9 billion available for additional borrowings under its existing credit facilities.

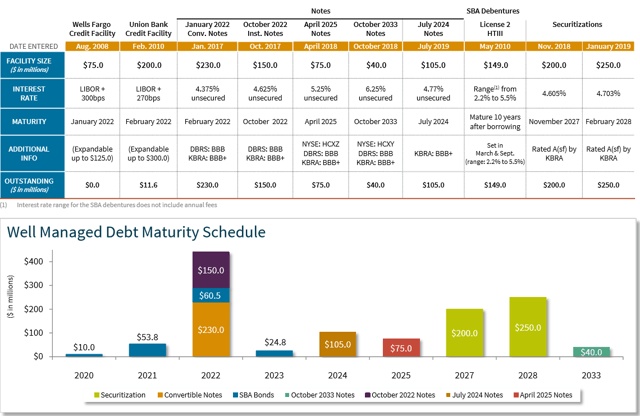
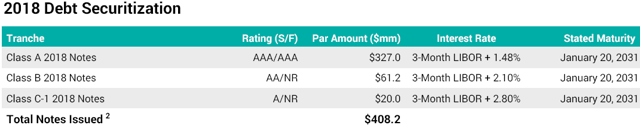
  • In September 2019, ARCC issued an additional $250 million in aggregate principal amount of unsecured notes, which bear interest at a rate of 4.200% per year and mature on June 10, 2024 (the “Additional 2024 Notes”). The Additional 2024 Notes were issued at a premium to the principal amount.
  • In September 2019, ARCC amended the SMBC Funding Facility to, among other things, increase the commitments under the facility from $400 million to $500 million, with the ability to upsize to $800 million.

Penni Roll, CFO: “In the third quarter, we further executed on our strategy of increasing and extending our sources of committed financing. After upsizing and extending the maturity of our SMBC Funding Facility, as well as successfully re-opening our 2024 notes, we ended the quarter with nearly $3 billion of available cash and undrawn committed borrowing capacity. We believe our deep liquidity position and long dated funding enhances the strength of our balance sheet and supports our ability to invest opportunistically across varying market conditions.”

—————–

—————–

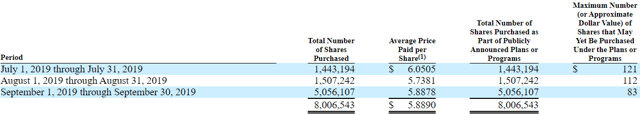
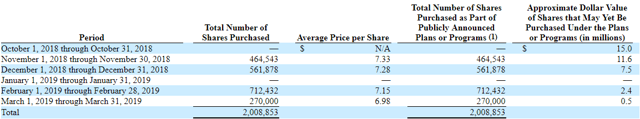
In February 2019, ARCC’s Board authorized an amendment to its stock repurchase program to increase the program from $300 million to $500 million and extend the expiration date of the program from February 28, 2019 to February 28, 2020. There were no shares repurchased during the three months ended September 30, 2019. As of September 30, 2019, the approximate dollar value of shares that may yet be purchased under the program was $493 million.

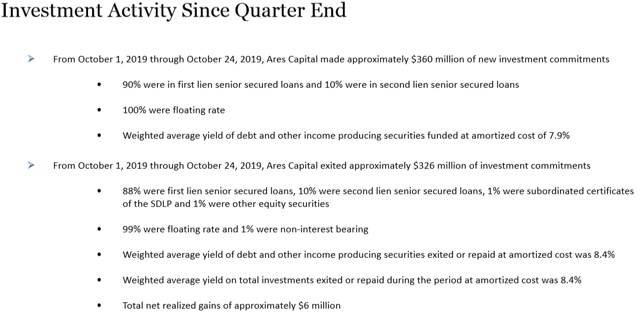
From October 1, 2019 through October 24, 2019, ARCC made new investment commitments of approximately $360 million, of which $311 million were funded. Of these new commitments, 90% were in first lien senior secured loans and 10% were in second lien senior secured loans. The weighted average yield of debt and other income producing securities funded during the period at amortized cost was 7.9%.

From October 1, 2019 through October 24, 2019, ARCC exited approximately $326 million of investment commitments. Of the total investment commitments, 88% were first lien senior secured loans, 10% were second lien senior secured loans, 1% were subordinated certificates of the SDLP and 1% were other equity securities. The weighted average yield of debt and other income producing securities exited or repaid during the period at amortized cost was 8.4% and the weighted average yield on total investments exited or repaid during the period at amortized cost was 8.4%. On the approximately $326 million of investment commitments exited from October 1, 2019 through October 24, 2019, ARCC recognized total net realized gains of approximately $6 million.

In addition, as of October 24, 2019, Ares Capital had an investment backlog and pipeline of approximately $665 million and $265 million, respectively.

—————–

As mentioned in previous reports, dividend coverage should continue to improve (excluding the fee waivers that end in Q3 2019) over the coming quarters due to the following:

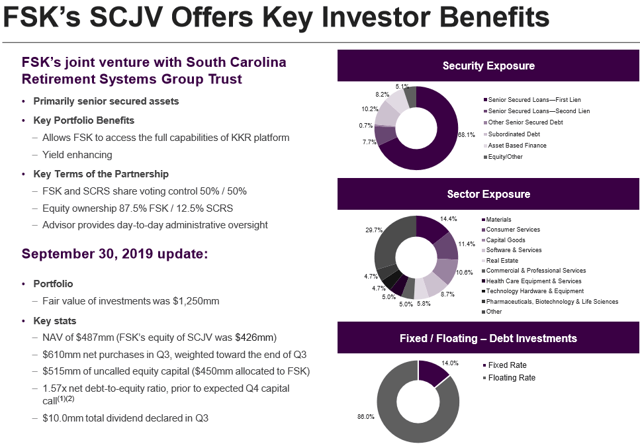
  • Utilizing its 30% non-qualified bucket for higher portfolio yield and fee income. This includes the ramping of its SDLP joint venture and Ivy Hill Asset Management.
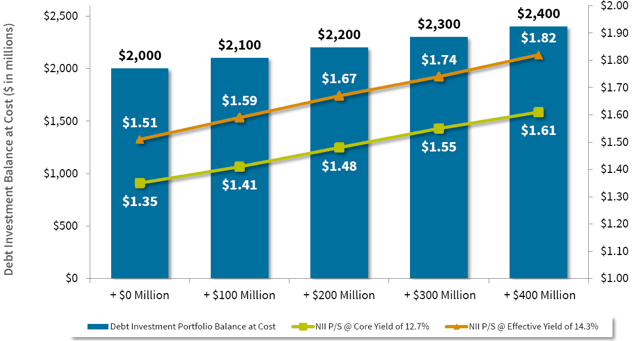
  • Increased leverage and portfolio growth
  • Increased fee income
  • Reduced borrowing rates

BDCs are allowed a maximum of 30% of total assets to be considered non-qualified which includes the Senior Direct Lending Program (“SDLP”) and Ivy Hill Asset Management (“IHAM”). ARCC continues to utilize its 30% non-qualified bucket which includes the SDLP and IHAM that currently account for almost 10% of the portfolio.

—————–


This information was previously made available to subscribers of Premium BDC Reports, along with:

  • ARCC target prices and buying points
  • ARCC risk profile, potential credit issues, and overall rankings
  • ARCC dividend coverage projections and worst-case scenarios
  • Real-time changes to my personal portfolio

To be a successful BDC investor:

  • As companies report results, closely monitor dividend coverage potential and portfolio credit quality.
  • Identify BDCs that fit your risk profile.
  • Establish appropriate price targets based on relative risk and returns (mostly from regular and potential special dividends).
  • Diversify your BDC portfolio with at least five companies. There are around 50 publicly traded BDCs; please be selective.


BlackRock TCP Capital (TCPC) Dividend Coverage & Risk Profile Update

The following is from the TCPC Update that was previously provided to subscribers of Premium BDC Reports along with revised target prices, dividend coverage and risk profile rankings, potential credit issues, earnings/dividend projections, quality of management, fee agreements, and my personal positions for all business development companies (“BDCs”).


BlackRock TCP Capital (TCPC) beat its best case projections covering its dividend by 120% that included $0.06 per share of income related to prepayment premiums and accelerated original issue discount amortization. The company also reported strong originations:

—————–

Howard Levkowitz, TCPC Chairman and CEO: “We are pleased to have continued our record of covering our dividend for the 30th consecutive quarter, with a dividend coverage ratio of 119% in the third quarter. We also further expanded our diverse leverage program by completing a $150 million unsecured note issuance at an attractive interest rate of 3.9%., While our income reflected significant repayments, we were able to offset those repayments with another quarter of strong originations. We continue to have a solid pipeline of new investment opportunities and believe we are well-positioned to continue to deliver attractive risk-adjusted returns to our shareholders.”


Its net asset value (“NAV”) per share declined slightly by $0.05 or 0.4% (from $13.64 to $13.59) mostly due to unrealized losses from previously discussed investments partially offset by overearning the dividend. Similar to the previous quarter, the largest markdown was its investment in Fidelis Acquisitions, LLC (“Fidelis”) that was added to non-accrual in Q2 2019 and marked down another $5.7 million during Q3 2019.


As of September 30, 2019, available liquidity was $432 million, including $347 million in available borrowing capacity and $80 million in cash and cash equivalents. On August 23, 2019, the company issued $150 million of unsecured 3.900% notes that mature on August 23, 2024. Also in August 2019, the company expanded the total capacity of its SVCP Facility by $50 million to $270 million. On November 7, 2018, Moody’s Investors Service initiated an investment grade rating of Baa3, with stable outlook. On November 8, 2018, S&P Global Ratings reaffirmed its investment-grade rating of BBB-, with negative outlook. Both ratings include consideration of the Company’s reduced asset coverage requirement.


The company consistently over-earns its dividend growing its undistributed taxable income plus roll-forward spillover that will hopefully be used for potential special dividends.


As shown below, TCPC’s portfolio is highly diversified by borrower and sector with only three portfolio companies that contribute 3% or more to dividend coverage:


On February 8, 2019, shareholders approved the reduced asset coverage ratio allowing higher leverage and reduced management fee to 1.00% on assets financed using leverage over 1.00 debt-to-equity, reduced incentive fees from 20.0% to 17.5% and hurdle rate from 8% to 7% as well as “continue to operate in a manner that will maintain its investment-grade rating”.

On August 6, 2019, the Board re-approved its stock repurchase plan to acquire up to $50 million of common stock at prices below NAV per share, “in accordance with the guidelines specified in Rule 10b-18 and Rule 10b5-1”. There is a good chance that the company will repurchase additional shares if the stock price declines below NAV again which is now $13.59 (reduced asset coverage ratio and higher leverage can be used for accretive stock repurchases).


This information was previously made available to subscribers of Premium BDC Reports, along with:

  • TCPC target prices and buying points
  • TCPC risk profile, potential credit issues, and overall rankings
  • TCPC dividend coverage projections and worst-case scenarios
  • Real-time changes to my personal portfolio

To be a successful BDC investor:

  • As companies report results, closely monitor dividend coverage potential and portfolio credit quality.
  • Identify BDCs that fit your risk profile.
  • Establish appropriate price targets based on relative risk and returns (mostly from regular and potential special dividends).
  • Diversify your BDC portfolio with at least five companies. There are around 50 publicly traded BDCs; please be selective.


PennantPark Floating Rate Capital (PFLT) Dividend Coverage & Risk Profile Update

The following is from the PFLT Update that was previously provided to subscribers of Premium BDC Reports along with revised target prices, dividend coverage and risk profile rankings, potential credit issues, earnings/dividend projections, quality of management, fee agreements, and my personal positions for all business development companies (“BDCs”).


PennantPark Floating Rate Capital (PFLT) net asset value (“NAV”) per share declined by $0.10 or 0.8% (from $13.07 to $12.97) mostly due to the previously discussed investments including Country Fresh Holdings that is still not considered a ‘non-accrual’ but was restructured during the previous quarter. The following is from the PFLT update earlier this week:

“As discussed in the PFLT Deep Dive report, I am expecting the resolution for many of the recent credit issues and will be watching closely with the updated results. However, there is a good chance that its position in LifeCare Holdings LLC will be mostly written off due to a recent disclosure statement filed on November 15, 2019.”

As predicted, PFLT exited its non-accrual investment in Hollander Sleep Products and restructured its non-accrual investment in Quick Weight Loss Centers during the quarter. LifeCare Holdings remains the only investment currently on non-accrual status and was mostly written off during the recent quarter likely for the reasons discussed in the previous update. Non-accruals are now only 0.4% of the portfolio at cost and 0.0% at fair value with no further meaningful impacts to NAV per share. Also predicted in the previous report, its investment in Montreign Operating Company was marked up.


LifeCare Holdings is a bankrupt operator of senior care facilities filed a liquidation plan that would largely shut out creditors after selling off assets. There is a confirmation hearing set for January 14, 2020. However, it should be pointed out that this investment is already flagged as part of the ‘watch list’ in the previous Deep Dive report and is now mostly written off as of September 30, 2019, compared to the estimated 6% “projected recovery” discussed below:

For calendar Q3 2019, PFLT reported just above its base case projections with continued higher use of leverage partially offset by lower portfolio yield. Dividend income from the PennantPark Senior Secured Loan Fund (“PSSL”) remained stable.

For the three months ended September 30, 2019, PFLT invested $141 million of in 6 new and 23 existing portfolio companies with a weighted average yield of 8.5% with sales and repayments of $127 million. As expected, the company continues to increase leverage with a debt-to-equity of 1.26 (1.13 excluding cash) utilizing its Board approved reduced asset coverage ratio, effective as of April 5, 2019.

Art Penn, Chairman and CEO. “We are pleased that our strategy and execution has resulted in net investment income covering our dividend. We believe that our earnings stream will continue to have a nice tailwind, creating value for our investors as we gradually increase our debt to equity ratio, while maintaining a prudent debt profile. Additionally, our overall portfolio continues to perform well. Our portfolio companies generally have strong underlying financial performance.”


As discussed in previous reports, PFLT’s portfolio yield was increasing primarily due to rising LIBOR and additional returns from the PSSL.


PFLT has grown its PSSL portfolio from $425 million to $489 million over the last four quarters but the weighted average yield on investments decreased from 7.8% to 7.6%:


The portfolio remains predominantly invested in first-lien debt at around 76% portfolio and the PSSL has grown from 9% to 16% over the last five quarters. It is important to note that its PSSL is 100% invested in first-lien debt.


This information was previously made available to subscribers of Premium BDC Reports, along with:

  • PFLT target prices and buying points
  • PFLT risk profile, potential credit issues, and overall rankings
  • PFLT dividend coverage projections and worst-case scenarios
  • Real-time changes to my personal portfolio

To be a successful BDC investor:

  • As companies report results, closely monitor dividend coverage potential and portfolio credit quality.
  • Identify BDCs that fit your risk profile.
  • Establish appropriate price targets based on relative risk and returns (mostly from regular and potential special dividends).
  • Diversify your BDC portfolio with at least five companies. There are around 50 publicly traded BDCs; please be selective.


Monroe Capital (MRCC) Dividend Coverage & Risk Profile Update

The following is from the MRCC Update that was previously provided to subscribers of Premium BDC Reports along with revised target prices, dividend coverage and risk profile rankings, potential credit issues, earnings/dividend projections, quality of management, fee agreements, and my personal positions for all business development companies (“BDCs”).


Monroe Capital (MRCC) hit its base-case projections due to continued fee waivers to cover the current dividend. As shown below, dividend coverage would have been around 91% without fee waivers. As mentioned in previous reports, my primary concern is the relatively low dividend coverage with materially increased leverage as the debt-to-equity is now approaching the highest in the sector at 1.75. It should be noted that the increased leverage is partly due to continued declines in NAV per share including another 1.4% in Q3 2019.

Theodore L. Koenig, CEO: “As we have grown the portfolio over the last year to utilize the additional leverage capacity available under the Small Business Credit Availability Act, we have taken a shareholder friendly action to amend and reduce our management fee calculation, effective as of the beginning of the third quarter. This amendment has the effect of reducing our annual base management fee rate on assets in excess of regulatory leverage of 1:1 debt to equity to 1.00% from 1.75% per annum. As with the prior calculation, there is no management fee paid on cash and restricted cash assets. The combination of our reduced management fee structure and our continued incentive fee waiver demonstrates our commitment to maintaining dividend coverage with net investment income and creating value for our shareholders. All of this reflects our confidence in the long-term strength of our business.”


During Q3 2019, its net asset value (“NAV”) decreased by $0.18 or 1.4% (from $12.52 to $12.34) mostly due to additional markdowns in previously discussed ‘watch list’ investments including Luxury Optical Holdings Co. and The Worth Collection that were added to non-accrual status during Q3 2019. Also added to non-accrual were its loans to Curion Holdings as its promissory notes were already on non-accrual. The total fair value of investments on non-accrual increased from $14.0 million to $30.7 million and account for around 4.7% of the portfolio fair value and $1.50 per share or around 12.2% of NAV.

“While we are pleased with the growth in our portfolio, an increase of $26.6 million during the quarter, and the continued coverage of our dividend by net investment income, we are not happy with the slight decline of 1.4% in our per share NAV. Over the past several quarters, we have seen some idiosyncratic credit issues with a few borrowers. We do not believe these isolated issues are representative of our portfolio as a whole. We feel we are on the right track in resolving some of these credit issues and we hope to be able to see the results of our efforts in the coming quarters.”

Other non-accruals include Incipio, LLC third lien tranches and Rockdale Blackhawk, LLC (“Rockdale”). However, the Curion promissory notes and the Incipio third lien tranches were obtained in restructurings during 2018 for no cost. The fair value of its investment in Rockdale remained stable but previously filed for bankruptcy as part of a restructuring process. MRCC’s total investment in Rockdale accounts for almost $18 million (around 2.7% of the portfolio) and $0.88 (or 7.1%) of NAV per share.


Education Corporation of America (“ECA”) was added to non-accrual status during Q4 2018 and are ‘junior secured loans’ and preferred stock as compared to first-lien positions. American Community Homes, Inc. remains discounted and will be discussed in the updated MRCC Deep Dive report.

Another issue that will be discussed in the updated report and needs to be watched is the amount of payment-in-kind (“PIK”) that continues to increase from 5.3% of total income in Q3 2018 to 9.4% during Q3 2019:

MRCC’s portfolio remains primarily of first-lien loans, representing around 90% of the portfolio and its investment in the SLF (discussed next) remains around 6% of the portfolio.

Grade 4: Includes an issuer performing materially below expectations and indicates that the issuer’s risk has increased materially since origination. In addition to the issuer being generally out of compliance with debt covenants, scheduled loan payments may be past due (but generally not more than six months past due). For grade 4 investments, we intend to increase monitoring of the issuer.

Grade 3: Includes investments performing below expectations and indicates that the investment’s risk has increased somewhat since origination. The issuer may be out of compliance with debt covenants; however, scheduled loan payments are generally not past due.

In June 2018, shareholders approved the company becoming subject to a minimum asset coverage ratio of 150% allowing for higher use of leverage. The company had $38.4 million available for additional borrowings on its revolving credit facility. Previously, MRCC had higher dividend coverage due to the ‘total return requirement’ driving no incentive fees paid. The following was from the previous earnings call:

It has everything to do with where the NAV of the portfolio is in any given quarter and the performance on NII and dividends paid to shareholders. So it just depends on what happens each quarter going forward. And it’s a formulaic, as you said it’s formulaic. And so it’s difficult for me to predict today with any certainty where incentive fees would be on. And as you probably know it’s not a binary trigger either. They could be on it partially, or they could be on fully. It just depends on where we are with regards to NAV. It’s possible, there could be some incentive fee earned in the first quarter, if NAV was flat. I wouldn’t expect we’d be in a position to earn an entire incentive fee. And I would think that everything else was equal than probably in the second quarter is when you could start seeing an incentive fee payable.”


This information was previously made available to subscribers of Premium BDC Reports, along with:

  • MRCC target prices and buying points
  • MRCC risk profile, potential credit issues, and overall rankings
  • MRCC dividend coverage projections and worst-case scenarios
  • Real-time changes to my personal portfolio

To be a successful BDC investor:

  • As companies report results, closely monitor dividend coverage potential and portfolio credit quality.
  • Identify BDCs that fit your risk profile.
  • Establish appropriate price targets based on relative risk and returns (mostly from regular and potential special dividends).
  • Diversify your BDC portfolio with at least five companies. There are around 50 publicly traded BDCs; please be selective.


Hercules Capital (HTGC) Dividend Coverage & Risk Profile Update

The following is from the HTGC Update that was previously provided to subscribers of Premium BDC Reports along with revised target prices, dividend coverage and risk profile rankings, potential credit issues, earnings/dividend projections, quality of management, fee agreements, and my personal positions for all business development companies (“BDCs”).


HTGC Update Summary:

  • HTGC hit its best-case projections for Q3 2019 covering its dividend by 116% mostly due to higher onetime income and lower-than-expected ‘Employee Compensation’.
  • HTGC announced a Q3 2019 supplemental dividend of $0.03 per share and guided for “larger supplemental distribution once we finalize year-end numbers early next year.”
  • As predicted, NAV per share decreased by 2.0% or $0.21 (from $10.59 to $10.38) mostly due to unrealized losses from publicly traded equity positions (discussed later) and not related to credit quality
  • LYFT declined by 38% during Q3 2019 which resulted in around $5 million of unrealized losses during the quarter. However, LYFT recently raised full-year revenue guidance and posted better-than-expected earnings for its third quarter.
  • During Q3 2019, HTGC sold 115,316 shares of DocuSign, Inc. (DOCU).
  • Non-accruals decreased slightly due to exiting Metalysis Limited and Micell Technologies, Inc. during the quarter.
  • However, Motif BioSciences Inc. was previously considered a ‘watch list’ investment and added to non-accrual status during Q3 as well as marked down another $3.2 million.

HTGQ Q3 2019 Update

Hercules Capital (HTGC) hit its best-case projections for Q3 2019 covering its dividend by 116% mostly due to higher fee income and lower-than-expected ‘Employee Compensation’. Distributable net operating income (“DNOI”) was $0.39 per share (previous quarter was $0.40). As discussed in the previous report, HTGC’s ‘Core Yield’ has started to decline from previous levels but is not a concern.

“Our effective and core yields in the third quarter were 13.4% and 12.4% respectively, compared to 14.3% and 12.7% in the second quarter. The primary driver for the decrease in the effective yield was due to the lower early payoffs, the core yield reduced due to the two fed rate cuts in the quarter with the July cut being the main driver.”


As predicted, NAV per share decreased by 2.0% or $0.21 (from $10.59 to $10.38) mostly due to unrealized losses from publicly traded equity positions (discussed later) and not related to credit quality as discussed on the recent call:

“During the quarter our NAV decreased by $0.21 per share to $10.38 per share, largely related to unrealized depreciation attributable to market volatility impacting the fair value of our investment portfolio. I think the important thing to note that of the $25.5 million of unrealized depreciation, the vast majority of that was in the sort of the public book from the mark-to-market perspective. Only $2.5 million of it was attributable to the unrealized piece from the credit perspective, which is a pretty immaterial amount on a quarterly basis and we really haven’t seen any further degradation subsequent to the 930 marks that would lead us to believe that there’s further erosion with respect to valuations in our portfolio subsequent to quarter end.

As of September 30, 2019, 84.8% of its debt investments were in a senior secured first-lien position. Non-accruals decreased slightly due to exiting Metalysis Limited and Micell Technologies, Inc. during the quarter. However, Motif BioSciences Inc. was previously considered a ‘watch list’ investment and added to non-accrual status during Q3 2019 as well as marked down another $3.2 million:


—————–

As discussed in the previous HTGC Deep Dive report, there have recently been declines in the public stock prices for some of its equity positions including Lyft, Inc. (LYFT), TransMedics Group, Inc. (TMDX) and BridgeBio Pharma, Inc. (BBIO). As shown in the following chart, the stock price for LYFT declined by 38% during Q3 2019 which resulted in around $5 million of unrealized losses during the quarter. However, LYFT recently raised full-year revenue guidance and posted better-than-expected earnings for its third quarter. HTGC’s management has discussed selling/monetizing its equity holdings:

“When we made those equity investments, we talked about the fact that when they approached a certain target price ranges that we would look to monetize and exit the positions. Most of those private investments came with lockup provisions, which have either just expired or are in the process of expiring over the next several quarters. And if the stocks appreciate to levels that are within our target price ranges, in the ordinary course, will look to monetize and capture some of the gains that we currently have from an unrealized perspective, if you turn them into realized gains again assuming that the stocks remain where they currently are.”


During Q3 2019, HTGC sold 115,316 shares of DocuSign, Inc. (DOCU) which had a 25% increase in stock price during Q3 2019 and was likely sold as discussed on a previous call:

Previous call: “We’re actually a big believer in DocuSign, as a product which led us to make the equity investment in the company. But, we’re not looking to just kind of sell it right away, I think it’s a great company I think it has a lot more legs for growth associated with it. But we are also now the hedge funds. So we’re not – we don’t get paid by holding on to long positions as an internally managed BDC. So once we’ve the threshold, we will liquidate the position.”

“Credit quality on the debt investment portfolio improved slightly in Q3, with a weighted average internal credit rating of 2.17 as compared to 2.18 in Q2. Our rated one-credits as a percentage of our overall investment portfolio went down slightly to 11.4% in Q3 from 12.4% in Q2, largely driven by payoffs of several rated one-credits that we were anticipating. Our rated two-credits as a percentage of our overall investment portfolio increased to 64% in Q3, from 63.9% in Q2 and our rated four and rated five credits decreased to 1.5% in Q3 from 3.6% in Q2, making up less than 2% of our investment portfolio at fair value.”


As discussed in previous reports, there will likely be “potential dividend increases or supplemental dividend distributions” and on October 29, 2019, the Board declared a second quarter supplemental cash distribution of $0.03 per share.

“With our total investment portfolio at $2.3 billion at cost and our debt investment portfolio at $2.1 billion at cost, our NII per share in Q3 generated 116% coverage above our quarterly based distribution of $0.32 per share. In addition to our quarterly based distribution of $0.32 for Q3, we also declared a supplemental distribution of $0.03 per share. In the aggregate, this brings our total distributions to shareholders for Q1, Q2 and Q3 to $1.02, representing a 7% increase from the same period a year ago.”

“We are also fortunate to have been able to grow our undistributed spill-over to an estimated $62 million or $0.59 per share, subject to final tax filings in 2019. Subject to market conditions and sustained financial performance, we hope to be in position to potentially declare a larger supplemental distribution once we finalize year-end numbers early next year.”


After closing $241 million in new debt and equity commitments in Q3 2019, HTGC has pending commitments of $36 million in signed non-binding term sheets outstanding as of October 29, 2019. Since the close of Q3 2019 and as of July 29, 2019, HTGC has funded almost $118 million of existing commitments.

“Since the close of Q3 and as of October 29, Hercules has already closed an additional $191 million of new commitments and we have pending commitment of an additional $36 million in singed, non-binding term sheet. Year-to-date through October 29, our closed new debt and equity commitments are at $1.4 billion.”

HTGC Liquidity and Capital Resources:

HTGC ended Q3 2019 with $284 million in available liquidity, including $21 million in unrestricted cash and cash equivalents, and $263 million in available credit facilities. On July 16, 2019, HTGC issued $105 million of senior unsecured notes to qualified institutional investors in a private placement with a fixed interest rate of 4.77% and are due on July 16, 2024, and will reduce borrowing costs as in the previous report.

“At the end of the quarter, our GAAP and regulatory leverage was 111.5% and 97.8% respectively, which increased compared to the second quarter due to the private placement in July and continued growth. We continue to manage the business to ensure that we remain below our 2019 communicated leverage sealing of 125%.”


On June 17, 2019, the Company completed a public offering of common stock, including the over-allotment option, totaling 5,750,000 of common stock for net proceeds, before expenses, of $70.5 million, including the underwriting discount and commissions of $2.2 million. During Q3 2019, the company did not issue any additional shares under its equity ATM program. As of October 28, 2019, around 10.7 million shares remain available for issuance and sale. Shareholders previously approved the reduced asset coverage ratio allowing higher leverage effective December 7, 2018. The company intends to have target leverage (debt-to-equity) ratio range of 0.95 to 1.25 and will likely use the ATM program to maintain leverage while growing the portfolio.

HTGC Equity & Warrant Portfolio

Hercules held equity positions in 53 portfolio companies with a fair value of $148.4 million and a cost basis of $201.0 million as of September 30, 2019. On a fair value basis, 29.0% or $43.4 million is related to existing public equity positions.

Hercules held warrant positions in 118 portfolio companies with a fair value of $18.9 million and a cost basis of $34.1 million as of September 30, 2019. On a fair value basis, 26.0% or $5.0 million is related to existing public warrant positions.


This information was previously made available to subscribers of Premium BDC Reports, along with:

  • HTGC target prices and buying points
  • HTGC risk profile, potential credit issues, and overall rankings
  • HTGC dividend coverage projections and worst-case scenarios
  • Real-time changes to my personal portfolio

To be a successful BDC investor:

  • As companies report results, closely monitor dividend coverage potential and portfolio credit quality.
  • Identify BDCs that fit your risk profile.
  • Establish appropriate price targets based on relative risk and returns (mostly from regular and potential special dividends).
  • Diversify your BDC portfolio with at least five companies. There are around 50 publicly traded BDCs; please be selective.


FS KKR Capital (FSK) Dividend Coverage & Risk Profile Update

The following is from the FSK Update that was previously provided to subscribers of Premium BDC Reports along with revised target prices, dividend coverage and risk profile rankings, potential credit issues, earnings/dividend projections, quality of management, fee agreements, and my personal positions for all business development companies (“BDCs”).


FS KKR Capital Corp. (FSK)  reported just above its base case projections but only due to materially lower incentive fees paid driven by the ‘total return’ hurdle and continued unrealized losses (discussed later). As shown in the following table, FSK would have earned $0.19 per share if the full incentive fees were paid.

FSK continues to increase its use of leverage mostly due to share repurchases but also impacted by the previous NAV declines. During Q3 2019, the company repurchased another 8 million shares at an average price of $5.95 (24% discount to NAV).

Michael Forman, Chairman and CEO. “We delivered solid financial results in the third quarter. Our strong origination activity resulted in further diversification of our investment portfolio. We also meaningfully expanded our joint venture, and we continued taking steps to strengthen our capital structure. As we move forward, I’m excited by the leadership team we have assembled and believe we are well-positioned.”


In December 2018, FSK’s board of directors authorized a $200 million stock repurchase program. During the nine months ended September 30, 2019, the company repurchased 19,216,367 shares at an average price per share (inclusive of commissions paid) of $6.11 (totaling $118 million). So far in Q4 2019, the company has already repurchased another 3,189,687 shares at an average price per share (inclusive of commissions paid) of $5.78 (totaling $18 million). Additional repurchases could be limited due to approaching its revised targeted leverage but funded through rotating out of portfolio assets.

—————– 

Previously, FSK was downgraded to a ‘Tier 3’ from an overall ranking and pricing standpoint (but remained a ‘Level 2’ dividend coverage implying a stable dividend) due to continued credit issues. FSK’s Board has declared a regular cash distribution for Q4 2019 of $0.19 per share, paid January 2, 2020 to stockholders of record as of the close of business on December 18, 2019. During Q3 2019, NAV per share decreased by $0.02 or 0.3% (from $7.88 to $7.86) due to $0.08 per share of net realized/unrealized losses mostly offset over-earning the dividend and share repurchases:

—————–


Total non-accruals increased from 1.2% to 1.7% of the portfolio based on fair value due to adding Bellatrix Exploration Ltd, AVF Parent LLC, and Acosta Holdco and will be discussed in the updated FSK Deep Dive report. Also, still on non-accrual are the previously discussed energy and retail-related investments including Hilding Anders, Rockport (Relay), Advanced Lighting Technologies Inc., Petroplex Acidizing Inc, AltEn, LLC, and HM Dunn Co. There has been a $171 million increase in the amount of investments in ‘Investment Rating 3’ implying “Underperforming investment some loss of interest or dividend possible, but still expecting a positive return on investment” and needs to be watched.


As mentioned in previous reports, there is the possibility for improved dividend coverage through its Strategic Credit Opportunities Partners (“SCJV”).


Also, management has been working to reduce the amount of non-income producing equity investments that is now 7.9% of the portfolio (partially due to markdowns in equity investments). However, the amount of first-lien declined from 70% to 51% mostly due to combining the portfolios of FSIC and CCT:


This information was previously made available to subscribers of Premium BDC Reports, along with:

  • FSK target prices and buying points
  • FSK risk profile, potential credit issues, and overall rankings
  • FSK dividend coverage projections and worst-case scenarios
  • Real-time changes to my personal portfolio

To be a successful BDC investor:

  • As companies report results, closely monitor dividend coverage potential and portfolio credit quality.
  • Identify BDCs that fit your risk profile.
  • Establish appropriate price targets based on relative risk and returns (mostly from regular and potential special dividends).
  • Diversify your BDC portfolio with at least five companies. There are around 50 publicly traded BDCs; please be selective.


TCG BDC Inc. (CGBD) Risk Profile Update

The following information is from the CGBD Deep Dive that was previously provided to subscribers of Premium BDC Reports along with revised target prices, dividend coverage and risk profile rankings, potential credit issues, earnings/dividend projections, quality of management, fee agreements, and my personal positions for all business development companies (“BDCs”).


CGBD Risk Profile Update

CGBD’s portfolio remains mostly invested in true first-lien assets accounting for 70% of total investments (not including Credit Fund) highly diversified by borrower and sector, access to an experienced credit quality platform and historically low non-accruals.

“We consider our BDCs portfolio to be extremely well positioned fundamentally against this macroeconomic backdrop. We have roughly 70% of our portfolio in true first lien instruments. A high degree of investment diversification and significant under weights to more cyclical industry exposures, all of which we believe will be long-term benefits to our shareholders. We’re acutely aware that we’re investing in what could be late cycle and therefore we remain ultra-selective. Carlyle’s credit investment platform has over 100 investment professionals that have the expertise to evaluate opportunities across the capital stack, company sizes, sectors and market cycles all with the lens and relative value and fundamental credit investing.”


It is important to note that CGBD management conservatively values its portfolio each quarter:

From previous call: “When we held our initial earnings call as a public company back in August of 2017, I highlighted that based on our robust valuation policy, each quarter you may see changes in our valuations based on both underlying borrower performance as well as changes in market yields and that movement evaluations may not necessarily indicate any level of credit quality deterioration.”

As mentioned in the previous report, “my primary concern is 10.6% of the portfolio considered Internal Risk Rating 4”. During Q3 2019, NAV per share declined by 2.8% or $0.48 per share due to net realized/unrealized losses of $0.59 per share mostly from completely writing off its non-accrual investment in Dimensional Dental Management ($0.34 per share of unrealized losses) and additional markdowns of ‘watch list investments including Derm Growth Partners ($0.16 per share of unrealized losses).  I am expecting a meaningful NAV decline due to Derm Growth Partners that will likely be added to non-accrual status in Q1 2020 (or earlier) and management discussed on the call:

Q. “Okay, thank you. Could you also talk about, I think, Derm Growth Partners III, that’s something another one that you’re carrying, bit of a discount to costs. I’m not sure if there’s something incremental that happened this quarter or if you could just give an update on the company. Thank you.”

A. “Yeah, the update I’d give on that credit is we’re working through some operational and financial performance challenges with the sponsor and the company, but unlike some of the other positions such as dimensional which was the other large mark down this quarter. This is a first lien tranche, so we expect in the situation a very different outcome than we had on dimensional which obviously being junior debt, in a underperforming situation, the recovery prospects on that one is much difference, that’s an important distinction I would draw between the two borrowers.”

Derm Growth Partners accounts for around 4% of CGBD’s NAV per share and I am expecting the company to default in 2020:

Dimensional Dental is one of the remaining investments from its “legacy last out program” which are first lien/last out loans with a secondary priority behind the first lien/first out loan with respect to principal, interest and other payments.

“Regarding valuations in NAV, our total aggregate realized and unrealized net loss was about $36 million for the quarter. One borrower Dimensional Dental contributed over half of this loss and over two-thirds of our NAV decline. As we marked our position down to almost zero. This company’s financial prospects of deteriorated materially over the last quarter. Given we hold a junior debt tranche we expect minimal recovery on our investment. This is one of the remaining credits from a legacy last out program, which is not made any new investments since 2017. And I know we’re making a conscious effort to reduce exposure in that program over the next few quarters. Regarding exits, we noted on last quarter’s call that we sold our investment in Totes. The realized loss of $11 million for the quarter primarily represents of reversal of prior period unrealized losses on this position.”

Product Quest Manufacturing was responsible for previous NAV declines and is also part of legacy last out program which I am expecting to be completely written off resulting in realized losses of $33 million or $0.56 per share but has already been mostly written off and will not materially impact upcoming NAV per share. Dimensional Dental and Product Quest were discussed on the recent call with management mentioning “going forward we’ve got residual exposure that came from that program, but we’ve got a really good line of sight to fully exiting”:

Q. “It looks like a couple of your more severe experiences have come from the Madison Capital joint venture, the last out program. Is there any thread there in hindsight, whether it’d be industry or structure? And is there a change on how you look at this avenue going forward?”

A. “Yes, something that we’ve talked a lot about as a team here. So when we started out, we had the program with Madison Capital that essentially was a first out last out program where Carlyle took the last out. We’ve stopped investing through that program back in 2017. We’re still working through some of the legacy issues that came through that program and you saw mainly in dimensional dental this quarter. I think one thing, I’m not sure I would blame it on necessarily an industry, where there is a little bit of that, but it’s more so the structure. A last-out position when as company gets into trouble and has to restructure its balance sheet. The recoveries there are tend to be relatively poor. And so that’s the main driver for us wanting to not continue to invest in that program, and I think more importantly going forward we’ve got residual exposure that came from that program, but we’ve got a really good line of sight to fully exiting, whether it’s through just getting repayments or sales or just general portfolio management.”


SolAero Technologies Corp. has been discussed in previous reports and was restructured during Q2 2019. As discussed in the previous report, there was around $11 million or $0.18 per share of realized losses during the quarter mostly due to exiting Indra Holdings Corp. (Totes Isotoner) that was previously on non-accrual status. However, non-accruals declined from 2.0% to 1.2% of the portfolio fair value.

From previous call: “We exited one of these positions [Totes] post quarter end at a level a bit lower than our 6/30 mark, driven by our developing view on the potential downside to our recovery in that investment. For the other non-accrual transactions these continue to be fluid and developing situations. Given the status of ongoing negotiations between the various parties we’re limited in providing additional color, but we hope to have updates over the next couple of quarters.”

TwentyEighty Investors was an investment that was previously restructured but mostly repaid in Q3 2019 and management expects to recover “over 100% of our original loan investment”:

“On a positive front, in September we receive repayment in full on our debt investment in TwentyEighty Investors, and in the last week we received equity proceeds from the sale of the remaining business lines. This was a loan we restructured back in early 2017 and with the right combination of capital, corporate governance and patients we expect to recover over 100% of our original loan investment.”

Some of the other investments that have been discussed in previous reports and/or that I am watching closely include Derm Growth Partners, PPT Management Holdings, Superior Health Linens, SPay, Inc., Legacy.com, Hydrofarm, Hummel Station, and GRO Sub Holdco. Most of these investments were marked down during Q3 2019 with the exceptions of Spay and GRO:


These losses were partially offset by over-earning the dividend by $0.08 per share and accretive share repurchases adding around $0.04 per share. The company repurchased another 1,168,383 shares during Q3 2019 at $14.69 per share (14% discount to previous NAV) resulting in accretion to net assets per share of $0.04. On November 4, 2019, the Board authorized a 12-month extension of its $100 million stock repurchase program at prices below reported NAV per share. The stock is still trading at 20% discount to its September 30, 2019 NAV and there will likely be additional accretive repurchases.


Over the last two quarters, payment-in-kind (“PIK”) income has increased from 2.1% to 4.3% partially due to ‘watch list’ investments including Superior Health Linens and Legacy.com, Inc. and needs to be watched:

“In both those scenarios, we had covenant issues and in the negotiations with the sponsor in inking an amendment, we were able to increase price and, in both cases, we increased the price in the form of PIK.”


As mentioned in the previous report, my primary concern is the amount of the portfolio considered ‘Internal Risk Rating 4’ defined as “Borrower is operating more than 20% below the Base Case and there is a high risk of covenant default, or it may have already occurred. Payments are current although subject to greater uncertainty, and there is moderate to high risk of payment default.” However, management discussed these investments on the previous call as “these are temporary performance issues” and “our goal remains full recovery”. Management mentioned that the recent credit issues are “idiosyncratic credit issues, not indications of either thematic risk concentrations in our portfolio or broad economic weakness”:

“Let me shift to a slightly deeper discussion on our portfolio and change in NAV this quarter. Our BDC’s portfolios highly diversified and heavily weighted with first lien positions, which represent about 70% of our portfolio as of the third quarter. We have over 140 investments in the portfolio diversified by size and sector. No single sector accounts for more than 12% of the portfolio. This portfolio construction represents our defensive approach to sustainable dividend creation, which is our investment objective. However, portfolio construction alone does not immunize the portfolio from idiosyncratic risk, but we expect to outperform the industry over the long-term. Our results this quarter were negatively impacted by a couple of investments that drove the vast majority of the 2.8% quarter-over-quarter decline in NAV per share this quarter.”

“We have aggressively moved to manage our remaining risk leveraging the broader Carlyle Global Credit workout team and other platform capabilities. As I mentioned last quarter, our team is focused on stabilizing NAV through prudent underwriting standards and active portfolio management. We are confident we can deliver strong long-term credit performance and drive shareholder value. So any individual quarter may exhibit some level of volatility. The core tenants of our investment philosophy are unchanged. We continue to invest in the best relative value opportunities maintain a strong bias toward senior debt and defensive industry exposures and directly originated from sponsors with whom we have meaningful relationships.”

“Regarding the overall portfolio, the weighted average internal risk rating remained 2.3 and the total watch list was flat quarter-over-quarter with no new additions. From a credit perspective, the key metrics for new originations remain largely in line with our broader portfolio in prior quarters. The loan to value was under 50%, the average leverage multiple was roughly 5.5 times. Average EBITDA was $90 million, significantly higher than our average portfolio EBITDA reflecting progress both deploying our scale capital more effectively as well as inroads made displacing syndicated market.”

From previous call: “We have dug into each situation and ascertained they represent idiosyncratic credit issues, not indications of either thematic risk concentrations in our portfolio or broad economic weakness. As you would expect, these loans are a significant focus for our team and we have committed the necessary resources to maximize shareholder value. For the most part, for the names that are on our watch list or on non-accrual, they’re idiosyncratic situations. But one thing we can point to is that within the healthcare services space, where we’re seeing companies do more aggressive types of roll-up transactions that those come with more challenges.”


This information was previously made available to subscribers of Premium BDC Reports, along with:

  • CGBD target prices and buying points
  • CGBD risk profile, potential credit issues, and overall rankings
  • CGBD dividend coverage projections and worst-case scenarios
  • Real-time changes to my personal portfolio

To be a successful BDC investor:

  • As companies report results, closely monitor dividend coverage potential and portfolio credit quality.
  • Identify BDCs that fit your risk profile.
  • Establish appropriate price targets based on relative risk and returns (mostly from regular and potential special dividends).
  • Diversify your BDC portfolio with at least five companies. There are around 50 publicly traded BDCs; please be selective.


Goldman Sachs BDC (GSBD) Dividend Coverage & Risk Profile Update

The following is from the GSBD Update that was previously provided to subscribers of Premium BDC Reports along with revised target prices, dividend coverage and risk profile rankings, potential credit issues, earnings/dividend projections, quality of management, fee agreements, and my personal positions for all business development companies (“BDCs”).


GSBD Update Summary:

  • GSBD beat its base-case projections covering its dividend by 107%even after taking into account lower-than-expected portfolio yield and a decline in the size of the portfolio.
  • On September 3, 2019, Vast Broadband announced that it had completed its acquisition of NTS Communication, Inc. and repaid its loan in Q3 2019 resulting in a realized loss of $7.2 million. However, this a positive development as the company will be reinvesting proceeds into performing assets.
  • NAV declined by $0.23 per share or 1.3% mostly due to markdowns of ‘watch list’ investments (discussed next) slightly offset by overearning the dividend.
  • One of its ‘watch list’ investments (MPI Products LLC) was added to non-accrual status “due to its capital condition” and marked down another $3.7 million resulting in NAV decline of $0.09 per share.
  • Also, the largest ‘watch list’ investment Zep Inc. was marked down another $2.4 million “due to financial underperformance” impacting NAV by $0.06 per share.
  • These investments will be discussed along with a revised ‘watch list’ in the updated GSBD Deep Dive report.

—————–

Goldman Sachs BDC (GSBD) beat its base-case projections covering its dividend by 107% even after taking into account lower-than-expected portfolio yield as well as a decline in the size of the overall portfolio. As discussed in the previous report, on September 3, 2019, Vast Broadband announced that it had completed its acquisition of NTS Communication, Inc. and repaid its loan in Q3 2019 resulting in a realized loss of $7.2 million. However, this a positive development as the company will be reinvesting proceeds into performing assets.


Net asset value (“NAV”) declined by $0.23 per share or 1.3% (from $17.21 to $16.98) mostly due to markdowns of ‘watch list’ investments (discussed next) slightly offset by overearning the dividend by $0.02 per share:


During Q3 2019, one of its ‘watch list’ investments (MPI Products LLC) was added to non-accrual status “due to its capital condition” and marked down another $3.7 million resulting in NAV decline of $0.09 per share. Also, the largest ‘watch list’ investment Zep Inc. was marked down another $2.4 million “due to financial underperformance” impacting NAV by $0.06 per share. These investments will be discussed along with a revised ‘watch list’ in the updated GSBD Deep Dive report.

“Net change in unrealized appreciation (depreciation) in our investments for the three and nine months ended September 30, 2019 was primarily driven by the reversal of unrealized depreciation in connection with the aforementioned exchange with ASC Acquisition Holdings, LLC., and the full exit from our investments in NTS Communications, Inc. The net change was offset by the unrealized depreciation in Zep, Inc., which was due to financial underperformance, and the placement of MPI Products LLC on non-accrual status due to its capital condition.”

Total non-accruals declined from 3.5% to 1.0% of the portfolio fair value due to the previously discussed repayment of NTS Communication and one of the investments assumed from the SCF portfolio Professional Physical Therapy added back to accrual status in Q3 2019. However, as MPI Products LLC was added to non-accrual as discussed earlier and other recently marked down investments need to be ‘watched’.


New investments during Q3 2019 were 99% first-lien and the portfolio remains heavily invested in first-lien debt as shown below. Over the past five quarters, GSBD’s proportion of its first-lien debt investments within its portfolio has increased from 53% to 75% and second-lien debt investments decreased from 36% to 18%:


As discussed previously, the company dissolved its Senior Credit Fund (“SCF”) during Q2 2019 and received $215 million of assets financed directly on its balance sheet. This improved the credit quality of the overall portfolio including diversification and increased first-lien. In June 2018, shareholders approved the reduced asset coverage ratio of at least 150% (potentially allowing a debt-to-equity of 2.00) and management reduced the base management fee from 1.50% to 1.00%, lowering expenses and improving dividend coverage as shown in the previous table. Management does not have a target for leverage (debt-to-equity) but has mentioned that leverage will increase gradually along with the amount of first-lien (as a %):

“We have not set forth a specific target leverage range for the company as the reduced asset coverage requirement provides the company with overall greater balance sheet flexibility. However, we will seek to maintain a meaningful cushion relative to the regulatory asset coverage requirements, as we have done historically. We would expect our leverage ratio to continue to gradually increase if we continue to find attractive first lien senior loans.”


This information was previously made available to subscribers of Premium BDC Reports, along with:

  • GSBD target prices and buying points
  • GSBD risk profile, potential credit issues, and overall rankings
  • GSBD dividend coverage projections and worst-case scenarios
  • Real-time changes to my personal portfolio

To be a successful BDC investor:

  • Diversify your BDC portfolio with at least five companies. There are around 50 publicly traded BDCs; please be selective.

Golub Capital (GBDC) Dividend Coverage & Risk Profile Update

The following is from the GBDC Deep Dive that was previously provided to subscribers of Premium BDC Reports along with revised target prices, dividend coverage and risk profile rankings, potential credit issues, earnings/dividend projections, quality of management, fee agreements, and my personal positions for all business development companies (“BDCs”).


GBDC Fiscal Year 2019 Fourth Quarter Portfolio Update

On October 9, 2019, GBDC announced that it had originated $130.4 million in new middle-market investment commitments during the three months ended September 30, 2019. Approximately 87% of the new middle-market investment commitments were one stop loans, 10% were senior secured loans and approximately 3% were equity securities. Of the new middle-market investment commitments, $120.7 million funded at close.

On September 16, 2019, GBDC completed its acquisition of Golub Capital Investment Corporation (“GCIC”), with GBDC as the surviving company. Including $2.3 billion of investments acquired from GCIC and factoring in debt repayments, sales of securities, net fundings on revolvers and net change in unrealized gains (losses) at GBDC, total investments at fair value are estimated to be $4.3 billion as of September 30, 2019.

“Upon closing of the merger, GCIC stockholders received 0.865 shares of GBDC common stock for each share of GCIC common stock. The transaction is estimated to be 4.5% accretive to GBDC’s net asset value (“NAV”) per share as of June 30, 2019. The final NAV accretion resulting from the merger will be disclosed when GBDC reports its results for the fiscal year ending September 30, 2019. The GBDC Board of Directors has previously disclosed an intention to increase GBDC’s regular quarterly distributions to $0.33 per share after the closing of the merger, provided that GBDC’s Board of Directors reserves the right to revisit this intention in its sole discretion.”


GBDC Dividend Coverage Update

GBDC has completed its acquisition of Golub Capital Investment Corporation (“GCIC”) and the Board intends to increase the regular quarterly dividend to $0.33 per share. GBDC’s generous hurdle rate of 8% basically ensures dividend coverage especially after taking into account the expected 4.5% increase in its NAV per share.

“Based on GBDC’s NAV per share as of June 30, 2019 and GCIC’s estimated NAV per share of $15.00 as of the June 30, 2019, the accretion to GBDC’s NAV would be approximately $0.72 per share, or about 4.5%. So that equates to roughly two quarters of historical net income per share for GBDC.”

—————–

The company paid a special dividend of $0.12/share in 2018 and there is a good chance of continued special dividends as the company continues to grow undistributed income and gains on a GAAP basis. Higher quality BDCs typically support regular dividends with recurring net investment income (“NII”) and pay special/supplemental dividends with additional income and/or capital gains (usually from equity investments), similar to Main Street Capital (MAIN).

“The special distribution is due to taxable income exceeding distributions over the past year. This is the third consecutive calendar year we will have paid a special distribution.”

Many BDCs retain undistributed income and some incur excise taxes rather than pay out to shareholders as they see it as “cheap capital” to reinvest and grow the portfolio. GBDC has chosen to a pay special dividend to avoid excise tax and will raise capital through accretive equity offerings as needed. See discussion from the most recent earnings call below.

Q. “On the special dividend, obviously it’s been a plan for the last several years to pay out the full amount or roughly the full amount of taxable income. I mean, is that going to continue to be your policy, basically avoiding excise tax, going forward, and if you have any thoughts of that, in the context of the GCIC acquisition?”

A. “That will continue to be our policy. That’s our intention. We don’t understand why it isn’t everyone’s policy. You have your choices of BDC manager to pay an excise tax or not pay an excise tax, and you can avoid paying the excise tax by making sure that you have paid out distributions equal to or almost equal to your taxable income. This is not a hard calculus. So, it’s good for shareholders to avoid paying the excise tax. I anticipate we will continue with that same policy.”

On February 5, 2019, shareholders approved the reduced asset coverage requirements allowing higher leverage but management continues to target a regulatory debt-to-equity ratio of 1.00:

GBDC is currently above its targeted leverage and through its third license from the Small Business Administration (“SBA”) the company has access to a maximum of $350 million of SBA debentures. However, leverage will likely decline due to the upcoming merger (discussed later) as shown in the updated projections and discussed by management:

“We said it was GBDC’s current intention to continue to target a GAAP debt-to-equity ratio of about 1.0 times. Although quarter-end GAAP leverage was a bit over our target, our strategy and near-term expectations for leverage haven’t changed. It remains our intention to target GBDC’s leverage at about 1.0 times. We currently anticipate that the proposed GCIC merger will be deleveraging for GBDC. So with GBDC running a bit above target now, we think the combined company will end up with leverage more in line with our target post-closing.”

GBDC’s liquidity and capital resources are primarily from its debt securitizations (also known as collateralized loan obligations, or CLOs), SBA debentures, and revolving credit facilities. On February 1, 2019, GBDC closed on a new $200 million credit facility with Morgan Stanley priced at LIBOR +2.05% and was used to repay its revolving credit facility with Wells Fargo. On September 6, 2019, GBDC amended the facility increasing the borrowing capacity to $300 million. As of June 30, 2019, the company had $41 million of available SBA debenture commitments, none of which was available to be drawn.

For the quarter ended June 30, 2019, GBDC hit its base case projections covering its dividend by 100%. There was a meaningful decline in its portfolio yield and leverage remains higher as shareholders previously approved the reduced asset coverage requirements allowing higher leverage.

“Excluding an approximately $28,000 accrual for the capital gain incentive fee, net investment income for the quarter ended June 30th remained unchanged at $19.4 million, or $0.32 per share, as compared to $19.4 million, or $0.32 per share, for the prior quarter. Consistent with previous quarters, we have provided net investment income per share excluding the capital gains incentive fee accrual as we think this adjusted NII is a more meaningful measure.”

GBDC has predictably boring quarterly NII of $0.32 mostly due to its fee structure combined with strong portfolio credit quality. My financial projections use a wide range of assumptions but because of the incentive fee hurdle, the dividend is consistently covered by design.

—————–

There was a decline in its overall portfolio yield from 8.8% to 8.6% due to new investments at lower yields of 8.1% as compared to 8.8% for the investments paid off.

“As shown on the bottom table, the weighted average rate of 8.1% on new investments this quarter was down from 8.7% in the previous quarter, primarily due to a declining LIBOR rate and a modest increase in the percentage of lower yielding senior secured originations. The income yield decreased by 20 basis points to 8.6% for the quarter ended June 30, primarily due to a decrease in LIBOR over the past two quarters. The investment income yield, or the dark blue line, which includes amortization of fees and discounts, remained stable at 9.2% during the quarter due to an increase in prepayments fees and other fee income.”

GBDC Risk Profile Update

GBDC is a ‘safer’ lower yield BDC for many reasons including strong covenant protections, over 90% of the portfolio in senior secured and One Stop ‘bank quality’ loans and one of the lowest stated portfolio yields in the industry (typically indicating higher credit quality). GBDC’s continued focus on ‘quality over quantity’ has resulted in lower portfolio growth and/or a reduced portfolio yield but dividend coverage has remained stable due to the investor-friendly incentive fee structure.

“Our late cycle investing strategy is a simple one. You have heard me talk about it before and we have stuck with it, staying at the top of the capital structure, partnering with strong sponsors and resilient companies, remaining highly selective on underwriting, leaning in on our competitive advantages, and when necessary, giving up some yield for higher credit quality and portfolio stability.”

New investment commitments totaled $157 million with approximately 14% were senior secured loans, 84% were one stop loans, and 2% were in the SLF and junior debt.

—————–

Joerns Healthcare ($1.8 million FV, $3.2 million cost) was added to non-accrual during the quarter. The other three investments that were on non-accrual included Aris Teleradiology ($0.8 million FV, $3.2 million cost), Uinta Brewing Company ($0.8 million FV, $0.9 million cost) and Tresys Technology Holdings ($3.8 million FV, $4.5 million cost). However, one of these investments was repaid in full subsequent to quarter-end which was likely Tresys as discussed next and was marked up by $2.0 million as shown in the following table.

“Flipping to the next two slides, the number of non-accrual investments increased from three to four investments, one of which was fully repaid with 100% recovery on our remaining principal balance subsequent to quarter end. As of June 30, 2019, non-accrual investments as a percentage of total investments at cost and fair value were 0.7% and 0.4%, respectively.”

It is important to remember that GBDC has 225 portfolio companies, so three to four on non-accrual is to be expected. As shown in the previous table, GBDCs ‘watch list’ investments only account for 3.4% of the portfolio fair value which is considered low. Safer BDCs typically have around 3% to 5% of the portfolio that needs to be ‘watched’ including ORCC, TSLX, CSWC, MAIN, SUNS, and PFLT.

—————–

Tresys Technology Holdings was reportedly purchased by DC Capital Partners and then merged with Owl Cyber Defense. Owl’s CTO mentioned that the two companies are “very complementary” because Owl is practiced in hardware security while Tresys specializes in software security.

Joerns Healthcare recently filed for bankruptcy and received approval for its restructuring plan that would eliminate $320 million of debt, with existing loans converted into equity and an additional $40 million of new financing to support Joerns’ ongoing operations and continued investments. Joerns will move forward under new ownership composed of its prepetition secured lenders, who have designated as initial board members including Patrick Hayes (Golub Capital). Including the SLF exposure, GBDC had around $8.2 million marked at 62% of cost.

“The successful execution of our restructuring plan significantly enhances our company’s long-term viability and competitive position,” said Joerns Senior Vice President and Chief Financial Officer John Regan. “By reducing our debt load, we can increase our investments in several key growth opportunities and enhance our efforts to continue delivering an exceptional customer experience. This plan confirmation is an important step in our 130-year history to continue our drive every day to fulfill our commitment to be an exceptional company which improves the lives of others.”

Payment-in-kind (“PIK”) interest income remains low with only $1.8 million over the last three quarters accounting for around 1.5% of total income. However, GBDC does not accrue PIK interest if the portfolio company valuation indicates that the PIK interest is not likely to be collectible. One of the investments that I am watching closely is Oliver Street Dermatology that has been marked down over the previous quarters and was partially (1.0%) converted to PIK:

Q. “I saw the — a change to the mark and addition of a PIK component to Oliver Street Dermatology. So wanted to ask what’s going on there?”

A. “I’m going defer discussing a specific situation like Oliver Street. I don’t think it is an appropriate topic for this call.”

PPT Management Holdings has been discussed in previous reports and is also a portfolio investment for CGBD which has marked this investment at 85% of cost (see CGBD report).

GBDC’s net asset value (“NAV”) per share remained stable at $15.95 but has increased 23 out of the last 28 quarters, after excluding the impact from previous special dividends

This information was previously made available to subscribers of Premium BDC Reports, along with:

  • GBDC target prices and buying points
  • GBDC risk profile, potential credit issues, and overall rankings
  • GBDC dividend coverage projections and worst-case scenarios
  • Real-time changes to my personal portfolio

To be a successful BDC investor:

  • As companies report results, closely monitor dividend coverage potential and portfolio credit quality.
  • Identify BDCs that fit your risk profile.
  • Establish appropriate price targets based on relative risk and returns (mostly from regular and potential special dividends).
  • Diversify your BDC portfolio with at least five companies. There are around 50 publicly traded BDCs; please be selective.

PennantPark Investment (PNNT) Dividend Coverage & Risk Profile Update

The following is from the PNNT Deep Dive that was previously provided to subscribers of Premium BDC Reports along with revised target prices, dividend coverage and risk profile rankings, potential credit issues, earnings/dividend projections, quality of management, fee agreements, and my personal positions for all business development companies (“BDCs”).


PNNT Dividend Coverage Update:

PNNT continues to cover its dividend for a few reasons including the previously reduced management fees, the ability to use higher leverage with SBA borrowings, and rotating the portfolio into income-producing assets from upcoming monetizations (selling and reinvesting) of its equity investments:

“With asset yields coming down over the last several years, we’re looking to create attractive risk-adjusted returns and our portfolio. We’re executing a three point plan to do so. Number one, we’re focused on lower risk primarily secured investments, thereby reducing the volatility of our earnings stream. Number two, we’re also focused on reducing risk from the standpoint of diversification, as our portfolio rotates, we intend to have a more diversified portfolio with generally modest by sizes relative to our overall capital. Number three, we look forward to continuing to monetize the equity portion of our portfolio. Over time we’re targeting equity being 5% to 10% of our portfolio.”

The company had approximately $0.30 per share of taxable spillover income/gains and the current dividend is sustainable after taking into account higher leverage offsetting lower portfolio yield with the adjusted fee structure as shown in the Leverage Analysis. Also, management discussed the possibility of increased earnings through a senior loan joint venture:

“We are also actively assessing other options for increased earnings, including another SBIC and the senior loan joint venture, similar to the successful JV with PFLT.”

As shown below, equity investments are now around 14% of the portfolio and the company will likely continue to use higher leverage as it increases the amount of first-lien positions that now account for 59% of the portfolio (up from 40% five quarters ago).

—————–

For calendar Q2 2019, PNNT reported just below its base case projections lower portfolio yield partially offset by higher ‘other income’. ‘Provision for taxes’ of $0.3 million is not included when calculating ‘Core NII’ resulting in net investment income (“NII”) per share of $0.178 and 99% coverage of the dividend.

There was a meaningful decline in the overall portfolio yield from 10.6% to 10.1% as expected partly due to the previously discussed exit of its largest investment Parq Holdings in May 2019 that was yielding 14.6%. On February 5, 2019, shareholders approved the adoption of the modified asset coverage requirements allowing higher leverage and the advisor agreed to reduce the base management fee from 1.50% to 1.00% on gross assets that exceed 200%.

Art Penn, Chairman and CEO: “We are pleased that we are making substantial progress toward enhancing our portfolio by moving into more senior secured positions, which we believe will result in even more steady and stable coverage of our dividend over time. Additionally, our earnings stream will continue to improve based on a gradual increase in our debt-to-equity ratio, while maintaining a prudent debt profile.”

—————–

PNNT will be offsetting the impact from lower yields through the rotation out of non-income producing assets as well as increasing leverage. Previously, PNNT was keeping a conservative leverage policy of GAAP debt-to-equity (includes SBA debentures) near 0.80 until it can rotate the portfolio into safer assets.” However, the company has already increased the amount of first-lien debt from 40% to 59% of the portfolio over the last five quarters and is slowly increasing its regulatory debt-to-equity (excludes SBA debentures) to 1.50:

“Along with a lower risk portfolio, we intend to prudently target higher leverage. Over time, we are targeting a regulatory debt-to-equity ratio of 1.1 to 1.5x. We will not reach this target overnight. We will continue to carefully invest, and it may take us several quarters to reach this new target.”

The company has significant borrowing capacity due to its SBA leverage at 10-year fixed rates (current average of 3.1%) that are excluded from typical BDC leverage ratios. PNNT has applied for its third SBIC license that would provide an additional $175 million of SBA financing.

On September 25, 2019, PNNT priced its public offering of $75 million of 5.50% unsecured notes due October 15, 2024, trading under the symbol “PNNTG” and are included in the BDC Google Sheets and currently considered a ‘Hold’.

—————–

On September 4, 2019, PNNT amended its SunTrust Credit Facility increasing the amount of commitments from $445 million to $475 million and amended the covenants “to enable us to utilize the flexibility and incremental leverage provided by the SBCAA.

—————–

As expected, there have been no additional share repurchases due to only around $0.5 million of availability. Previously, PNNT purchased 1 million shares during the three months ended March 31, 2019, at a weighted average price of around $7.10 per share or a 22% discount to its previously reported NAV per share.

“We purchased $7 million of a common stock this quarter as part of our stock repurchase program, which was authorized by our board. We’ve completed our program and have purchased $29.5 million of stock. The stock buyback program is accretive to both NAV and income per share. The accretive effect of our share buyback was $0.03 per share.”

—————–

PNNT Risk Profile Discussion:

  • Please see the end of this report for previous management discussion of historical credit performance including during the previous recession.

As mentioned earlier, management is in the process of “de-risking” the portfolio which is currently invested 59% in senior first-lien secured debt, 23% in second-lien secured debt, 4% in subordinated debt and 14% in preferred and common equity. Management has its “three-point plan” that includes rotating the portfolio into higher credit quality first and second-lien lower-yielding debt that will likely result in continued lower portfolio yields:

“We are focused on lower risk, primarily secured investments, thereby reducing the volatility on our earnings stream. Investments secured by either a first or second lien are about 82% of the portfolio. We are also focused on reducing risk from the standpoint of diversification. So number two, as our portfolio rotates, we intend to have a more diversified portfolio with generally modest bite sizes, relative to our overall capital. And number three, we look forward to continuing to monetize the equity portion of our portfolio. Over time, we’re targeting equity being between 5% to 10% of our overall portfolio. Our portfolio is constructed to withstand market and economic volatility. In general, our overall portfolio is performing well. We have a cash interest coverage ratio of 2.5 times and a debt to EBITDA ratio of 4.7 times at cost on our cash flow loans.”

—————–

During calendar Q2 2019, PNNT’s net asset value (“NAV”) per share declined by $0.09 or 1.0% (from $8.83 to $8.74) due to multiple markups and markdowns during the quarter. Some of the largest markdowns were previously discussed companies including Hollander Sleep Products, ETX Energy and AKW Holdings Limited. Similar to PennantPark Floating Rate Capital (PFLT), its investment in Hollander Sleep Products, was previously added to non-accrual status and marked down by another $7.9 million during the recent quarter impacting NAV per share by almost $0.12.

PT Networks was also marked down and needs to be watched. Some of the largest markups included its investments MidOcean JF Holdings and RAM Energy (similar to the previous quarter). On June 14, 2019, Superior Digital Displays, LLC filed for Chapter 7 bankruptcy protection and is no longer reflected on the Schedule of Investments.


During calendar Q2 2019, Hollander filed for bankruptcy “citing a severe cash squeeze due in part to substantial price increases for materials”. A Chapter 11 reorganization plan negotiated with lenders would convert about $166.5 million of Hollander’s $233 million debt burden to equity but the company said it “will also be running a marketing process to determine whether there are alternative transactions to ensure that the company maximizes value.”

CEO Marc Pfefferle said “Upon emergence [from bankruptcy], we will have a stronger balance sheet and the financial flexibility needed to compete in today’s dynamic business environment now and over the long-term.”

In June 2019, Hollander announced that it could be closing its plant in Thompson, Georgia. In addition, Hollander has been spending money to integrate Pacific Coast Feather Co., which it acquired in 2017. Hollander accounted for around 0.9% of PNNT’s portfolio as of Ju ne 30, 2019, but was not contributing to earnings as it had been put on non-accrual. The worst-case scenario is a complete writedown and would impact NAV per share by around $0.17 or 2.0%. Management discussed Hollander on the recent call:

Q. “On the Hollander, could you give us — I don’t — obviously, you’ve got historically a good track record of recoveries when you do have a nonaccrual, but you have that many and you have a track record of being very patient in order to get that recovery. So Hollander, obviously, it’s now filed Chapter 11. You’ve got a dip in there. There’s a debt-to-equity conversion proposal, I think, in the restructuring. I mean can you give us any outlook on what’s going on? Whether the objections within the creditors or if that’s likely to — how exactly that’s likely to evolve?”

A. “I can only give you what’s public information but I think kind of give you directionally what’s going on. So it’s going through the bankruptcy process now. They’re talking horse bids that are being cultivated outside of the creditors. We will see where those stalking horse bids come. We’ll see what the creditors to. We are not the largest lender here. There is another Wellman lender who is larger than us who was in this, who was going to be a driver of the — a big driver of the ultimate outcome. So that’s an independent entity from us. So we have — we can’t really control them. We can control our capital. So unclear. In the coming weeks I think this process will roll through, there’ll be clarity on it, where we are hugely disappointed in, obviously, the performance of this company. We think that given time, this company can have a lot of value, but we are not as much in control as we’d like to be in this particular situation. So we’ll see, we’ll see where it’s going to play out in the bankruptcy court in the coming weeks and that’s all I can really tell you right now,

Its investment in U.S. Well Services (USWS) is a common equity position which is a publicly-traded company that has not done so well since the end of Q2 2019 as shown below. I am expecting unrealized losses over the coming quarters.

—————–

Energy, oil & gas exposure increased to 12.8% of the portfolio fair value (previously 12.3%) due to the previously discussed unrealized appreciation and an additional $10 million debt investment in RAM Energy.

As discussed in previous reports, RAM Energy and ETX Energy have previously sold non-core assets to generate liquidity/stability. Its investment in RAM Energy was previously restructured to reduce the amount of PIK income and ETX Energy was restructured resulting in realized losses but potential equity upside potential.


This information was previously made available to subscribers of Premium BDC Reports, along with:

  • PNNT target prices and buying points
  • PNNT risk profile, potential credit issues, and overall rankings
  • PNNT dividend coverage projections and worst-case scenarios
  • Real-time changes to my personal portfolio

To be a successful BDC investor:

  • As companies report results, closely monitor dividend coverage potential and portfolio credit quality.
  • Identify BDCs that fit your risk profile.
  • Establish appropriate price targets based on relative risk and returns (mostly from regular and potential special dividends).
  • Diversify your BDC portfolio with at least five companies. There are around 50 publicly traded BDCs; please be selective.