TCPC Quick Update: Likely Upgrade Next Month

The following information was previously provided to subscribers of Premium BDC Reports along with:

  • TCPC target prices/buying points
  • TCPC risk profile, potential credit issues, and overall rankings
  • TCPC dividend coverage projections (base, best, worst-case scenarios)


TCPC Dividend Coverage Update

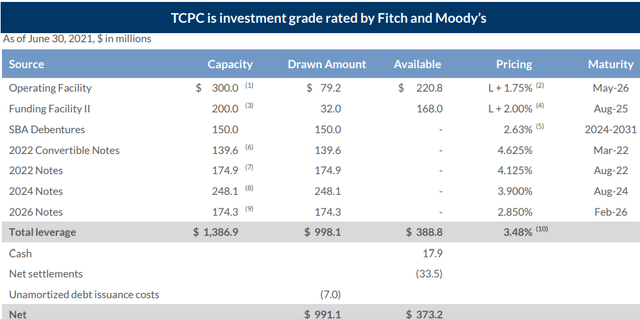
Similar to most BDCs, management continues to improve or at least maintain its net interest margin through reducing its borrowing rates including its SVCP Credit Facility reduced to L+1.75% announced on June 24, 2021, and an additional $150 million of 2.850% notes due 2026 issued on August 27, 2021, used to redeem $175 million of 4.125% notes due 2022. Both Fitch and Moody’s reaffirmed the Company’s investment-grade rating with a stable outlook.


As of June 30, 2021, available liquidity was approximately $373 million, including $388 million in available capacity under its leverage program, $18 million in cash and cash equivalents, and $34 million in net outstanding settlements of investments purchased.


During Q2 2021, leverage decreased during the previous quarter and remains below its targeted debt-to-equity ratio currently at 1.03 excluding SBA debentures giving the company some cushion for upcoming portfolio growth and improved earnings.

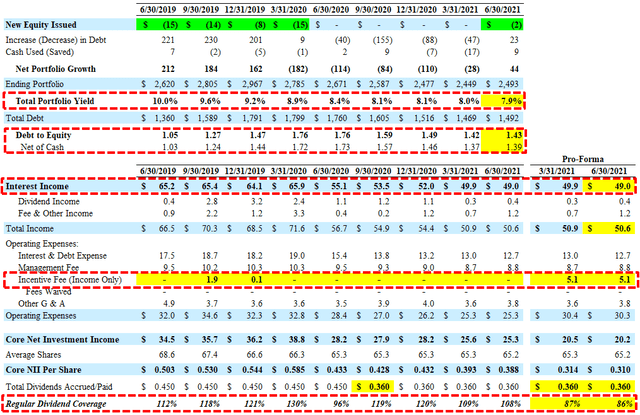
I am expecting dividend coverage to improve over the coming quarters through continued lower borrowing rates (discussed earlier), rotation out of equity positions into income-producing debt positions (discussed next), and reduced incentive fees. As mentioned in previous reports, management was not paid an incentive fee for Q1 2020 and deferred the cost evenly over the following six quarters which added around $643,000 of additional expense each quarter. The good news is that Q3 2021 is the last quarter for these deferred expenses which is taken into account with the previous projections:

“Incentive fees related to our income from the first quarter of 2020 were deferred when our performance temporarily fell below the total return hurdle. We voluntarily deferred the amount over 6 quarters through September of this year, subject to our cumulative performance remaining above the hurdle. We believe this deferral further aligns our interest with our shareholders and demonstrates our confidence in the strength of our portfolio and its earnings capacity over time.”


I am expecting continued dividend income including from Edmentum, Inc. (not as much as Q1 2021) which was discussed by management on the recent call:

“Dividend income in the Second Quarter included $1.1 million or $0.02 per share of recurring dividend income on our equity investment in Edmentum.”

Subsequent to June 30, 2021, TCPC sold around one-third of its equity position in Edmentum which is a good thing for shareholders as management can reinvest the proceeds into other assets with higher income. As shown in the following table, TCPC’s investment is currently valued at over $103 million and accounts for 5.7% of the portfolio. Management did not mention which shares they sold but using an average would imply proceeds of around $34 million and realized gain of around $15.5 million or $0.27 per share. It should be noted that TCPC has historical net realized losses and will not need to pay out the gains to shareholders.


Management discussed Edmentum on the recent call:

Q. “Following up on the question regarding Edmentum, can you repeat your comments there? I believe you said you had a $1.1 million of recurring income in the second quarter from that investment. Should we expect future income from Edmentum? And then how does that look regarding post-sale of a portion of your position, as well as on top of that, when you sold down a 1/3 of your position, how did that amount come about? Why was it not a full exit or why did you guys not choose to hold all? Why did you guys just right size it down to just selling off 1/3?”

A. “It is a recurring dividend income. We’re invested both in a preferred equity tranche and then the common equity as well. And as you recall, last quarter we had somewhat elevated level of dividend income, but this was more normalized recurring. But as you mentioned, we did sell down a portion of that equity position. This comes as a result of a nice run-up in the valuation, and also realized exit in part at those elevated valuations. The benefit here is we can take those proceeds and obviously redeploy it into our more normative investment profile for interest income. We do believe, obviously, as part of a sell-down, that it was important to manage the position size. Being an equity owner of a business is not the normative strategy. Doing so as a way to really fully realize the work effort and the benefits of that work and the position was part of the sell-down philosophy. We are still excited about the business. It’s well-positioned. There’s been a lot of work to get it to where it is today. I do think there are ongoing positive winds in the sails, so to speak, for the business. You have new institutional investors who have come in, as well as part of this transaction. So we want to be a part of that success on an ongoing basis, but we want to balance it with what the core part of the strategy is, as well as managing a diverse and well-diversified book with the growth in net position. And that is a combination of things that led us to partially exit, take some chips off the table, but also be a part of the future success of the business.”

Management was asked about selling some of the other equity investments on the recent call:

Q. “Just looking at the overall asset mix of the portfolio, you’ve clearly benefited from the strong performance on the equity side, and I believe equity is now 11% of assets after the event on sales. Be great if you could get a little color around how you’re thinking about, the asset mix moving forward. Do you think that we should expect to see more monetization of the equities position?”

A. “We are focused on credit instruments. It is the primary strategy where we have equity. It’s a function of either some ability to have warrants or things that convert into that or it’s a function of something like inventing somewhere. The path to defending our capital is defined by converting to a different instrument, which is really the exception, not the rule. Fortunately, those — a number of those have worked out, in some cases very well. But I would say, in terms of normal course activity, you should expect this to be a debt — primarily a senior secured debt portfolio, occasionally, things need a little bit of different type of work or activity that may result in equity, but if that is really not the primary focus, that is a function of protecting the portfolio versus deploying it in an original investment.”

As shown below, equity investments have grown from $109 million to $218 million partially due to marking up Edmentum and accounted for around 11.9% of the portfolio as of June 30, 2021. There is a good chance that management will be monetizing some of these investments which will drive additional recurring interest income and is taken into account with the ‘best case’ financial projections shown earlier.


On a previous earnings call, management was asked about resetting the dividend higher (closer to the previous level) and mentioned the lumpy nature of fee, dividend and prepayment-related income, “investors take comfort from dividend stability” and “great pride and comfort from knowing that we’ve got good dividend coverage”. I agree but there is a chance that the amount of recurring/stable earnings could increase enough to support a higher dividend due to continued lower borrowing rates, reduced incentive fees, and rotation out of equity positions into income-producing debt positions. Again, these are taken into account with the ‘best case’ projections.

Q. “Knowing that you folks never like to do anything in a herky jerky way and having just trimmed your dividend from 36 to 30 last year for reasons that are understandable kind of in the middle of the lockdowns. And so I’m just kind of wondering, again, not for the next quarter, two or three. But just philosophically, what would you be looking forward to or is it a goal to get back to the prior distribution?”

A “So yes, we did this during the lockdown. But we were also reacting to the very significant change in LIBOR, and the math is set out. And so when we made that decision, it was really primarily looking at LIBOR as opposed to events in the portfolio. We’re very proud of having earned our dividend every quarter. We think investors take comfort from dividend stability, knowing that it’s well-earned and appropriately covered. And that’s really been our focus. I think the other thing is, as you look at our earnings, we benefited from prepayment fees. And as we discussed earlier on the call, those are lumpy. We take great pride and comfort from knowing that we’ve got good dividend coverage. But we also know that there’s a certain lumpiness to the extra earnings from additional fees, dividends and prepayments.”

Historically, the company has consistently over-earned its dividend with undistributed taxable income. Management will likely retain the spillover income and use for reinvestment and growing NAV per share and quarterly NII rather than special dividends. On August 2, 2021, the Board declared a third quarter dividend of $0.30 per share payable on September 30, 2021, to stockholders of record as of the close of business on September 16, 2021.


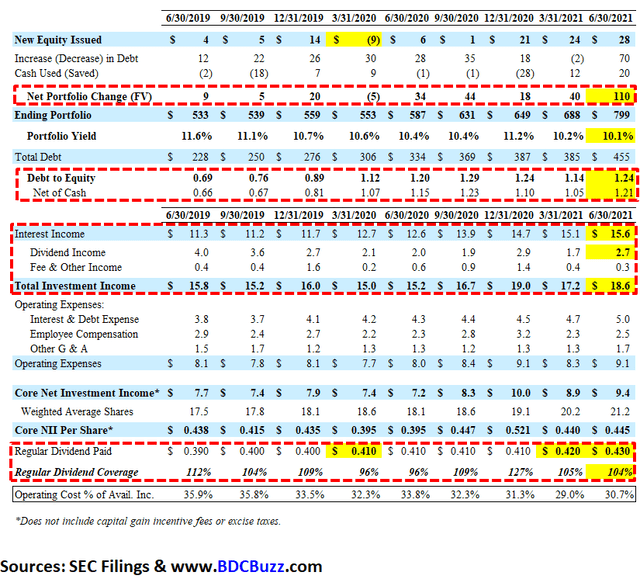
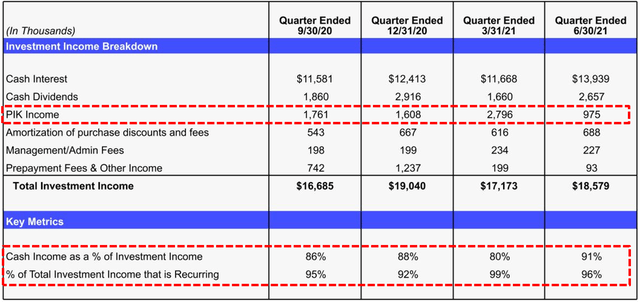
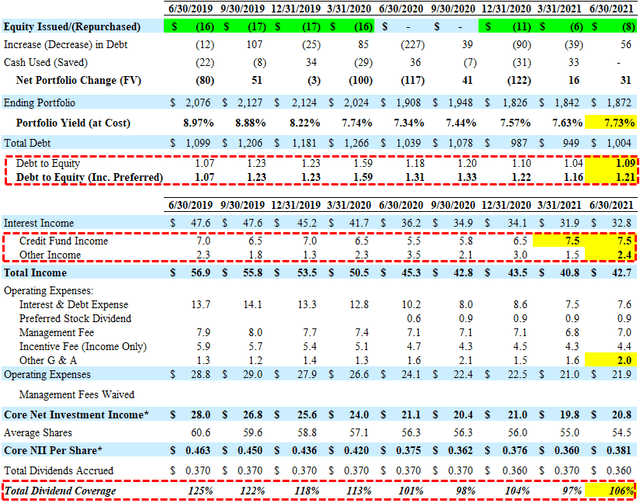
For Q2 2021, TCPC reported slightly below its base-case projections due to lower-than-expected dividend and other income as well as lower portfolio yield covering its dividend by 103%. The amount of payment-in-kind (“PIK”) income continues to decline from 7.6% in Q2 2020 to 2.4% in Q2 2021 the lowest level of PIK income in three years.

“Investment income for the Second Quarter was $0.72 per share. This included recurring cash interest of $0.61, recurring discount and fee amortization of $0.03, and PIK income of $0.02. Notably, PIK income is at a lowest level in more than 3 years. As a reminder, our income recognition follows our conservative policy of generally amortizing upfront economics over the life of an investment, rather than recognizing all of it at the time the investment is made.”

On July 29, 2021, the Board re-approved its stock repurchase plan to acquire up to $50 million of common stock “at prices at certain thresholds below our net asset value per share”. There were no additional shares repurchased during Q2 2021.


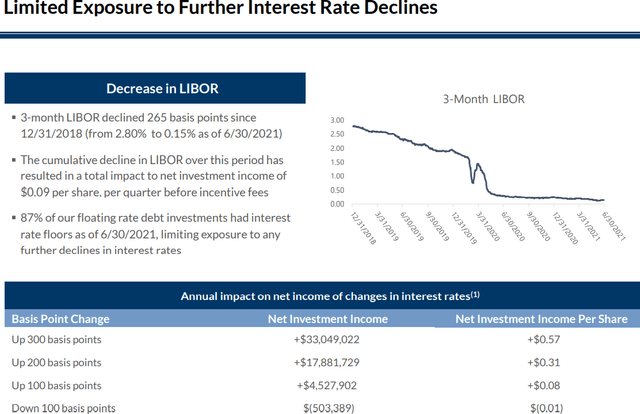
Previous reports correctly predicted the reduction of TCPC’s quarterly dividend from $0.36 to $0.30 which was at the top of my estimated range of $0.28 to $0.30. At the time, the company had spillover or undistributed taxable income (“UTI”) of around $0.78 per share. However, this is typically used for temporary dividend coverage issues. Please do not rely on UTI as an indicator of a ‘safe’ dividend. The previously projected lower dividend coverage was mostly due to lower LIBOR and portfolio yield combined with management keeping lower leverage to retain its investment-grade rating. Again, the previous declines in LIBOR were mostly responsible for the decline in portfolio yield with “limited exposure to any further declines”.

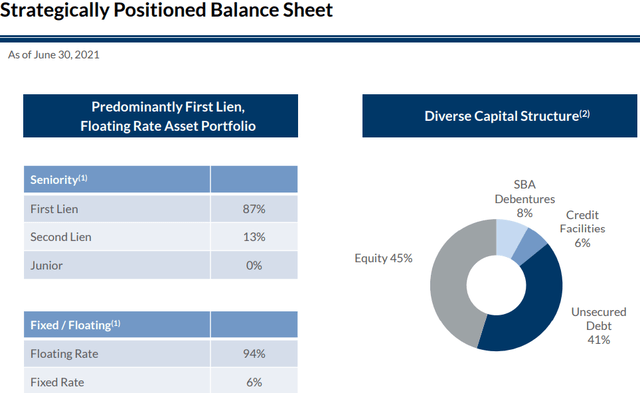
“Since 12/31/2018, LIBOR has declined 265 basis points or by 95%, which has put pressure on our overall portfolio yield. However, 87% of our floating rate loans are currently operating with LIBOR floors. And given that 94% of our loans are floating rate, we are well-positioned to benefit when rates eventually rise.”


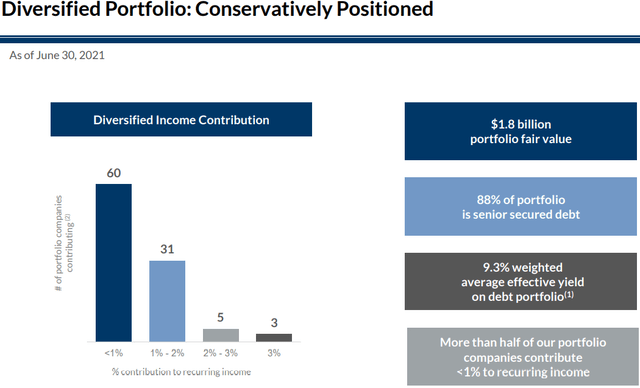
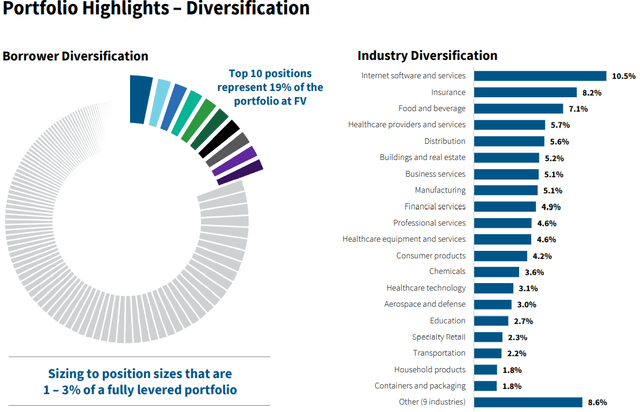
As shown below, TCPC’s portfolio is highly diversified by borrower and sector with only three portfolio companies that contribute 3% or more to dividend coverage:

“Our recurring income is spread broadly across our portfolio and is not reliant on income from any one company. In fact, over half of our portfolio companies each contribute less than 1% to our recurring income.”


TCPC Risk Profile Quick Update

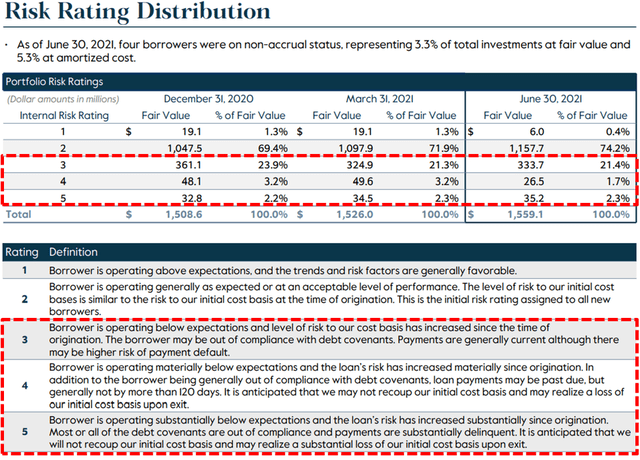
There were no additional loans added to non-accrual status that remain low representing 0.3% of the portfolio at fair value and 0.7% at cost. CIBT Solutions, Inc. remains on non-accrual status (was added during Q3 2020) and is a provider of expedited travel document processing services serving multinational corporations, global travel management companies, tour and cruise operators, government agencies, and Do-It-Yourself travelers. GlassPoint Solar, Inc. was exited during Q1 2021 and Avanti Communications remains on non-accrual. If these investments were completely written off the impact to NAV per share would be around $0.11 or 0.8%.


As discussed in the previous report, Edmentum is a provider of online learning programs that was acquired by Vistria Group resulting in a full recovery. Similar to NMFC, TCPC chose to re-invest a meaningful portion of the proceeds ($54.4 million) and “remain a significant shareholder of Edmentum, due to strong conviction in the continued growth”. As mentioned earlier, TCPC sold a third of its equity position in Edmentum and will record a realized gain in Q3 2021.

“Unrealized gains primarily reflected a $40.7 million gain on our investment in Edmentum, as a result of an additional equity investment committed to the company in the second quarter. Edmentum continues to benefit from the dramatic increase in demand for online education. Additional equity investment also resulted in the sale of approximately one-third of our investment in the Company post-quarter end. Unrealized gains in the second quarter also reflected overall spread tightening and continued market recovery, as well as improved investor sentiment following the significant market dislocation in the first half of last year, as a result of the pandemic.”

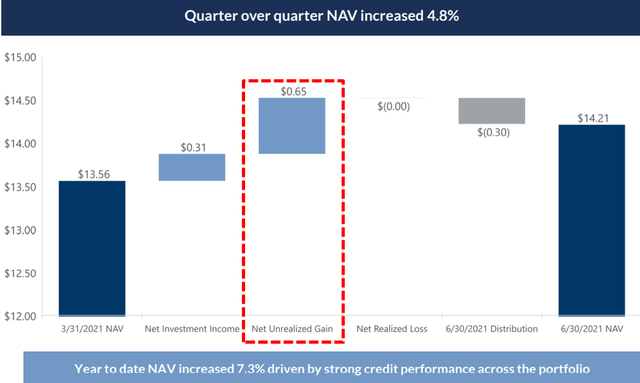
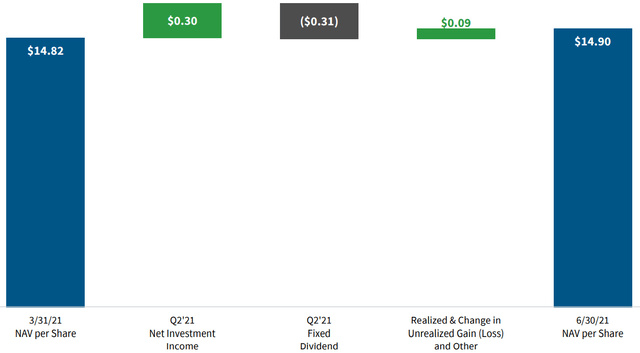
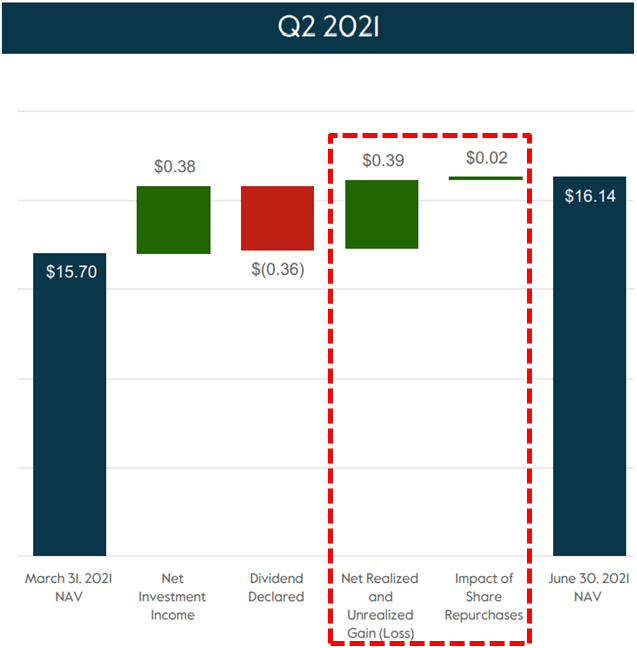
During Q2 2021, TCPC’s net asset value (“NAV”) per share increased by another $0.65 or 4.8% (from $13.56 to $14.21) primarily driven by additional gains on its investment in Edmentum (similar to previous quarters) partially offset by markdowns for Amteck and Fishbowl Inc.

“In the second quarter, our net asset value increased 4.8%, and the year-over-year, net asset value is up 16.4%. This is our fifth consecutive quarter of net asset value increases, and builds on the positive net asset value accretion we had during 2020, a result of which we are extremely proud. The increase in NAV in Q2 was primarily driven by a $41 million unrealized gain on our investment in Edmentum together with more modest increases in value across the portfolio.”

“Unrealized gains were partially offset by the reversal of $7.6 million of unrealized gains on Amtech, and $5.3 million in unrealized losses from Fishbowl. Fishbowl provides marketing software and services to restaurants, and these are only direct exposure to the restaurant industry. Given Fishbowl’s exposure to this industry, the Company has been slower to recover. Substantially, all of our investments are valued every quarter using prices provided by independent third-party sources. These include quotation services and independent valuation services, and our process is also subject to rigorous oversight, including back testing of every disposition against our valuations.”


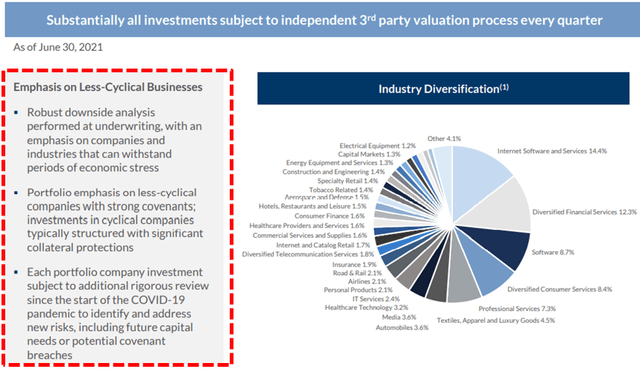
“Our portfolio is also weighted towards companies with established business models in less cyclical industries. The portfolio remains diverse at quarter-end and was made up of investments in 108 companies. As the chart on the left side of slide 6 shows of the presentation, our recurring income is spread broadly across our portfolio and is not reliant on income from any one company. In fact, over half of our portfolio companies each contribute less than 1% to our recurring income. 87% of our debt investments are first-lien, providing significant downside protection, and 94% of our debt investments are floating rate, positioning us well for when interest rates eventually rise.”


What Can I Expect Each Week With a Paid Subscription?

Each week we provide a balance between easy to digest general information to make timely trading decisions supported by the detail in the Deep Dive Projection reports (for each BDC) for subscribers that are building larger BDC portfolios.

  • Monday Morning Update – Before the markets open each Monday morning we provide quick updates for the sector including significant events for each BDC along with upcoming earnings, reporting, and ex-dividend dates. Also, we provide a list of the best-priced opportunities along with oversold/overbought conditions, and what to look for in the coming week.
  • Deep Dive Projection Reports – Detailed reports on at least two BDCs each week prioritized by focusing on ‘buying opportunities’ as well as potential issues such as changes in portfolio credit quality and/or dividend coverage (usually related). This should help subscribers put together a shopping list ready for the next general market pullback.
  • Friday Comparison or Baby Bond Reports – A series of updates comparing expense/return ratios, leverage, Baby Bonds, portfolio mix, with discussions of impacts to dividend coverage and risk.

This information was previously made available to subscribers of Premium BDC Reports. BDCs trade within a wide range of multiples driving higher and lower yields mostly related to portfolio credit quality and dividend coverage potential (not necessarily historical coverage). This means investors need to do their due diligence before buying.


GSBD Quick Update: Dividend Coverage to Improve

The following information was previously provided to subscribers of Premium BDC Reports along with:

  • GSBD target prices/buying points
  • GSBD risk profile, potential credit issues, and overall rankings
  • GSBD dividend coverage projections (base, best, worst-case scenarios)


GSBD Dividend Coverage Update

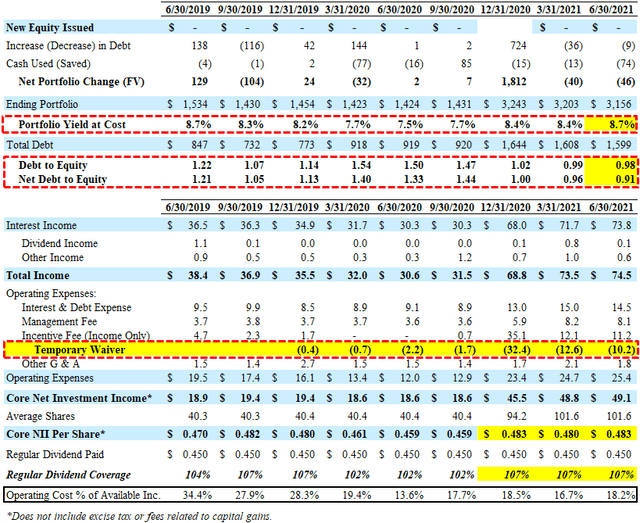
GSBD has covered its dividend by an average of 105% over the last 8 quarters growing spillover/undistributed income to around $0.46 per share for temporary dividend coverage shortfalls but the company will likely retain rather than use to pay special dividends.

From previous call: “The company had $46.6 million in taxable accumulated undistributed net investment income at quarter end, resulting from net investment income that has exceeded our dividend historically. Pro forma for the completion of the merger at the end of Q3, this equates to $0.46 per share.”

GSAM is waiving a portion of its incentive fee for the four quarters of 2021 (Q1 2021 through and including Q4 2021) in an amount sufficient to ensure that GSBD’s net investment income per weighted average share outstanding for such quarter is at least $0.48 per share per quarter. However, as shown in the previous financial projections, there is a good chance that the company will be able to cover the dividend without the need for fee waivers.

On August 5, 2021, the Board reaffirmed its regular dividend of $0.45 per share payable to shareholders of record as of September 30, 2021. Previously, the company paid a special dividend of $0.05 per share in May 2021 which is the second of its three quarterly installments of special dividends aggregating to $0.15 per share in connection with the merger.

For Q2 2021, GSBD reported slightly above its best-case projections due to much higher-than-expected portfolio yield driven by an increase in accelerated accretion related to repayments partially offset by lower portfolio growth (decline) and lower fee and dividend income. Leverage (debt-to-equity) again declined to a new near-term low of 0.91 (net of cash) giving the company adequate growth capital for increased earnings potential.

“For the third consecutive quarter, GSBD experienced a new high watermark for repayment activity, which amounted to $277 million of market value across 12 different portfolio companies this quarter. Fortunately, our powerful origination engine has largely kept pace during this active repayment environment. We expect to resume balance sheet growth in the back half of the year moving closer to more normalized net debt to equity ratios from this quarter and level of 0.91 times.”

However, management is not expecting the same level of repayments over the coming quarters:

“I do think that we will start to see a bit of a moderation at least in the short-term of some of that repayment activity relative to our pipeline of investment activity. And that should give rise to some portfolio growth.”


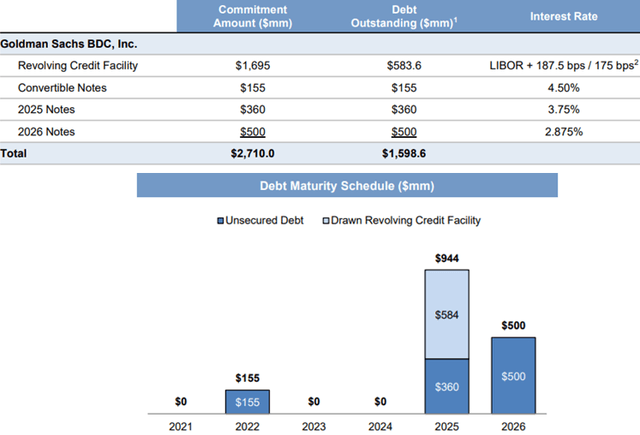
Similar to other BDCs, GSBD has been lowering its borrowing rates as well as constructing a flexible balance sheet including the public offering of $500 million of 2.875%unsecured notes due 2026. On August 13, 2021, amended its Truist Revolving Credit Facility to reduce the asset coverage required to reduce the stated interest rate from LIBOR plus 2.00% to LIBOR plus 1.875%. Previously, the company issued $360 million of unsecured notes due 2025 at 3.750%. As of June 30, 2021, 63% of its borrowings were unsecured with $1.1 billion of availability under its credit facility and $120 million in cash. Fitch’s reaffirmed GSBD’s investment grade rating of BBB- and revised the outlook to stable.

“At quarter end, 63% of the company’s outstanding borrowings were unsecured debt and $1.1 billion of capacity was available under GSBD’s secured revolving credit facility. Given the current debt position and available capacity, we continue to feel we have ample capacity to fund new investment opportunities with borrowings under our credit facility.”

On October 12, 2020, GSBD completed its merger with Goldman Sachs Middle Market Lending (“MMLC”) which doubled the size of the company including significant deleveraging. This created more capacity to deploy capital while adding a greater margin of safety to maintain GSBD’s investment-grade credit rating. Previously, shareholders approved the reduced asset coverage ratio of at least 150% (potentially allowing a debt-to-equity of 2.00) and management reduced the base management fee from 1.50% to 1.00%.


GSBD Risk Profile Quick Update

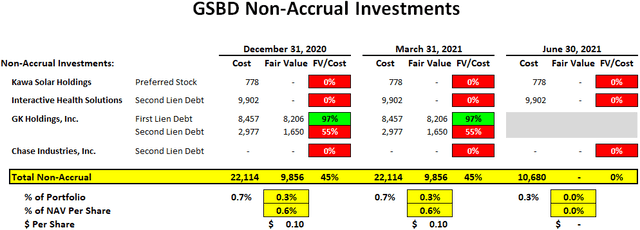
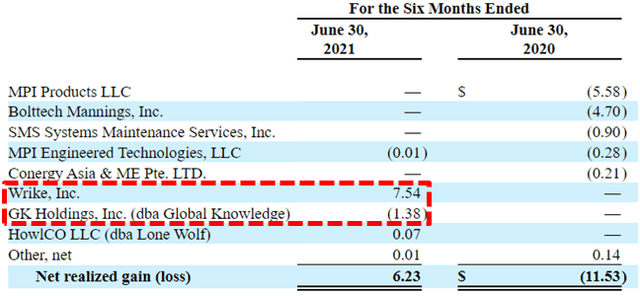
On June 11, 2021, its non-accrual investment in GK Holdings, Inc. (Global Knowledge) was partially repaid due to a SPAC-related merger with a competitor resulting in a small realized loss of $0.01 per share but reduced non-accruals. As of June 30, 2021, investments on non-accrual status accounted for 0.0% and 0.3% of the total investment portfolio at fair value and cost, respectively. It should be noted that GSBD has placed only one portfolio company on non-accrual status over the last six quarters.

“This decline in non-accrual is primarily a result of the repayment of our investment in GK Holdings. On June 11, GK Holdings consummated a merger with competitor in conjunction with incremental capital from a SPAC. As a result, GSBD received partial repayments on both first lien and second lien positions and received past due interest on the first lien position. GSBD rolled a portion of the existing loan into a new loan to the combined company, which is called Skillsoft in a deleveraged structure. Subsequent to quarter end, Skillsoft refinance its capital structure and repaid that remaining loan. So as a result of these transactions, we have fully exited our investment. And while we’re never placed an investment on non-accrual, we do think that this transaction is a demonstration of the care and effort that we put into our underperforming positions


During Q1 2021, there was around $7.5 million or $0.07 per share in realized gains related to the sale of its equity investment in Wrike, Inc in March 2021.


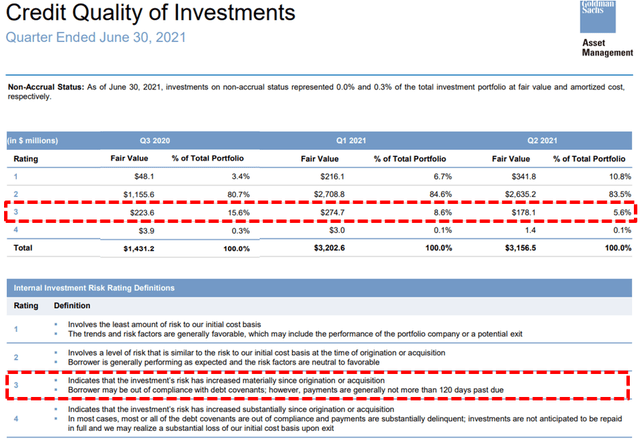
There has been continued improvement in the amount of investments considered ‘Rating 3’ to have “risk has increased materially” and/or “out of compliance with debt covenants” from 15.6% to 5.6% of the portfolio over the last three quarters.

Rating 3 investments indicate that the risk to our ability to recoup the initial cost basis of such investment has increased materially since origination or acquisition, including as a result of factors such as declining performance and non-compliance with debt covenants; however, payments are generally not more than 120 days past due;

“The underlying performance of our portfolio companies overall was stable quarter-over-quarter. The weighted average net debt to EBITDA of the companies in the portfolio was 5.9 times at quarter end, which is a slight improvement from 6 times at the end of the last quarter. The weighted average interest coverage of the companies in our investment portfolio was 2.6 times, again, a slight improvement from the 2.5 times at the end of the prior quarter. Consistent with our history, none of our investment activity this quarter was in so-called covenant-lite structures. Furthermore, in certain positions where we were the incumbent lender, we opted not to roll into new deals that did not meet our standards for risk reward characteristics sometimes based on rate and other times based on structure and document integrity.

“The focus of the platform continues to be that heart of the middle markets that business that does maybe up to $50 million of EBITDA focusing on sectors where could be bigger capital structures in parts of, for example, the technology and software space but the nature of the underwrite, the nature of the growth trajectory of those businesses requires a little bit of a more structured credit investment and we’ve been doing that for quite a long period of time. Even in those bigger cap opportunities, our history, our position of that market allows us to continue to be quite successful there.”

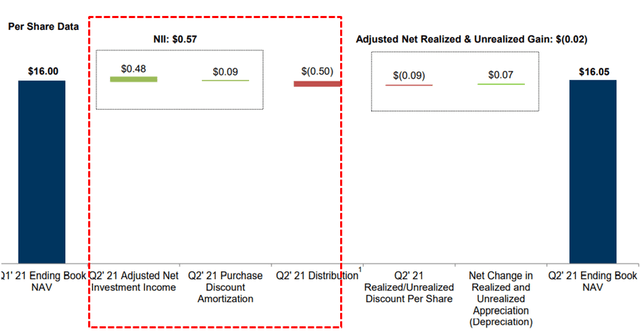
During Q2 2021, GSBD’s net asset value (“NAV”) per share increased slightly by 0.3% due to over-earning the dividends.

“Net asset value per share increased to $16.05 per share as of June 30, an improvement of approximately 30 basis points from the end of the first quarter. Against the accommodative overall market backdrop, the NAV increase resulted from ongoing stable to improving performance our portfolio companies offset slightly by the impact of $0.50 per share specialty event paid during the quarter.”


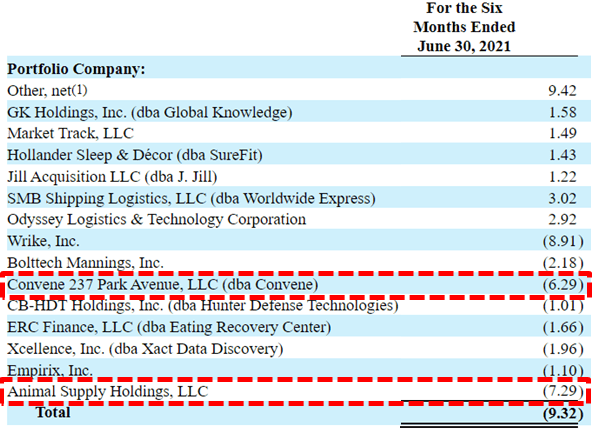
As discussed in the previous report, Animal Supply Holdings and Convene 237 Park Avenue have been recently marked down and need to be watched. During Q3 2020, its first-lien debt investment, preferred and common equity in Animal Supplywere exchanged for second lien debt, common equity and a right to purchase additional first-lien debt, second lien debt, and common equity, which resulted in a realized loss $0.89 per share. Convene focuses on shared meeting spaces directly impacted by the pandemic but has recently received additional capital from its equity shareholders and junior capital (below GSBD’s first-lien position).

“So Convene is focused on providing shared meeting space services and leading — it’s a first lien investment in top of the capital structure, very well structured, leading into the pandemic, really performing quite, quite well, broadly benefiting from a trend around people wanting to optimize their real estate footprints. One of the least efficient uses of your real estate is a big shared meeting space that gets used on a less frequent basis, so big secular tailwinds driving their business. But of course, in the lockdown environments, a lot of challenges within that business, really, a remarkable, I would say, management effort to get the business’s cost structure down significantly to reduce the rent payments quite significantly as well. In addition, we’ve had significant support from the equity shareholder base that has infused additional liquidity into the company. So we, like you, are looking forward to a bit more of a normalization of behavior more broadly. And I think in the current environment, appropriate to mark that investment down. But like I noted, we do take comfort in junior capital beneath us coming into the business and more broadly, the vaccine rollouts that are really starting to take hold here, resulting in a very different return to office, for example. And I think just more significant social interaction.”


What Can I Expect Each Week With a Paid Subscription?

Each week we provide a balance between easy to digest general information to make timely trading decisions supported by the detail in the Deep Dive Projection reports (for each BDC) for subscribers that are building larger BDC portfolios.

  • Monday Morning Update – Before the markets open each Monday morning we provide quick updates for the sector including significant events for each BDC along with upcoming earnings, reporting, and ex-dividend dates. Also, we provide a list of the best-priced opportunities along with oversold/overbought conditions, and what to look for in the coming week.
  • Deep Dive Projection Reports – Detailed reports on at least two BDCs each week prioritized by focusing on ‘buying opportunities’ as well as potential issues such as changes in portfolio credit quality and/or dividend coverage (usually related). This should help subscribers put together a shopping list ready for the next general market pullback.
  • Friday Comparison or Baby Bond Reports – A series of updates comparing expense/return ratios, leverage, Baby Bonds, portfolio mix, with discussions of impacts to dividend coverage and risk.

This information was previously made available to subscribers of Premium BDC Reports. BDCs trade within a wide range of multiples driving higher and lower yields mostly related to portfolio credit quality and dividend coverage potential (not necessarily historical coverage). This means investors need to do their due diligence before buying.


PNNT Quick Update: Waiting On A Dividend Increase

The following information was previously provided to subscribers of Premium BDC Reports along with:

  • PNNT target prices/buying points
  • PNNT risk profile, potential credit issues, and overall rankings
  • PNNT dividend coverage projections (base, best, worst-case scenarios)


PNNT Dividend, NAV Per Share & Management Fees Update

PNNT’s dividend coverage continues to improve partially due to its previous and upcoming increases in its net asset value (“NAV”) per share combined with its 7% hurdle, the eventual selling and reinvesting of many of its equity positions, and its PennantPark Senior Loan Fund (“PSLF”) joint-venture with Pantheon Ventures.

“With regard to growing net investment income, we have a three-pronged strategy, which includes; number one, growing assets on balance sheet at PNNT as we move towards our target leverage ratio of 1.25x, debt-to-equity from 0.8x; number two, growing our PSLF JV with Pantheon to about $550 million of assets from approximately $400 million of assets through balance sheet optimization, including a potential securitization; and three, the opportunity to rotate out of our equity investments over time into yield instruments. Equity investments held for the past 12 months have appreciated by approximately 45%, driven by many of the companies previously mentioned. Our long-term goal continues to target that percentage down to about 10% of the portfolio. As we monetize the equity portfolio, we are looking forward to investing the cash and to yielding debt instruments to increase net investment income.”

As predicted in the previous report, there was $41.7 million or $0.62 per share of realized gains during Q2 2021. Please keep in mind that the company is only paying $0.12 per share of quarterly dividends so this is a significant amount and was predicted in previous reports.

“We are making substantial progress on the exit of those equity investments. Additionally, we have been actively investing in new loans since the most recent quarter end and the outlook in our view for continued growth is excellent. During the quarter, we generated $51 million of cash proceeds from the equity portfolio, including proceeds from Wheel Pros, Walker Edison, DecoPac, WVB, Cano, and others.”

There is a good chance that PNNT will be selling its equity positions in Cano Health, Inc. (CANO), PT Networks, and Walker Edison Furniture over the next 12 to 18 months. These investments account for over $130 million or 11.4% of the portfolio with the proceeds to be reinvested into income-producing assets.

As shown in the table below, these investments are marked well above cost and will likely result in a total of $107 million or $1.60 per share of realized gains.


Management discussed these investments on the recent call mentioning additional NAV upside as well as increased earning potential through reinvestment:

“We are pleased that we have significant equity investments in several of these companies, which can substantially move the needle of our NAV. I would like to highlight some of those companies; the companies are Cano, Walker Edison, PT Network, and JF Petroleum. These companies are gaining financial momentum in this environment and our NAV should be solidified and bolstered from these substantial equity investments as their momentum continues.”

“PT Network is the leading physical and occupational therapy provider in the Mid-Atlantic States. Our equity position has a cost of $23 million and a fair market value of $60 million as of June 30. MidOcean JF Holdings or JF Petroleum, is a leader in the distribution, installation and servicing of vehicle fueling, and related equipment to retail fueling locations in the U.S.”

“Walker Edison is a leading e-commerce platform focused on selling furniture exclusively online through top e-commerce companies. Our equity position has a cost of zero and a fair market value of $9.5 million as of June 30. Due to two capital transactions, one in dividend recap and another in equity financing by Blackstone, we have received cash equal to 4x our capital on our equity position.”

“Cano Health is a national leader in primary healthcare, who is leading the way in transforming healthcare to provide high-quality care at a reasonable cost to a large population. Our equity position has a cost and fair market value on June 30 of zero and $61 million, respectively.”

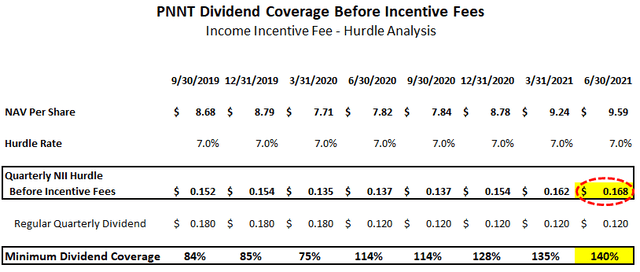
PNNT’s incentive fee “hurdle rate” of 7.0% is applied to “net assets” to determine “pre-incentive fee net investment income” per share before management earns its income incentive fees. As shown in the following table, over the coming quarters the company will likely earn around $0.16 to $0.17 per share each quarter before paying management incentive fees covering around 140% which is ‘math’ driven by an annual hurdle rate of 7% on equity. It is important to note that PNNT could earn less but management would not be paid an incentive fee.


Management is expecting lower amounts of repayments coupled with higher amounts of originations for calendar Q3 2021 which has been taken into account with the updated projections driving higher leverage:

“Since June 30, PNNT has had new originations of $69 million. Although in the June quarter, repayments on loans roughly equaled new loan originations and the September quarter so far repayment activity has abated and new originations have accelerated.”

There is a chance that the company could start repurchasing shares using some of the proceeds from selling equity positions especially given that the stock is trading 32% below its NAV per share and was discussed on the recent call;

Q. “Is there any consideration towards even a modest share repurchase program to take advantage of the discount? I mean, it’s the highest in the peer group and yet your returns seem to be improving and NAV is clearly improved and perhaps that would be a useful way to take advantage of it for shareholders?”

A. “Yes. It’s a great question, and we’re always considering and I think as we generate a $51 million of proceeds on from equity investments this past quarter. I’m hopeful that as – those continue and get even greater. So hopefully it will be a lot greater than the $51 million and dedicate a portion of that over time to buying back the stock. So we got to play it out. We got to start generating these proceeds over the coming quarters. And I would certainly, if the stock price continues to be where it is certainly consider – we would certainly consider dedicating a portion of hopefully bigger proceeds to very worthwhile investment of the stock.”

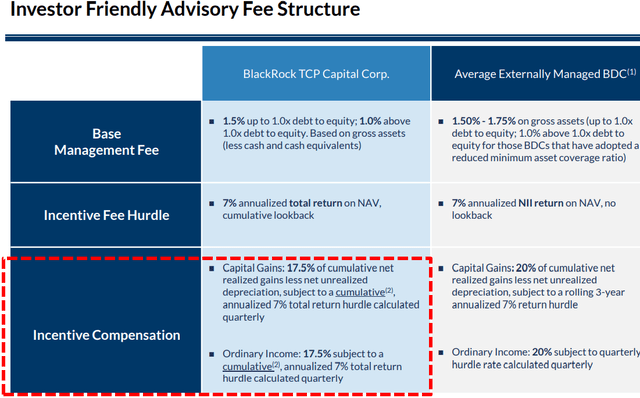
My primary concerns for PNNT are mostly related to the recent increase in payment-in-kind (“PIK”) interest income from 13% to 20% of total income over the last three quarters and the commodity-related exposure combined lack of a “total return hurdle” incentive fee structure to protect shareholders from capital losses. However, management consistently “does the right thing” including continued fee waivers and previously reducing its base management (from 2.00% to 1.75%) and incentive fees (from 20.0% to 17.5%).


PNNT June 30, 2021 & Risk Profile Update

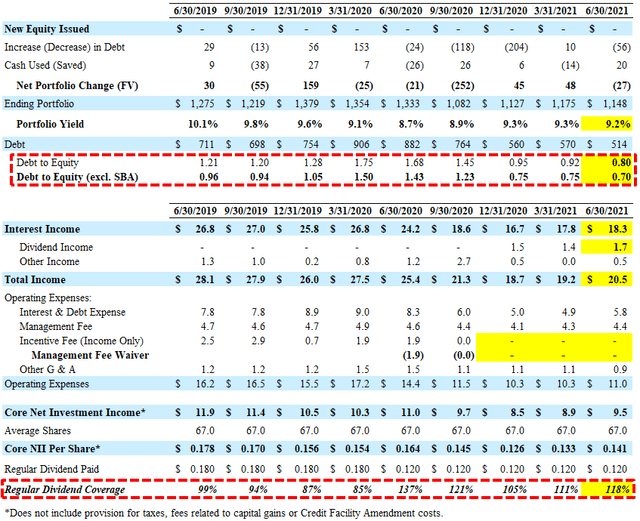
PennantPark Investment (PNNT) reported between its base and best case projections with ‘core NII’ of $0.141 per share and 118% coverage of the quarterly dividend adjusting for $1.1 million of expenses related to the early repayment of SBA debentures and $0.2 million provisions for taxes. There was a slight increase in interest and dividend income from its recently formed joint-venture PennantPark Senior Loan Fund (“PSLF”) which is expected to grow over the coming quarters. Also the company has started exiting some of its non-income-producing assets which will likely be reinvested into “yield generating debt instruments”:

Art Penn, Chairman/CEO: “We are pleased with the substantial increase in net asset value this past quarter due to material appreciation in the value of several equity investments. We believe that we can generate increased income over time as we grow the PNNT and PSLF balance sheets and by rotating equity positions into debt instruments. We are making substantial progress on the exit of those equity investments. Additionally, we have been actively investing in new loans since the most recent quarter end and the outlook in our view for continued growth is excellent.”


PNNT has plenty of borrowing capacity especially after taking into account its SBA leverage at 10-year fixed rates (current average of 3.2%) that are excluded from typical BDC leverage ratios. Previously, PNNT received a “green light” letter for its third SBIC license for an additional $175 million of SBA financing but withdrew the application and will be paying down a portion of its second license:

“We have withdrawn our application for a new SBIC at this time. We intend to gradually pay down SBIC 2, while also providing — proving out our portfolio through COVID, before reassessing.”

On April 14, 2021, PNNT announced the pricing of a public offering of $150 million in its 4.50% unsecured notes due May 1, 2026. These notes were priced just below par driving a yield-to-maturity of 4.625% and will slightly increase the overall borrowing rates but also a more flexible balance sheet for future portfolio growth.

As mentioned in previous reports PRA Events, Inc. and MailSouth, Inc. were added back to accrual status resulting in no non-accrual investments as of December 31, 2020. However, the interest payments from these investments are payment-in-kind (“PIK”) which now accounts for 20% of total income (compared to 13.0% previously) and needs to be watched

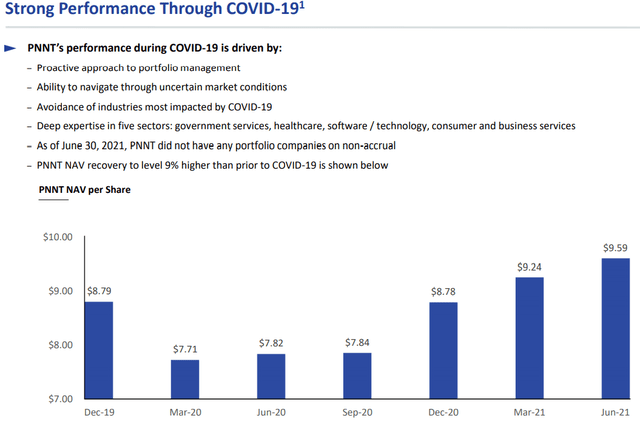
As expected its NAV per share grew by another 3.8% mostly due to equity investments driving PNNT’s leverage (debt-to-equity) well below historical levels (0.70 net of SBA debentures) giving the company plenty of growth capital for increased earnings potential.

“Our portfolio performance remains strong. As of June 30, average debt-to-EBITDA on the portfolio was 4.6x and the average interest coverage ratio, the amount by which cash income exceeds cash interest expense was 3.4x. We have no non-accruals on our books in PNNT and PSLF.”

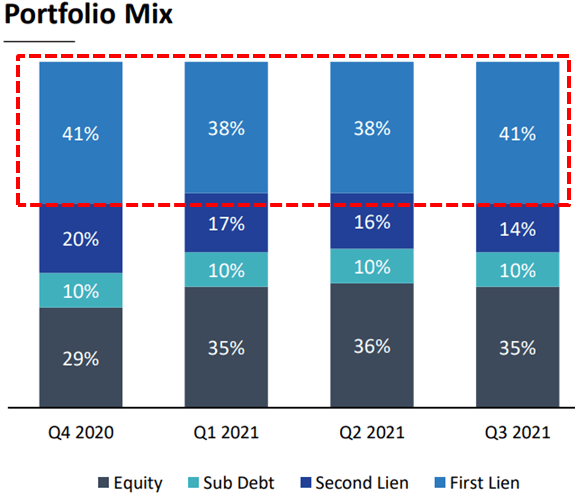
Equity investments now account for 35% of the portfolio and over the coming quarters, I am expecting the company to sell a good portion of these investments (including energy/oil-related) and reinvested into first-lien income-producing assets that should support a higher dividend payment to shareholders.


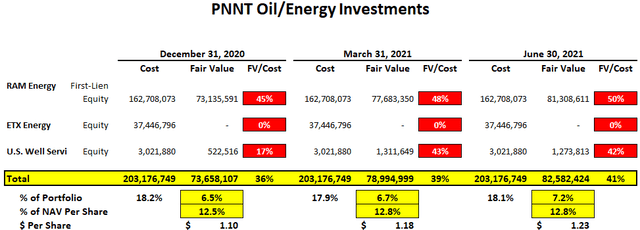
The fair value of energy, oil & gas portfolio exposure is currently around $82.6 million and now only accounts for 7.2% of the portfolio. If PNNT completely marked down its oil/energy-related investments the impact to NAV per share would be around $1.23 or 12.8%. This is more than priced into the stock that is currently trading at a ~32% discount to its NAV/book value of $9.59 per share.


Previously, PNNT recapitalized RAM Energy and converted all of its remaining debt obligations to equity. As mentioned in previous reports, both RAM and ETXhave reduced all nonessential capital expenditures, expenses and personnel. As shown below, the total expenses for RAM continue to decline and the company is now profitable:


Management discussed RAM on the recent call mentioning “we look forward to that day and we will try to optimize value and as expeditious a timeframe as possible”:

“PNNT has among its lowest percentage of energy investments since 2013. Energy investments represent only 7% of the overall portfolio. RAM is now on stable operational and financial footing and has benefited from higher prices and production. The company is free cash flow positive after debt service and plans to use any cash flow to repay debt. As of June 30, equity represented approximately 35% of the portfolio. RAM has a very well delineated acreage and 12 holes in the ground that had been very productive that’s a really good use of shareholder investor cash to buy RAM. So now everyday you’re reading the newspapers, the big companies are being very judicious and careful, they’re not drilling and they’ve got the discipline and all this other stuff. We are waiting for them to feel a little bit more expansive about doing things, whether that be drilling, whether that be M&A and we look forward to that day and we will try to optimize value and as expeditious a timeframe as possible.”


What Can I Expect Each Week With a Paid Subscription?

Each week we provide a balance between easy to digest general information to make timely trading decisions supported by the detail in the Deep Dive Projection reports (for each BDC) for subscribers that are building larger BDC portfolios.

  • Monday Morning Update – Before the markets open each Monday morning we provide quick updates for the sector including significant events for each BDC along with upcoming earnings, reporting, and ex-dividend dates. Also, we provide a list of the best-priced opportunities along with oversold/overbought conditions, and what to look for in the coming week.
  • Deep Dive Projection Reports – Detailed reports on at least two BDCs each week prioritized by focusing on ‘buying opportunities’ as well as potential issues such as changes in portfolio credit quality and/or dividend coverage (usually related). This should help subscribers put together a shopping list ready for the next general market pullback.
  • Friday Comparison or Baby Bond Reports – A series of updates comparing expense/return ratios, leverage, Baby Bonds, portfolio mix, with discussions of impacts to dividend coverage and risk.

This information was previously made available to subscribers of Premium BDC Reports. BDCs trade within a wide range of multiples driving higher and lower yields mostly related to portfolio credit quality and dividend coverage potential (not necessarily historical coverage). This means investors need to do their due diligence before buying.
 

SUNS Quick Update: Low Leverage

The following information was previously provided to subscribers of Premium BDC Reports along with:

  • SUNS target prices/buying points
  • SUNS risk profile, potential credit issues, and overall rankings
  • SUNS dividend coverage projections (base, best, worst-case scenarios)


SUNS Dividend Coverage Update

On September 9, 2021, SUNS reaffirmed its monthly distribution of $0.10 per share for the month of September 2021 payable on October 1, 2021, to stockholders of record as of September 23, 2021.

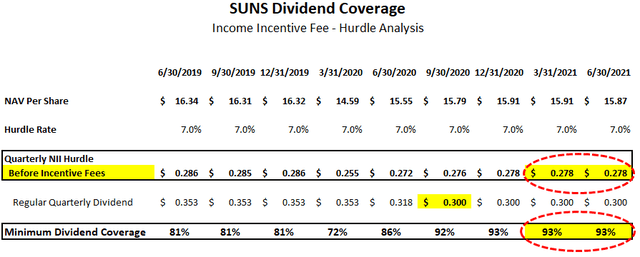
The following table shows the “pre-incentive fee net investment income” per share before management earns income incentive fees based on “net assets”. SUNS will likely earn around $0.278 per share each quarter before paying management incentive fees covering around 93% which is ‘math’ driven by an annual hurdle rate of 7% on equity. As shown in the previous tables, there were no incentive fees paid for the quarter ending June 30, 2021. It is important to note that the calculation is based on the net asset values from the previous quarter.

  • Please note that SUNS will likely have lower earnings per share over the coming quarters due to being underleveraged but management will not earn an incentive fee.

I am expecting improved earnings over the coming quarters mostly through increased leverage and portfolio growth as well as the recent purchase of Fast Pay Partners, a Los Angeles-based provider of asset-backed financing to digital media companies.

“SLR Business Credit acquired Fast Pay a factoring platform that provides working capital solutions to digital media firms across the U.S. led by an experienced team with a strong track record Fast Pay operates in a high growth industry and offers us an expanded product suite in geographic coverage, which should continue to fuel our growth. In conjunction with the acquisition of Fast Pay SLR business credit, amended its credit facility, increased its size, reduced its pricing and created additional flexibility. This transaction is expected to be accretive to business credits income. At quarter end, Fast Pay had a $72 million portfolio consisting of 34 our borrowers.”

It should be noted that the recent lack of portfolio growth was partially due to government stimulus programs that enabled borrowers to significantly reduce the funded balances on their revolving credit facilities. However, as these programs continue to taper off SUNS should experience increased borrowing activity driving portfolio growth:

“We anticipate meaningful portfolio growth during the second half of 2021 as we execute on our robust pipeline. Our sponsor finance business is capitalizing on increased middle-market deal volume, supported by the rebounding U.S. economy, and our specialty finance businesses are seeing greater capital needs from their borrowers as government stimulus tapers off. Utilization rates under business credit loans have been lower during COVID due to many of the borrowers benefiting from government stimulus programs, and using that liquidity to pay down our revolvers. As economic conditions continue to normalize, we expect these borrowers to redraw on our existing credit lines. Pipeline remains strong heading into the second half of the year driven both by increased utilization rates of our facilities, as well as new investment opportunities. We believe that the improved investment opportunities that expanded through SLR business credits acquisition of Fast Pay will continue to increase as companies require financing solutions for working capital and growth initiatives.”

“Now let me turn to our Healthcare ABL segment. The portfolio was $73 million representing nearly 13% of our total portfolio was comprised of loans to 38 borrowers with an average investment of approximately $2 million was 100% performing and had no defaults since the start of COVID. The weighted average yield was just under 12%. In the second quarter, they funded $10 million of new investments have repayments of just over $2 million. Similar to business credit Healthcare ABL was impacted by stimulus programs that enable borrowers to significantly reduce the funded balances on their outstanding revolving credit facilities. These programs have begun to roll off which should result in our borrowers drawing more of their facilities and moving our portfolio closer to its pre-COVID size.”

For Q2 2021, SUNS did not fully cover its dividends due to no fee waivers (same as the previous quarter) combined with being under-leveraged. However, leverage continues to increase and there was a meaningful increase in the portfolio yield.

“We are pleased with the 15% growth in SUNS’ comprehensive portfolio during the second quarter, predominantly driven by an increase in our asset-based lending verticals. Additionally, net investment income increased 25%, and we are optimistic about further earnings growth in the coming quarters.”

As mentioned in previous reports, shareholders approved the reduced asset coverage ratio allowing for higher leverage and management is targeting a range of 1.25 to 1.50 debt-to-equity.

“As a reminder SLR’s in senior’s and target leverage ratio is 1.25 times to 1.50 times net debt to equity under the reduced asset coverage requirement.” “SLR Senior Investment Corp.’s second quarter results benefited from both portfolio expansion and strong overall fundamentals. At June 30, our net debt to equity was 0.51 time, up from 0.4 times at March 31, an approximately 62% as SLR’s senior funded debt was comprised of unsecured term notes. We have over $325 million of available capital to support future earnings growth, and importantly, the economic climate has improved considerably in our pipeline across all four business verticals is very attractive. We expect portfolio growth to continue in the coming quarters from first lien cash flow, as well as asset based investment opportunities.”

SUNS remains a component in the ‘Risk Averse’ portfolio due to “true first-lien” positions diversified across cash flow, asset-based lending, and life science verticals, historically stable net asset value (“NAV”) per share, and low non-accruals. Management has a history of doing the right thing including waiving fees to cover the dividend without the need to “reach for yield” and deploying capital in a prudent manner.

Michael Gross, Co-CEO: “I’m pleased to report that SLR Senior Investment Corp’s, or SUNS, portfolio continues to be 100% performing, which continues to support our investment thesis at a diversified portfolio across asset-based loans in niche markets, in first lien cash flow loans to upper middle-market companies provides meaningful downside protection during challenging economic periods. Credit quality portfolio continues to be strong, and our watch list remains at historic lows. Approximately 57% of our portfolio was invested in asset-based and life science lending strategies and the remaining 43% was in senior secured cash flow loans. Our largest industry exposures were digital media, healthcare services, and insurance. The average investment per issue was $2.5 million or less than one half of 1%. At June 30, approximately 100% of our portfolio consisted of first lien loans with no second lien loan exposure and a de minimis amount of equity.”

There was an increase in the amount of investments with “Internal Investment Rating 3” which are investments “performing below expectations, may be out of compliance with debt covenants” to 5.2% of investments (previously 2.2%):


What Can I Expect Each Week With a Paid Subscription?

Each week we provide a balance between easy to digest general information to make timely trading decisions supported by the detail in the Deep Dive Projection reports (for each BDC) for subscribers that are building larger BDC portfolios.

  • Monday Morning Update – Before the markets open each Monday morning we provide quick updates for the sector including significant events for each BDC along with upcoming earnings, reporting, and ex-dividend dates. Also, we provide a list of the best-priced opportunities along with oversold/overbought conditions, and what to look for in the coming week.
  • Deep Dive Projection Reports – Detailed reports on at least two BDCs each week prioritized by focusing on ‘buying opportunities’ as well as potential issues such as changes in portfolio credit quality and/or dividend coverage (usually related). This should help subscribers put together a shopping list ready for the next general market pullback.
  • Friday Comparison or Baby Bond Reports – A series of updates comparing expense/return ratios, leverage, Baby Bonds, portfolio mix, with discussions of impacts to dividend coverage and risk.

This information was previously made available to subscribers of Premium BDC Reports. BDCs trade within a wide range of multiples driving higher and lower yields mostly related to portfolio credit quality and dividend coverage potential (not necessarily historical coverage). This means investors need to do their due diligence before buying.
 

MRCC Quick Update: Remains Tier 4 For Now

The following information was previously provided to subscribers of Premium BDC Reports along with:

  • MRCC target prices/buying points
  • MRCC risk profile, potential credit issues, and overall rankings
  • MRCC dividend coverage projections (base, best, worst-case scenarios)

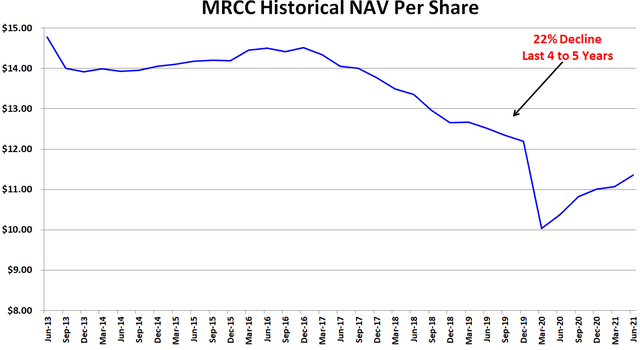
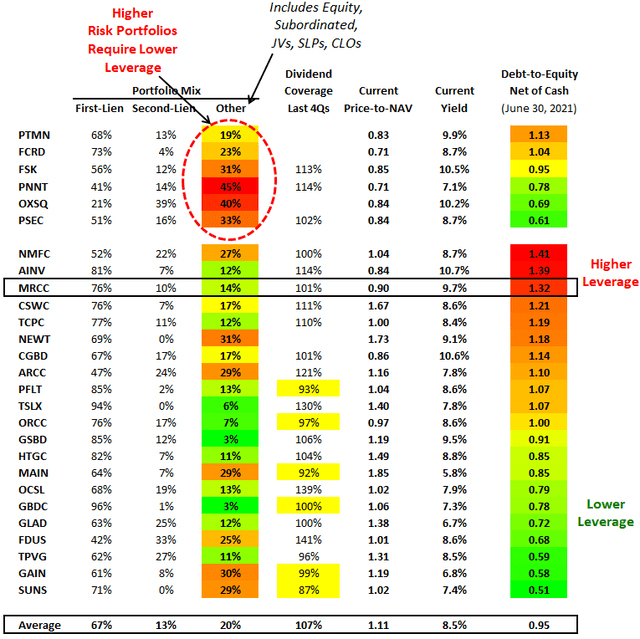
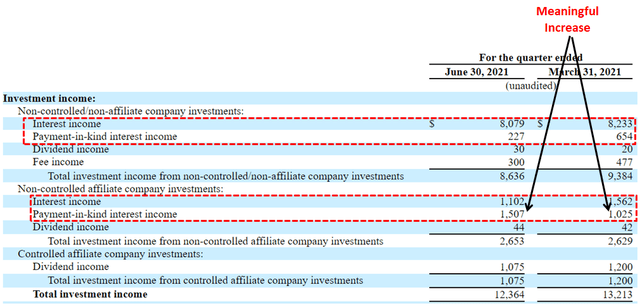
This update discusses Monroe Capital (MRCC) which is considered a higher risk BDC due to previous/potential credit issues, historical realized losses, higher operating expense ratios, the need for higher leverage, and increasing percentage of payment-in-kind (“PIK”) income. MRCC has experienced realized losses of over $30 million (around $1.42 per share) over the last 3 to 4 years driving a 29% reduction in its quarterly dividend (as predicted in previous reports). Also, as discussed later, the total amount of investments considered non-accrual or related as well as on the ‘watch list’ account for over $130 million or 25% of the portfolio with ‘investment performance risk rating’ of 3 to 5 that need to be watched. The total amount of PIK interest income for MRCC increased from 7.9% to 15.9% of total interest income over the last five quarters and could result in a downgrade especially if there is another round of credit issues taken into account with the ‘worst case’ projections. Higher amounts of PIK is typically a sign that portfolio companies are not able to pay interest expense in cash and could imply potential credit issues over the coming quarters.


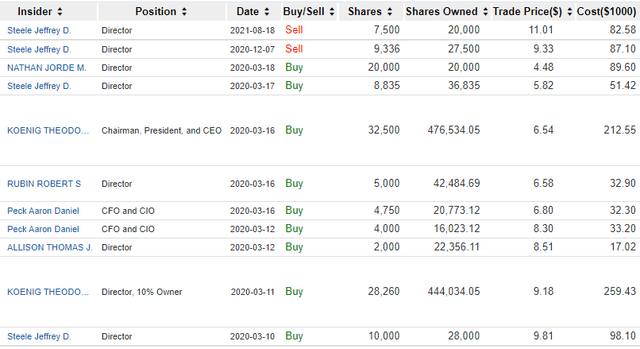
MRCC Previous Insider Purchases & Ownership

  • It should be noted that the most recent insider purchases were at prices below $7.00 followed by two sales near previous price peaks in December 2020 and August 2021.

Temporary Fee Adjustments & Waivers

It is important to point out that many BDCs have been either temporarily waiving fees or have fee agreements that take into account previous capital losses that are ending this year.

  • FSK, AINV, and MRCC have paid very little (or none) incentive fees over the last four quarters due to their ‘total return’ hurdles that are partially or fully coming to end in Q3 2021.
  • GSBD is temporarily waiving certain fees through 2021.
  • ORCC’s fee waivers expired on October 18, 2020.
  • SUNS discontinued its fee waivers starting in 2021.
  • OCSL has agreed to waive $750,000 of base management fees payable in each of the eight quarters following the closing of the merger with OCSI.

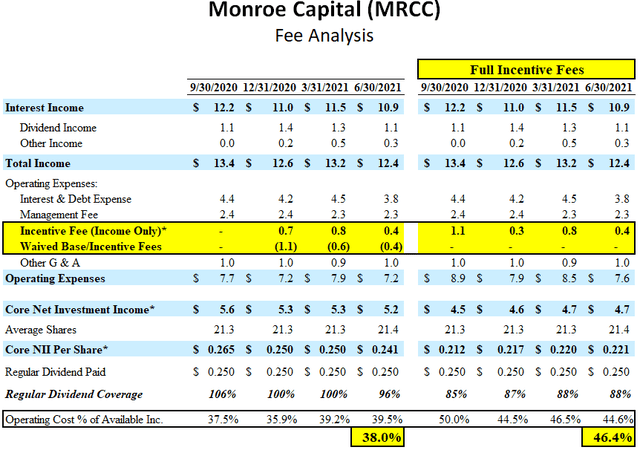
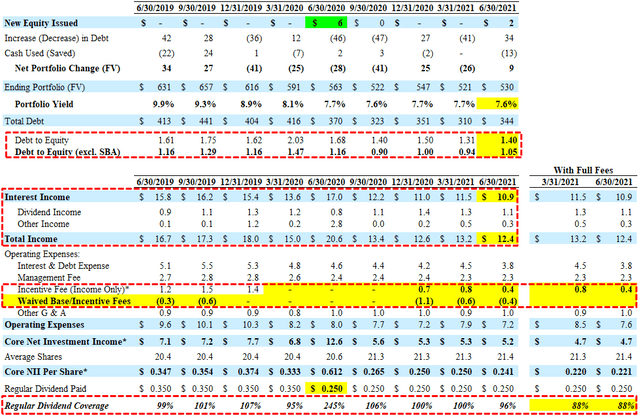
As mentioned in previous reports, MRCC has only covered its dividend only due to management waiving incentive fees to ensure dividend coverage, and its ‘total return requirement’ incentive fee structure driving no incentive fees paid. The following table shows the impact on its dividend coverage and its expense ratios (from 38.0% to 46.4%) if the company paid the full incentive fee.


Adjusted Operating Expense Ratios

The following table shows the average operating cost % for each BDC over the last four quarters as well as the adjusted ratios taking into account all fees without the benefit of temporary fee waivers. It should be noted that NMFC and GLAD also have fee waivers but are mostly permanent and part of the actual fee agreement so I have not adjusted for these BDCs.

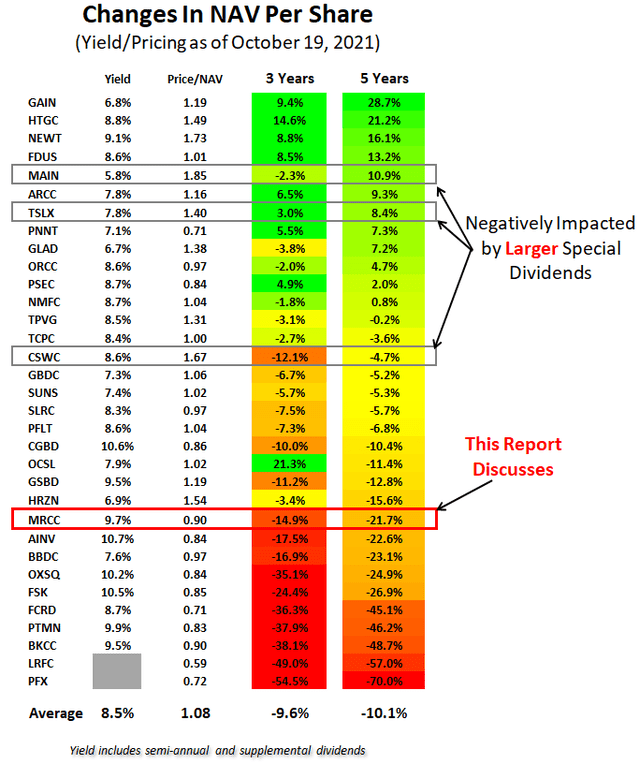
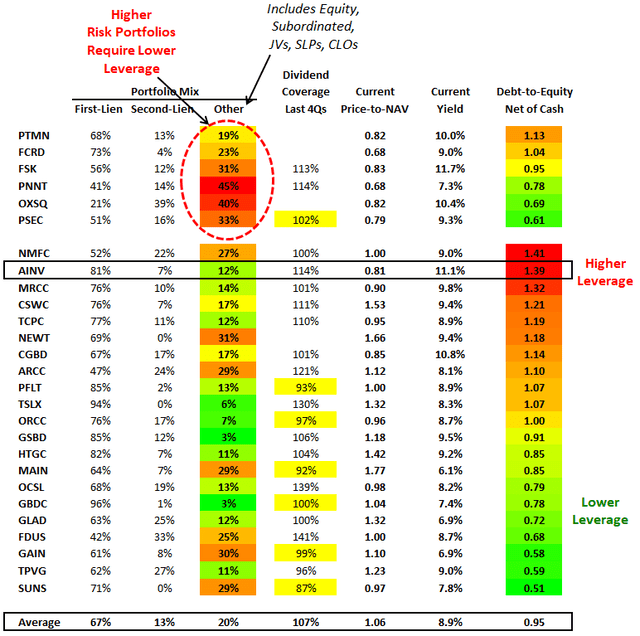
As you can see, all of the higher-risk BDCs that I cover have the highest expense ratios including MRCC, PSEC, FSK, and AINV. It is not a coincidence that these BDCs trade at a lower multiple of NAV driving higher yields. There is a good chance that these companies also have higher risk assets to achieve higher portfolio yields to offset their higher fee structures. As shown in the “Total Return Updates Comparing BDCs & REITs” update, AINV and FSK are among the worst-performing BDCs that I cover likely due to previous dividend cuts that were partially driven by their higher fee structures.


Monroe Capital (MRCC) Dividend Coverage Update

There are many factors to take into account when assessing dividend coverage for BDCs including portfolio credit quality, potential portfolio growth using leverage, fee structures including ‘total return hurdles’ taking into account capital losses, changes to portfolio yields, borrowing rates, the amount of non-recurring and non-cash income including payment-in-kind (“PIK”). Most BDCs have around 2% to 8% PIK income and I start to pay close attention once it is over ~5% of interest income.

Higher amounts of PIK is typically a sign that portfolio companies are not able to pay interest expense in cash and could imply potential credit issues over the coming quarters. The total amount of PIK interest income for MRCC increased from 7.9% to 15.9% of total interest income over the last five quarters and could result in an eventual downgrade to ‘Level 3’ or ‘Level 4’ dividend coverage especially if there is another round of credit issues taken into account with the ‘worst case’ projections shown earlier.

Historically, the company has only covered its dividend only due to the ability to use higher leverage through its SBIC license, management willingness to waive incentive fees to ensure dividend coverage, and its ‘total return requirement’ incentive fee structure driving no incentive fees paid previous quarters. MRCC was previously upgraded from ‘Level 4’ to ‘Level 2’ dividend coverage due to the expected quarterly dividend reduction of almost 30% (from $0.35 to $0.25) but also due to additional capital provided from repayment activity during the quarter, including the realization on RockdaleBlackhawk as well as the previous decline in non-accrual investments. On September 2, 2021, MRCC reaffirmed its quarterly distribution of $0.25 per share for the third quarter of 2021.

For Q2 2021, MRCC reported just below its base case projections due to a continued decline in the amount of recurring interest income (now below $11 million per quarter) driving total income to its lowest level since 2017. Same as the previous quarter, net investment income (“NII”) would have been around $0.22 per share without the benefit of fee waivers covering 88% of the quarterly dividend. Also, the amount of non-cash/PIK income continues to increase and now accounts for 16% of interest income as discussed earlier.

Also, MRCC currently has among the highest leverage ratios relative to most BDCs with a debt-to-equity of 1.40 or 1.32 net of cash compared to the average BDC at around 0.90.

Chief Executive Officer Theodore L. Koenig: “We are pleased to report another quarter of strong financial results. During the second quarter, we reported our fifth consecutive quarterly increase in our Net Asset Value. These positive results are consistent with the success we have enjoyed at Monroe Capital LLC over our 18-year history. We continue to cover our dividend with per share Adjusted Net Investment Income and our new deal pipeline remains strong. The M&A market is very active and we are a significant player in providing private credit in the lower middle market. As always, we continue to be focused on the interests of our shareholders and will remain focused on generation of Net Investment Income, preservation of capital and creation of shareholder value.”

Non-accrual investments currently account for $26.5 million or 5.0% of the total portfolio fair value and if completely written off would negatively impact NAV per share by around $1.24 or 11%. However, there are over $130 million or 25% of the portfolio with ‘investment performance risk rating’ of 3 to 5 and needs to be watched.

As of June 30, 2021, MRCC had 12 borrowers with loans or preferred equity securities on non-accrual status (BLST Operating Company, LLC (“BLST”), California Pizza Kitchen, Inc. (“CPK”), Curion Holdings, LLC (“Curion”), Education Corporation of America (“ECA”), Incipio, LLC (“Incipio”), Luxury Optical Holdings Co. (“LOH”), NECB Collections, LLC (“NECB”), Parterre Flooring & Surface Systems, LLC (“Parterre”), SHI Holdings, Inc. (“SHI”), The Worth Collection, Ltd. (“Worth”), Toojay’s Management, LLC (“Toojay’s OldCo”) and Valudor Products, LLC (“Valudor”) preferred equity), and these investments totaled $26.5 million in fair value, or 5.0% of the total investments at fair value.

Q. “Any idea you can give us in terms of when we might start seeing the overall volume of non-accrual start to go down relative to the overall size of the portfolio?”

A. “It’s a great question. It’s one that’s difficult to answer because not all of these are deals that we control, although a lot of them are. And it really has to do with performance. And as we see these deals, many of them mark up, that’s an indication that performance is improving. So we would expect that for some of these deals that are non-accrual status in that group that they would start to be in a position to start to generate accrued interest, either because they turn back on from an accrual standpoint or because they get realized and that capital can be reinvested in new performing assets that accrue. But it’s difficult to give you any real timing guidance on that at this time. But we are seeing, as we said, significant improvements in many of those names. And so we would expect some of those to do one of two things that I described, either start to accrue again or be monetized and be reinvested in accrual assets.”

It should also be noted that MRCC has around 19% of the portfolio with ‘investment performance risk rating 3’ which includes investments “performing below expectations and indicates that the investment’s risk has increased somewhat since origination” and “the issuer may be out of compliance with debt covenants”. This likely includes some of its investments in Apotheco, LuLu’s Fashion Lounge, VPS Holdings, Answers Finance, and Familia Dental Group Holdings, as well as its preferred shares in California Pizza Kitchen that are still on accrual. This has been taken into account with MRCC’s target prices and I will look for signs of improvement.


What Can I Expect Each Week With a Paid Subscription?

Each week we provide a balance between easy to digest general information to make timely trading decisions supported by the detail in the Deep Dive Projection reports (for each BDC) for subscribers that are building larger BDC portfolios.

  • Monday Morning Update – Before the markets open each Monday morning we provide quick updates for the sector including significant events for each BDC along with upcoming earnings, reporting, and ex-dividend dates. Also, we provide a list of the best-priced opportunities along with oversold/overbought conditions, and what to look for in the coming week.
  • Deep Dive Projection Reports – Detailed reports on at least two BDCs each week prioritized by focusing on ‘buying opportunities’ as well as potential issues such as changes in portfolio credit quality and/or dividend coverage (usually related). This should help subscribers put together a shopping list ready for the next general market pullback.
  • Friday Comparison or Baby Bond Reports – A series of updates comparing expense/return ratios, leverage, Baby Bonds, portfolio mix, with discussions of impacts to dividend coverage and risk.

This information was previously made available to subscribers of Premium BDC Reports. BDCs trade within a wide range of multiples driving higher and lower yields mostly related to portfolio credit quality and dividend coverage potential (not necessarily historical coverage). This means investors need to do their due diligence before buying.


TSLX Quick Update: Likely Strong Q3 & Q4

The following information was previously provided to subscribers of Premium BDC Reports along with:

  • TSLX target prices/buying points
  • TSLX risk profile, potential credit issues, and overall rankings
  • TSLX dividend coverage projections (base, best, worst-case scenarios)


Sixth Street Specialty Lending (TSLX) is considered a higher quality BDC that performs well during distressed environments with management that is very skilled at finding value in the worst-case scenarios including previous retail and energy investments. TSLX often lends to companies with an exit strategy of being paid back through bankruptcy/restructuring and proficient at stress testing every investment with proper coverage and covenants. Management has prepared for the worst as a general philosophy and historically used it to make superior returns.

Over the last six years, TSLX has provided investors with annualized returns of 15% and likely headed higher as the company continues to pay special/supplemental dividends.


TSLX Supplemental/Special Dividends

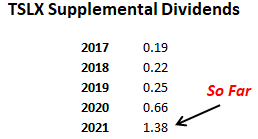
On August 4, 2021, the company reaffirmed its regular quarterly dividend of $0.41 plus another supplemental dividend of $0.02 per share which was just below the previous base case projections of $0.03. TSLX still has around $1.36 per share of undistributed/spillover income.

When calculating supplemental dividends, management takes into account a “NAV constraint test” to preserve NAV per share. This is one of the reasons that management prefers not to pay large supplemental dividend payments even though the amount of undistributed/spillover income continues to grow. However, management also likes to avoid paying excessive amounts of excise tax by “cleaning out” the spillover as it “creates a drag on earnings” which is why the company paid a total of $1.30 per share in supplemental/specials during Q1 2021. Over the last five years, TSLX has increased the amount of supplemental dividends paid:

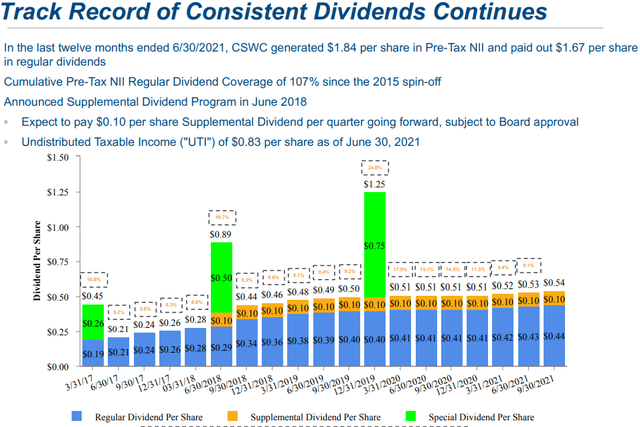
Most dividend coverage measures for BDCs use net investment income (“NII”) which is basically a measure of earnings. However, some BDCs achieve incremental returns typically with equity investments that are sold for realized gains often used to pay supplemental/special dividends. These BDCs include TSLX, FDUS, GAIN, CSWC, PNNT, TPVG, HTGC, and MAIN.

“We’ve always been opportunistic about our equity co-invest program. We’ve invested about $160 million of equity over time. And we’re currently at like, 1.7 times NOM, and my guess that will grow because we have a whole bunch of stuff in the book still. So it’s been a decent source of returns. I think the average return on fully realized has been in the 40% range. So we’ll continue to take our shots. I would say that it’s very specific, so we’re not asking for equity co-invest in every deal. If it fits into a sector where we have a deep fundamental view of the business and think there are the prospects are good, and the valuation is good, we will ask for it. But it’s more rifle than the shotgun and its more I would say actively managed versus kind of a passive strategy of equity co-invest and taking kind of private equity returns across the cycle.”

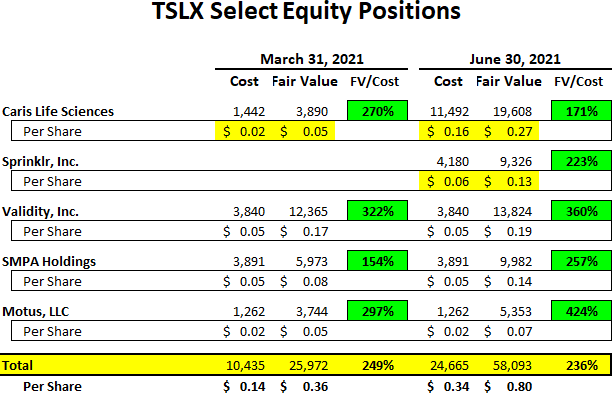
Over the last two quarters, TSLX had an additional $16.6 million or almost $0.23 per share of net realized gains (mostly due to the sale of its equity position in Capsule Technologies to Philips) to support additional special/supplemental dividends. Equity positions increased from 4% to 6% of the portfolio due to continued appreciation including Caris Life Sciences and Sprinklr, Inc. (CXM) as discussed below.

“Primarily by the unrealized gains and the debt equity conversion of certain investments upon milestone events this quarter, our portfolios equity concentration increased slightly from 4% to 6% on a fair value basis.”

“In May, Caris Life Sciences completed a growth equity round at nearly $8 billion post money valuation, led by Sixth Street’s healthcare and Life Sciences team. Since 2018, TSLX has made relatively small investment in the company’s capital structure alongside our affiliated funds, and receive warrants as part of these transactions. Based on the valuation of Caris latest financing round, the fair value of our junior debt, warrant and preferred equity positions increased significantly quarter-over-quarter, contributing to this quarter’s unrealized gain.”

As shown below, Caris Life Sciences, Sprinklr, Inc., Validity, Inc., SMPA Holdings and Motus, are marked well above cost and could result in an additional $0.46 per share if sold/exited at previous fair values. It should be noted that Sprinklr, Inc. (CXM) is currently trading 25% below where it was on June 30, 2021, and there is a 180 lockup on the shares.

Sprinklr, Inc., another one of our portfolio companies and a provider of customer experience management solutions completed its IPO on June 23. We made a small investment in Sprinklr convertible notes, alongside affiliated funds last May. And upon completion of the IPO, our notes automatically converted into common equity. The quarter-end fair value market of our equity position reflects a discount to the company’s June 30 closing share price, given the trading restrictions on our equity security, but still represents a 2.5x NOM on our capital invested.”


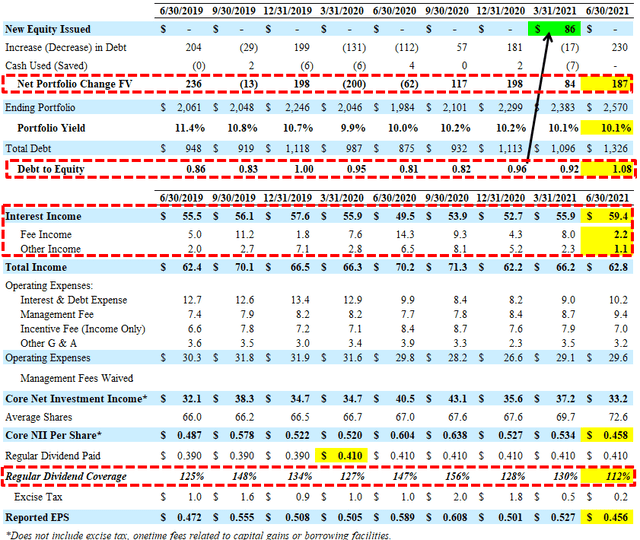
For Q2 2021, TSLX reported just below its base case projections due to lower-than-expected fee and other income partially offset by a record amount of interest income of almost $60 million. It is important to point out the most of the income during the quarter was recurring (as compared to onetime fee and other income).

“Other fees, representing prepayment fees and accelerated amortization of upfront fees from unscheduled pay downs were $2.2 million, compared to $8 million in the prior quarter. Other income was $1.1 million compared to $2.3 million in the prior quarter. The slowdown in portfolio turnover this quarter, and net portfolio growth allowed us to generate a higher quality of earnings from interest income. For reference 95% of this quarter’s total investment income was generated through interest in dividend income, compared to 79% across 2020, and 88% across 2019.”

However, management is expecting increased portfolio activity in Q3 and Q4 2021 including new investments driving higher fee income and interest income which are taken into account with the updated financial projections.

“We have a strong backlog for the second-half of this year, including agent roles on three large financings that total over $1.5 billion in facility size. As you can expect, we’re partnering with our affiliated funds and other managers on these transactions, which provides us the flexibility to determine the optimal final hold sizes for TSLX.”

“I would expect that we continue to leg into our financial leverage. We’re kind of in the lowest to middle of our financial leverage range. I would expect activity levels to — activity level fees and some portfolio turnover in the second-half of the year. So, we’re going to work hard continue to stay kind of in the one plus range, and we’ll given the economic backdrop, I think we’re wanting to take it up to 1.15 to 1.25 in this environment.

Also, there will likely be higher amounts of prepayment related income similar to previous quarters (not Q1 2021) likely driving results closer to the best-case projections:

“In the second-half, we expect some rebound in portfolio repayment activity, which would drive a more normalized level of activity related fees for our business. Based on where we stand today, we believe we are on track to meet the high-end or exceed our previously stated guidance range for full year 2021, which corresponds to return on equity of 11.5% to 12%.”


TSLX Dividend Coverage Update

TSLX has covered its regular quarterly dividend by 112% excluding excise taxes and approximately $0.08 per share of capital gains incentive fees which is also excluded by management.

“Our Q2 figures include approximately $0.08 per share of capital gains incentive fees that were accrued, but not paid or payable, related to cumulative unrealized capital gains in excess of cumulative net realized capital gains less any cumulative unrealized losses and capital gains and incentives paid inception to date. Since capital gain incentive fee accrual is a GAAP-related, non-cash item, we believe the adjusted NII and NI, which excludes the impact of the accrual, more accurately portrays the core earnings power of our business.”


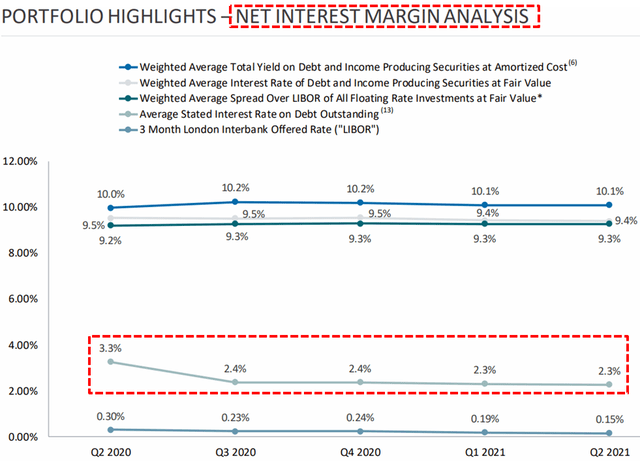
TSLX has been improving its net interest margin through lower cost of borrowings including using its revolving credit facility to fund new investments:

“Our weighted average interest rate on debt outstanding decreased slightly quarter-over-quarter by 4 basis points to 2.26%, as a result of a funding mix shift to greater usage of our secured revolver.”

Also, Q2 2021 was the first quarter the company used leverage with a debt-to-equity ratio over 1.00 reducing its base management fee to 1.00%:

“Lastly on expenses, you’ll notice that we applied for the first time a fee waiver on base management fees related to this quarter’s portion of average gross assets financed with greater than one times leverage. Above that leverage level, base management fees are reduced to an annualized level of 1%. This is the first time since our stockholders approved the application of a 150% minimum asset coverage ratio in 2018, but we have reached this threshold.”


On February 3, 2021, the company issued $300 million of unsecured notes that mature on August 1, 2026 “at a spread to Treasury of 225 basis points”. On February 5, 2021, the company completed an amendment to its revolving credit facility, which increased the commitments from $1.335 billion to $1.485 billion, increased the accordion to allow for commitments of up to $2.00 billion, and extended the maturity to February 4, 2026. As of June 30, 2021, TSLX had $1.1 billion of undrawn capacity on its revolving credit facility.

TSLX maintains a strong balance sheet with 71% unsecured debt with the nearest debt maturity in August 2022 at $143 million, and the weighted average remaining life of investments funded with debt was ~2.4 years, compared to a weighted average remaining maturity on debt of ~4.1 years.

TSLX has around $143 million of convertible notes that could be converted into shares at some point. Management discussed on the recent call and will likely used to “optimize the impact on our NAV per share, ROEs, financial leverage and liquidity position”:

“As mentioned on our last earnings call, we have the flexibility under our 2022 convertible notes indenture to settle in cash or stock or a combination thereof. These notes are not eligible for conversion today, but when it comes time to make a determination on settlement method, our decision will be one that, among other considerations, optimizes the impact on our NAV per share, ROEs, financial leverage and liquidity position.”


TSLX Risk Profile Quick Update

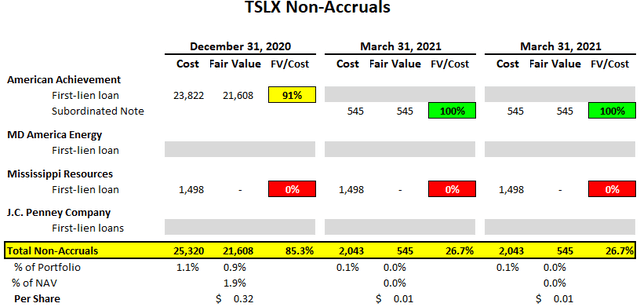
Total non-accruals declined during Q1 2021 due to its first-lien position in American Achievement added back to accrual status. However, the small subordinated position remains on non-accrual.

“Our investments on non-accrual status remains minimal at 0.02% of the portfolio at fair value, representing our restructured sub notes in American Achievement, as discussed on our call in May.”

As discussed in the previous report, American Achievement is a company that manufactures and supplies yearbooks, class rings and graduation products and was discussed on the previous call:

“Our first lien loan for American Achievement remained outstanding post reorg and the interest that we received, while the loan was on non-accrual status, was applied to our loan principal. As part of the restructuring, the lender group received a majority stake of the common equity and subordinated notes in the restructured business. At quarter end, these subordinated notes accounted for all of our outstanding investments on non-accrual status at fair value.”


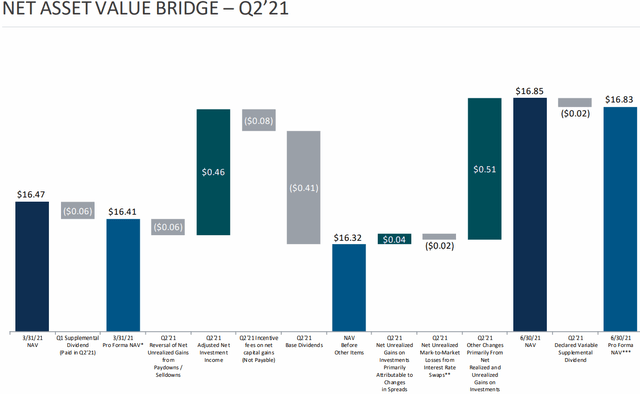
During Q2 2021, TSLX’s net asset value (“NAV”) per share increased by 2.3% mostly due to equity positions including Caris Life Sciences and Sprinklr, Inc. as discussed earlier.

“Gains on investments drove strong net asset value per share growth. If we were to look at the growth in our net asset value since the onset of COVID through today, which would require adjusting for the impact of special and supplemental dividends, we’ve grown that asset value per share by 12.2% since year-end 2019.”


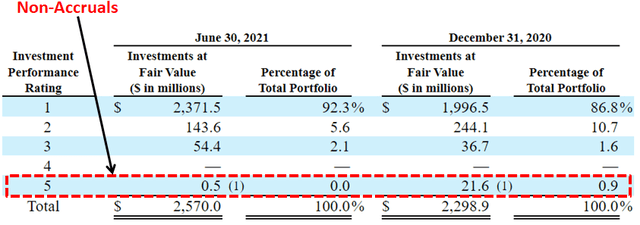
Over 92% of the portfolio (up from 85.5% the previous quarter) is categorized as ‘Performance Rating 1’ which are “performing as agreed and there are no concerns about the portfolio company’s performance or ability to meet covenant requirements. For these investments, the Adviser generally prepares monthly reports on investment performance and intensive quarterly asset reviews.”


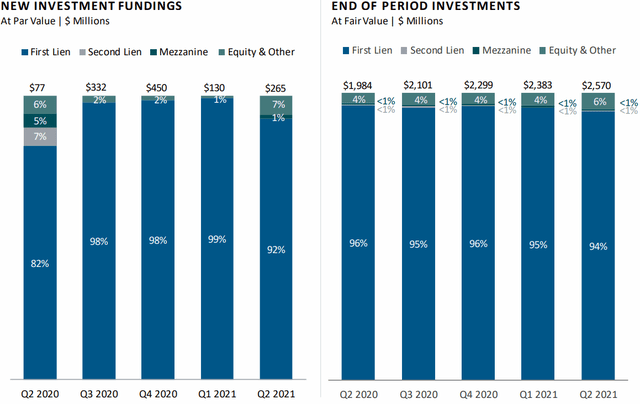
First-lien debt accounts for around 94% of the portfolio and management has previously given guidance that the portfolio mix will change over the coming quarters with “junior capital” exposure growing to 5% to 7%.

From previous call: “We believe the relative resilience of our portfolio is mostly a result of a deliberate shift we made in late 2014 towards a more defensive portfolio construction. Today, 95% of our portfolio by fair value is first lien and nearly 75% of our portfolio by fair value is comprised of mission critical software businesses with sticky predictable revenue characteristics. These businesses also tend to have variable cost structures that it can be fluxed down to support debt service and protect liquidity in cases of challenging operating environments.”

Management is very skilled at finding value in the worst-case scenarios including previous retail and energy investments. TSLX often lends to companies with an exit strategy of being paid back through bankruptcy/restructuring and proficient at stress testing every investment with proper coverage and covenants. On a previous call, management discussed some of its recent returns from retail investments including Neiman Marcus and J.C. Penney:

“With a strong market backdrop in late March, Neiman issued notes in the high-yield market to refinance its exit term loan, which had call protection of [1.10] at the time of repayment. This call protection, in addition to the acceleration of unamortized OID on our loans, contributed meaningfully to our fees this quarter. Recall on our Q3 2020 earnings call, we disclosed that approximately $4 million of backstop fees related to our exit term loan commitment were booked as OID and that these fees were payable in common stock of the reorg company. Post quarter end, we sold our entire Neiman equity position at a price above our March 31, 2021 mark, thereby fully exiting all of our Neiman investment. Looking back, we’ve been a provider of liquidity and transitional capital for the retailers – for the retailer as its management team navigated through a pandemic and a Chapter 11 process. We believe this has been a fruitful partnership that has allowed both parties to create value for our respective stakeholders. Based on our total capital invested in Neiman since 2019, we’ve generated a gross unlevered IRR of approximately at 25% on our fully exited investments, which includes a post quarter-end sale of TSLX equity position.”

“Turning now to a quick update on J.C. Penney. Recall that in December, upon the company’s emergence from Chapter 11, our prepositioned debt and dip loan positions were converted to non-interest paying instruments, but with rights to immediate and future distributions and cash and other securities. During the quarter, our $13.3 million fair value dip loan position was extinguished in connection with the closing of a PropCo. And we received a small cash distribution, along with equity interest in the PropCo.

At quarter end, our PropCo equity interest had a level 2 fair value mark of $18.1 million. Across Q1, our J.C. Penney investments drove $5.4 million of net realized and unrealized gains or a positive $0.08 per share impact to our NAV this quarter.

“At quarter end, our portfolio’s retail and consumer exposure was 11.4% at fair value, and nearly 80% of this consisted of asset based loans. Cyclical names, which exclude our asset-based retail loans and energy investments, continue to be limited at 4% of the portfolio. And our energy exposure at quarter end was 1.7%.”


What Can I Expect Each Week With a Paid Subscription?

Each week we provide a balance between easy to digest general information to make timely trading decisions supported by the detail in the Deep Dive Projection reports (for each BDC) for subscribers that are building larger BDC portfolios.

  • Monday Morning Update – Before the markets open each Monday morning we provide quick updates for the sector including significant events for each BDC along with upcoming earnings, reporting, and ex-dividend dates. Also, we provide a list of the best-priced opportunities along with oversold/overbought conditions, and what to look for in the coming week.
  • Deep Dive Projection Reports – Detailed reports on at least two BDCs each week prioritized by focusing on ‘buying opportunities’ as well as potential issues such as changes in portfolio credit quality and/or dividend coverage (usually related). This should help subscribers put together a shopping list ready for the next general market pullback.
  • Friday Comparison or Baby Bond Reports – A series of updates comparing expense/return ratios, leverage, Baby Bonds, portfolio mix, with discussions of impacts to dividend coverage and risk.

This information was previously made available to subscribers of Premium BDC Reports. BDCs trade within a wide range of multiples driving higher and lower yields mostly related to portfolio credit quality and dividend coverage potential (not necessarily historical coverage). This means investors need to do their due diligence before buying.
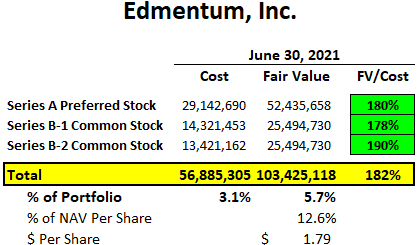
CSWC Quick Update: Continued Excellent Returns

The following information was previously provided to subscribers of Premium BDC Reports along with:

  • CSWC target prices/buying points
  • CSWC risk profile, potential credit issues, and overall rankings
  • CSWC dividend coverage projections (base, best, worst-case scenarios)


Previous CSWC Articles Follow-Up

This article is a follow-up to “Growing Dividends During A Pandemic: Capital Southwest” and “BDCs Continue To Affirm Dividends: Capital Southwest At 15%” which predicted additional increases to CSWC’s regular dividend as well as continued supplemental dividends driving higher returns to shareholders.

CSWC Dividend History

Source: CSWC Investor Presentation

Hopefully, readers purchased shares as the stock is up 103% since the article, and the company has increased its regular quarterly dividend four times as well as paying additional supplemental dividends including the $0.50 “final supplemental” for Q4 2021 announced earlier this month.

As you can see, CSWC has easily outperformed the S&P 500 and as discussed later I was actively purchasing shares just before the article came out.

CWSC outperformed S&P 500

Capital Southwest is an internally-managed BDC with an ~$800 million portfolio of mostly first-lien debt and equity positions historically providing realized gains especially in its lower middle market investments. CSWC remains a “Level 1” dividend coverage BDC implying the potential for increased regular quarterly dividends and/or additional supplemental dividends mostly due to the ability to leverage its internally managed cost structure and history of realized capital gains.

In the lower middle market, we directly originate and lead opportunities, consisting primarily of first lien senior secured loans with smaller equity co-investments made alongside our loans. We believe that this combination is powerful for a BDC as it provides strong security for the vast majority of our invested capital, while also providing NAV upside from equity investments in these growing businesses. Within our lower middle market portfolio as of the end of the quarter, we held equity ownership in approximately 57% of our portfolio companies.”

Source: CSWC Investor Call Transcript


CSWC Q2 2021 Dividend Coverage Update

For calendar Q2 2021, CSWC beat its base case projections mostly due to higher dividend income with much higher-than-expected portfolio growth partially offset by higher “Other G & A” and borrowing expenses (due to higher leverage). The company is now slightly above its lower targeted leverage (1.20) with a debt-to-equity ratio of 1.21 (net of available cash). As of June 30, 2021, CSWC had almost $17 million in unrestricted cash and almost $147 million in available borrowings under its credit facility for upcoming portfolio growth.

 CSWC Q2 2021 Dividend Coverage

There was a meaningful decrease in the amount of payment-in-kind (“PIK”) income during the quarter from $2.8 million to $1.0 million due to a one-time reversal of previous cash interest income for a portfolio company recovering from “operating challenges.”

Q. “Over the last four quarters, PIK income both nominally and as a percentage of total investment income has fallen pretty materially. Is that a kind of a concentrated effort to steer away from PIK income?”

A. “I would tell you it’s actually kind of concentrated. The lower middle market company we put on non-accrual it had essentially converted from cash to PIK and then we obviously inevitably put it in non-accrual this quarter. So there was sort of a write-up of PIK for that company over the last two quarters and then it was reserved against this quarter. So therefore what you’re seeing now is actually the normal run rate of PIK.”

Source: CSWC Investor Call Transcript

Capital Southwest Key Metrics

Source: CSWC Investor Presentation


CSWC Continued Improvement in Earnings

CSWC’s total quarterly interest income has increased by almost 40% over the last two years to its highest level (over $15 million) driving continued dividend increases as the company leverages its internal operating cost structure.

I’m expecting additional regular quarterly dividend increases mostly due to increased returns from its I-45 Senior Loan Fund, reduced borrowing rates (discussed next), and continued portfolio growth combined with leveraging its lower cost operating structure:

Capital Southwest Operating Leverage

Source: CSWC Investor Presentation


On August 27, 2021, CSWC closed its offering of $100 million of 3.375% unsecured notes due Oct. 1, 2026, priced at 99.418% resulting in a yield-to-maturity of 3.5%. The proceeds were used (along with $25 million additional borrowings on its lower rate credit facility) to redeem its $125 million of 5.375% notes due 2024. This will have a meaningful impact on its overall borrowing rate and I have taken into account with the updated projections.

We are pleased with our execution in raising $100 million in long-term unsecured capital. This transaction allows us to redeem the outstanding 2024 Notes, reducing our cost of debt by 2%. We expect that, on an adjusted basis reflecting the issuance of the 2026 Notes, our quarterly interest expense will be reduced by approximately $0.02 per share, which will be beneficial to shareholders in future quarters. Additionally, this capital raise and redemption pushes out our next debt maturity to 2026, providing significant capital flexibility going forward.”

Source: CSWC Investor Call Transcript

Capital Southwest October 2024 notes

Source: CSWC Investor Presentation

In April 2021, CSWC announced that it received a license from the U.S. Small Business Administration (the “SBA”) to operate a Small Business Investment Company (“SBIC”) subsidiary. An SBIC license provides CSWC an incremental source of long-term capital by permitting it to issue up to $175 million of SBA-guaranteed debentures. These debentures have maturities of 10 years with fixed interest rates currently around 3%.

As we’ve discussed on prior calls, we have now begun operations with our SBIC subsidiary, which we’ll see going forward denoted as CSWC SBIC I. As a reminder, our initial equity commitment to the fund is $40 million and we have received an initial commitment from the SBA for $40 million of fund leverage, which is also referred to as one tier of leverage. We expect to invest this initial $80 million of capital over the next six to nine months, at which point we will apply for a second tier of leverage. Over the life of the fund, we plan to draw the full $175 million in SBIC debentures, alongside $87.5 million in capital from Capital Southwest. We are excited to be part of this program and believe it will be a natural fit with our investment strategy.”

Source: CSWC Investor Call Transcript

It should be noted that CSWC already has started utilizing its SBIC license including $7.5 million of SBA debentures through Aug. 23, 2021, as disclosed in the following SEC filing associated with the recently issued notes here.

Management is now targeting a debt-to-equity ratio between 1.20 and 1.30 including upcoming SBA borrowings.

Q. “With the receipt of the first SBIC license can you remind us whether or not you have a target leverage range both in an economic sense and on a regulatory level?”

A. “Our economic leverage is going to be somewhere in the 1.20 to 1.30 range and our regulatory leverage will be between 0.90 and 1.10. We actually think that with the pace of originations and the draws of SBIC we should be near 1 times in the next six months.”

Source: CSWC Investor Call Transcript

Management is expecting continued higher portfolio activity including prepayments (driving additional fee income) partially offset by new investments which are taken into account the updated projections:

Based on dialogue with our portfolio companies, we also believe that the active market will result in elevated prepayments for Capital Southwest over the remainder of this year. We’re looking probably at maybe somewhere in the $30 million to $60 million in potential prepayments between now and the end of the year. Now some of those have make-wholes so the newer companies that maybe have been with us a year or two, they’ll have either 102 or 101. But there’s, others that potentially come back and don’t have a make-whole. So I’m not sure that it’s (“other income”) going to be elevated beyond somewhere in the $500,000 range.”

Source: CSWC Investor Call Transcript

Also taken into account is the following guidance from management for additional dividend income and lower operating expenses (G&A) relative to the previous quarter:

Q. “Can you provide some color on the source of that dividend? And then also confirm whether that should be considered recurring or nonrecurring?”

A. “A portion of that is recurring or received from our shareholders – from our portfolio companies held in our blocker. On a quarterly basis, I think the level is around $300,000 to $350,000 is what we’re receiving. And then some of those tend to be one-time in nature from dividend income coming from portfolio companies of distributions.”

Q. “Looking at the expense side, G&A tracked a bit higher this quarter than last quarter. Is that increase driven by one-time expenses, or is that reflective of higher G&A due to increased scale of the business?”

A. “So some of this is related just to the seasonality, our annual meeting is in July. So we incurred some audit costs and 10-K. So that’s a few hundred — that’s about $200,000. And you’ll see that on — every year in the 6/30 quarter. We also noted we had $100,000 one-time costs for a headhunter for a new principle that we hired, which obviously is one-time in nature. And then, we did increase — we had one new board member and that’s increased professional expenses by $100,000. And so that will be recurring going forward.”

Source: CSWC Investor Call Transcript

Its I-45 Senior Loan Fund accounts for around 10% (previously 8%) of the total portfolio and is a joint venture with MAIN created in September 2015. The portfolio is 96% invested in first-lien assets with CSWC receiving over 75% of the profits paying a quarterly dividend of $1.6 million (previously $1.5 million) but should improve over the coming quarters due to the lower cost on its credit facility and increased leverage.

The I-45 senior loan fund showed solid performance for the quarter with asset growth and unrealized appreciation. Leverage at the I-45 fund level is now 1.4 times debt to equity. As of the end of the quarter, 96% of the I-45 portfolio was invested in first lien senior secured debt. Weighted average EBITDA and leverage across the companies in the I-45 portfolio was $77.9 million and 4.8 times respectively. The portfolio continues to have diversity among industries and an average hold size of 2.6% of the portfolio.”

Source: CSWC Investor Call Transcript

Capital Southwest I-45 loan portfolio

Source: CSWC Investor Presentation


CSWC Equity Positions and Realized Gains

Most dividend coverage measures for BDCs use net investment income (“NII”) which is basically a measure of earnings. However, some BDCs achieve incremental returns typically with equity investments that are sold for realized gains often used to pay supplemental/special dividends.

In the lower middle market, we directly originate and lead opportunities consisting primarily of first lien senior secured loans with smaller equity co-investments made alongside our loans. We believe that this combination is powerful for a BDC as it provides strong security for the vast majority of our invested capital, while also providing NAV upside from equity investments in many of these growing businesses. Building out a well-performing and granular portfolio of equity co-investments is important to driving growth in NAV per share, while aiding in the mitigation of any credit losses over time. As of the end of the quarter, our equity co-investment portfolio consisted of 31 equity investments, totaling $66.1 million representing 8% of our portfolio at fair value. Within our lower middle market portfolio as of the end of the quarter, we held equity ownership in approximately 57% of our portfolio companies.”

Source: CSWC Investor Call Transcript

As shown below, CSWC had realized gains of $18.6 million during calendar Q2 2018 related to the exit of TitanLiner and realized gains of $44.3 million during calendar Q4 2019 related to the exit of Media Recovery. These gains were primarily responsible for previous supplemental dividends and the “final supplemental dividend” is likely the accelerated completion of the commitment to share net realized gains with their shareholders.

Please keep in mind that CSWC has a March fiscal year-end so the quarters shown below are fiscal not calendar.

Capital Southwest Portfolio exits

Source: CSWC Investor Presentation

I am expecting additional supplemental dividends in late 2022 as the company continues to exit equity positions:

…shareholders will continue to participate in the successful exits of our investment portfolio through special distributions as we monetize the unrealized appreciation in our portfolio.”

We continued our track record of successful exits with one this quarter. We exited our equity investment in Tax Advisors Group, generating a realized gain of $1.1 million and an IRR of 34%. To date, we have generated a cumulative weighted average IRR of 15.2% on 39 portfolio exits, representing approximately $385.1 million in proceeds.”

Source: CSWC Investor Call Transcript

capital southwest exits

Source: CSWC Investor Presentation


Summary

On Sept. 2, 2021, CSWC increased its quarterly regular dividend from $0.44 to $0.47 per share for Q4 2021 and decided to accelerate expected future payments under the supplemental dividend program declaring a “final supplemental dividend” of $0.50 per share.

Bowen Diehl, President/CEO: “We are pleased to announce today that our Board has declared a $0.47 regular dividend for the quarter ended December 31, 2021, an increase of 6.8% compared to the $0.44 regular dividend already declared for the quarter ended September 30, 2021. Our recent successful capital markets activities, combined with strong credit portfolio growth and performance, give us confidence that we can continue to steadily grow our regular dividend going forward. In addition, we believe the accelerated distribution of $0.50 per share from our undistributed taxable income (“UTI”) maximizes value for our shareholders, while still maintaining an adequate UTI balance going forward. We have significantly strengthened our balance sheet capitalization since we established the supplemental dividend program in June 2018, and thus feel confident in our ability to accelerate the supplemental dividend payment at this time. Going forward, shareholders will continue to participate in the successful exits of our investment portfolio through special distributions as we monetize the unrealized appreciation in our portfolio.”

Source: CSWC Press Release

It’s interesting to note that this announcement was 10 weeks early as the company typically announces Q4 dividends during the third week of October and large Q4 supplementals in November (after assessing taxes) as they did in 2019 for the $0.75. This means that the company is doing well and we can expect Q3 2021 to be very strong likely with a large amount of realized earnings from equity investments.

Capital Southwest Dividends

Source: Seeking Alpha

As mentioned earlier, I am expecting additional increases in the regular dividend plus continued supplemental/special dividends mostly due to:

  • Leveraging its internal operating cost structure
  • Continued portfolio growth
  • Increased returns from its I-45 Senior Loan Fund
  • Reduced borrowing rates
  • Additional realized gains from harvesting equity positions

A large part of my Sustainable Dividends service is not only knowing which BDCs to buy but also knowing when to buy. For example, the “CSWC Updated Projections: Excellent Timing!” recommended purchasing CSWC on June 30, 2021, after it had fallen from $27.50 to $23.23 with an RSI of 32.20 as shown below.

CWSC stock price

Source: Yahoo Finance


What Can I Expect Each Week With a Paid Subscription?

Each week we provide a balance between easy to digest general information to make timely trading decisions supported by the detail in the Deep Dive Projection reports (for each BDC) for subscribers that are building larger BDC portfolios.

  • Monday Morning Update – Before the markets open each Monday morning we provide quick updates for the sector including significant events for each BDC along with upcoming earnings, reporting, and ex-dividend dates. Also, we provide a list of the best-priced opportunities along with oversold/overbought conditions, and what to look for in the coming week.
  • Deep Dive Projection Reports – Detailed reports on at least two BDCs each week prioritized by focusing on ‘buying opportunities’ as well as potential issues such as changes in portfolio credit quality and/or dividend coverage (usually related). This should help subscribers put together a shopping list ready for the next general market pullback.
  • Friday Comparison or Baby Bond Reports – A series of updates comparing expense/return ratios, leverage, Baby Bonds, portfolio mix, with discussions of impacts to dividend coverage and risk.

This information was previously made available to subscribers of Premium BDC Reports. BDCs trade within a wide range of multiples driving higher and lower yields mostly related to portfolio credit quality and dividend coverage potential (not necessarily historical coverage). This means investors need to do their due diligence before buying.

ORCC Quick Update: Making Progress

The following information was previously provided to subscribers of Premium BDC Reports along with:

  • ORCC target prices/buying points
  • ORCC risk profile, potential credit issues, and overall rankings
  • ORCC dividend coverage projections (base, best, worst-case scenarios)


This update discusses Owl Rock Capital Corporation (ORCC) which remains one of the best-priced BDCs especially for lower-risk investors that do not mind lower yields. ORCC is for risk-averse investors as the portfolio is mostly larger middle market companies that would likely outperform in an extended recession environment. Also, the company has ample growth capital available for increased earnings over the coming quarters.

We generally favor bigger companies for our portfolio. This year, we have already evaluated more than 20 opportunities over $1 billion in size, and invested in or committed to eight of these and continue to evaluate others. This trend continues to accelerate and is creating exciting opportunities for large direct lenders like Owl Rock. We believe we are especially well-positioned for this due to our scale platform with a full suite of financing solutions, large, deeply experienced team with strong relationships in the financial sponsor community.”

ORCC is the third-largest publicly traded BDC (much larger than MAIN, PSEC, GBDC, GSBD, NMFC, and AINV) with investments in 129 portfolio companies valued at almost $12 billion that are mostly first-lien secured debt positions. ORCC is one of the few BDCs rated by all of the major credit agencies.


ORCC Dividend Coverage Update

ORCC’s longer-term (“LT”) target price takes into account improved dividend coverage over the coming quarters mostly due to:

  • Increased use of leverage to grow the overall portfolio
  • Additional prepayments fees and accelerated OID
  • Higher portfolio yield from rotating into higher yield assets
  • Continued lower cost of borrowings
  • Increased dividend income from its Senior Loan Fund

ORCC continues to increase leverage and is now approaching the midpoint of its target debt-to-ratio between 0.90 and 1.25 (currently 1.00 excluding $627 million of available cash) giving the company plenty of growth capital.

“We are now well within our target leverage range and continue to grow the portfolio, which has allowed us to make substantial progress towards covering our dividend. Despite a competitive market backdrop, we’re able to deploy capital into attractive investments and drive incremental yield in the portfolio. The pace of repayments also picked up resulting in a meaningful increase of prepayment related income. And opportunistic financings and improving financing spreads have allowed us to continue to lower our overall cost of funding.”

“As a result of this activity our net leverage increased to 1.00 times approaching the midpoint of our target ranges of 0.90 to 1.25 times. I would expect that we would operate somewhere between there and 1.10 in sort of center of gravity. We look around the portfolios can certainly support that. We’re very focused on keeping really strong ratings for the rating agencies. We’re in constant communication with the agencies and believe that will continue to have good investment grade ratings in that that range. It’s obviously very dependent upon flows in any one quarter. So could dip a little higher, dip a little lower, depending upon one deal plan within a quarter. But 1.00 to 1.10 is probably the right range for folks to be modeling in again be could be a bit higher or lower.”

Management is expecting another strong quarter partially due to higher prepayment-related income which has been taken into account with the updated financial projections and was discussed on the recent earnings call:

“We are encouraged by our visibility on the third quarter and expect another very solid quarter of originations. In terms of repayments, we also expect another strong quarter which should again generate meaningful prepayment income in Q3. Given our strong origination activity, we are confident we will be able to offset repayments by deploying the capital into new originations at attractive spreads. We have visibility on our third quarter. It’s going to be a very active one from an origination standpoint I would say. Again it depends on when everything winds up closing and you just even when you have high visibility until it closes, you’re not sure, but I would expect it to be in line with the second quarter possible possibly exceed it.”

Also taken into account with the updated projections is additional dividend income from its ORCC Senior Loan Fund (previously Sebago Lake LLC) which now accounts for 1.4% of the total portfolio. Management is expecting this joint venture with Nationwide Life Insurance to provide quarterly dividend income of $7 million:

“A few weeks ago we announced an increase in capital commitments towards joint venture loan funds. The fund has generated an attractive average quarterly ROI over the past three years of approximately 10%. ORCC increased its commitment to $325 million, and in addition increased its economic ownership to 87.5% from 50%. We’re also excited to bring a nationwide life insurance as a new partner in the JV. Nationwide, it’s been a meaningful ORCC shareholders since inception, and purchase the remaining 12.5% economic interest from UC Regents effective June 30. In conjunction with these changes, the joint venture will be referred to as ORCC Senior Loan Fund going forward in our disclosures. And so we’ll just be able to increase over time the amount of money ORCC has working and grow that. I think in the most recent quarter, we had about $4 million of dividends that number, when we get all that working it’s going to take some time should be we $7 million a quarter, which is I think terrific.”


Similar to other BDCs, ORCC has been improving or at least maintaining its net interest margin which is the difference between the yield on investments in the portfolio and the rate of borrowings. During the most recently reported quarter, ORCC maintained its portfolio yield but will likely trend higher over the coming quarters as the company rotates into higher yield assets “without sacrificing credit quality”:

“We’ve talked about our desire to rotate a bit and get a little more spread [higher yields] in the portfolio without sacrificing credit quality. And I think what you’re seeing tangible evidence that we’re succeeding on that. Our average spread on new commitments was approximately 670 basis points, up from 640 basis points last quarter. Our overall spread increased as a result of our ability to originate some higher spread unit tranches particularly in the software sector, as well as an increase in second lien investments and a new preferred investment. We’re pleased with our success at increasing the average spread on our investments over the last year which is now roughly 20 basis points higher than it was a year ago. We believe this reflects the strength of our origination capabilities and relationships and the continued attractiveness of our direct lending solutions. ”

ORCC’s average borrowing rate has declined from 4.6% to 3.0% over the last six quarters due to continued issuances of notes and CLOs at lower rates including another $400 million of its 2.875% notes due 2028 issued on August 17, 2021.

“Given ORCC’s scale since inception, we knew it was critical to have a diversified financing landscape and we embarked on building a balance sheet that would provide financial flexibility and ample liquidity from multiple financing sources. In addition to developing a large diverse bank group that provides us with a billion and a half of revolving credit capacity we have also issued almost $4 billion across eight unsecured bond deals, and over $1.5 billion across six CLOs to efficiently finance our balance sheet. We have been able to meaningfully improve pricing since our first issuances in both cases. We’re pleased with the continued growth of our unsecured financing while we continue our efforts to reduce our borrowing costs. We capitalized on strong conditions in the unsecured bond market during the quarter, raising $950 million across two deals of attractive spreads. In addition to the long five year that we issued in April, we raised an additional $450 million in a seven year bond which priced at a fixed coupon of 2.78%. This is our first seven year bond and should help us to enhance the laddering of our debt maturity profile. As of June 30, more than 60% of our outstanding borrowings were from unsecured debt. Our unsecured bond pricing levels have improved over 100 basis points since we’ve been accessing the unsecured market and we believe there is additional improvement we can capture on future issuances.”


As of June 30, 2021, ORCC had around $2.2 billion of liquidity consisting of $627 million of cash and almost $1.6 billion of undrawn debt capacity (including upsizes).


For Q2 2021, ORCC hit its best-case projected earnings due to higher-than-expected prepayment-related, dividend, and fee income as well as higher portfolio growth growing total income to the highest level of $249 million. ORCC was not expected to cover its quarterly dividend but Core NII of $0.305 (excluding excise tax) covered 98% of its regular dividend of $0.310. The Board reaffirmed its third-quarter 2021 dividend of $0.31 per share for stockholders of record as of September 30, 2021, payable on or before November 15, 2021.

“Net investment income for the quarter was $0.30 up from $0.26 per share in the first quarter. We made substantial progress towards covering our $0.31 quarterly dividend and remain on track to cover it in the second half of the year. This was driven by a significant increase in both originations and repayments and continued strong credit performance.”

It should be noted that there was $1.8 million of non-recurring interest expense that negatively impacted earnings during the quarter:

“I would highlight that we had $1.8 million of non-recurring interest expense related to the acceleration of upfront deferred financing fees as we continue to optimize our financing costs through the restructuring of one of our CLOs.”


ORCC Quick Risk Profile Update

Two of its smaller first-lien loans to QC Supply were added to non-accrual status during Q2 2021. CIBT Global, Inc. remains on non-accrual but was restructured during the quarter driving realized losses of $0.07 per share but will likely be back on accrual in Q3 2021. Please keep in mind that ORCC has 129 portfolio companies so there will always be a certain amount on non-accrual which currently account for 0.5% of the total portfolio fair value as shown below.

“While we continue to have a small number of challenge credits, our non-accruals remain extremely low with only two investments on nonaccrual status at the end of the quarter representing less than point 0.5% of the portfolio based on fair value, one of the lowest levels in the BDC sector.”


Investments Rating 3 or 4 which are borrowers performing “below” or “materially below” expectations indicating that the loan’s risk had increased “somewhat” or “materially” are now below 10% of the portfolio. Swipe Acquisition Corporation was previously the only investment with ‘Rating 5’ and was upgraded in Q4 2020.

“We continue to see sequential improvement in the engine our lowest rating category, those names rated four or five. These have decreased from 1.9% to 0.5% of the portfolio quarter-over-quarter.”

As mentioned earlier, ORCC’s portfolio is mostly larger middle market companies that would likely outperform in an extended recessionary environment.

We generally favor bigger companies for our portfolio. This year, we have already evaluated more than 20 opportunities over $1 billion in size, and invested in or committed to eight of these and continue to evaluate others. This trend continues to accelerate and is creating exciting opportunities for large direct lenders like Owl Rock. We believe we are especially well-positioned for this due to our scale platform with a full suite of financing solutions, large, deeply experienced team with strong relationships in the financial sponsor community.”

“We ended the second quarter with NAV per share of $14.90 up $0.08 from the first quarter. Credit quality remains strong with an average fair value of 98 consistent with prior quarters. The overwhelming majority of the portfolio continues to perform very well with 93% of debt investments marked above 95% of par. Most of our borrowers have returned to normalize operating levels and many experienced strong performance in Q2. While we are closely monitoring COVID developments, we have a positive outlook for the overall economy in the second half of the year as consumer demand further rebounds. We believe this will continue to drive good results for our borrowers.”


The portfolio is highly diversified with the top 10 positions accounting for around 19% of the portfolio with low cyclical exposure including retail, oil, energy, and gas.

“Today the portfolio is well diversified across 29 industries and the top 10 positions make up only about 19% of the total portfolio.”


What Can I Expect Each Week With a Paid Subscription?

Each week we provide a balance between easy to digest general information to make timely trading decisions supported by the detail in the Deep Dive Projection reports (for each BDC) for subscribers that are building larger BDC portfolios.

  • Monday Morning Update – Before the markets open each Monday morning we provide quick updates for the sector including significant events for each BDC along with upcoming earnings, reporting, and ex-dividend dates. Also, we provide a list of the best-priced opportunities along with oversold/overbought conditions, and what to look for in the coming week.
  • Deep Dive Projection Reports – Detailed reports on at least two BDCs each week prioritized by focusing on ‘buying opportunities’ as well as potential issues such as changes in portfolio credit quality and/or dividend coverage (usually related). This should help subscribers put together a shopping list ready for the next general market pullback.
  • Friday Comparison or Baby Bond Reports – A series of updates comparing expense/return ratios, leverage, Baby Bonds, portfolio mix, with discussions of impacts to dividend coverage and risk.

This information was previously made available to subscribers of Premium BDC Reports. BDCs trade within a wide range of multiples driving higher and lower yields mostly related to portfolio credit quality and dividend coverage potential (not necessarily historical coverage). This means investors need to do their due diligence before buying.
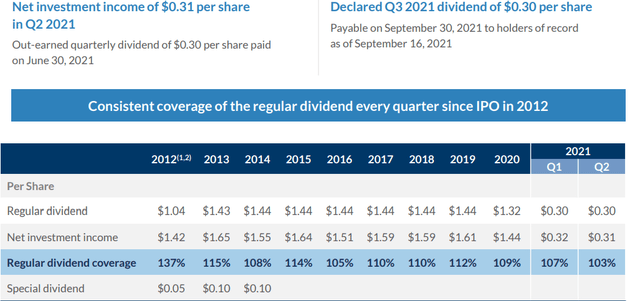
AINV Quick Update: Higher Yield For A Reason

The following information was previously provided to subscribers of Premium BDC Reports along with:

  • AINV target prices/buying points
  • AINV risk profile, potential credit issues, and overall rankings
  • AINV dividend coverage projections (base, best, worst-case scenarios)


AINV Distribution Update

On August 5, 2021, the Board declared a distribution of $0.31 per share payable on October 8, 2021, to shareholders of record as of September 21, 2021. On August 5, 2021, the Company’s Board also declared a supplemental distribution of $0.05 per share payable on October 8, 2021, to shareholders of record as of September 21, 2021.

Since 2018, the distributions to shareholders have been covered only through fee waivers and not paying the full incentive fees. However, the company will likely start paying incentive fees during the September 30, 2021, quarter which will have a meaningful impact on dividend coverage and was discussed on the recent (August 5, 2021) call:

“Given the total return hurdle feature in our fee structure and the recovery in our portfolio over the last several quarters, we expect to begin to pay a partial incentive fee in the quarter ending September 2021. The exact timing and amount will vary based upon — based on future gains and losses if any, as well as the level of net investment income for the quarter. As we said on last quarters call, we believe AINV net investment income, may fluctuate over the next few quarters as we begin to pay incentive fees. That said we expect to generate higher revenue from certain investments, including Merx, which will help offset the impact from incentive fees.”

As discussed later, AINV’s recurring interest income has recently declined to its lowest level over the last 15 years and the company would have only covered around 86% of the quarterly dividends if the full incentive fees had been paid.

“The quarter-over-quarter decline in interest income was attributable to the pace of the investment activity and a relatively higher yield on repayments versus fundings. The weighted average yield at cost on our corporate lending portfolio was 7.7% at the end of June, down from 7.8% last quarter. Prepayment income was $4 million, up from $3.3 million last quarter.”

Investors should expect dividend coverage to “fluctuate” over the coming quarters but management seems committed to paying the regular quarterly distribution of $0.31 plus the supplemental distribution of $0.05 through March 31, 2022, as discussed on the recent call:

“We remain confident in the trajectory of our earnings, and our long-term plan. As mentioned last quarter, we intend to declare a quarterly based dividend distribution of $0.31 per share, and a quarterly supplemental distribution of $0.05 per share for at least the next two quarters. To be clear, this would be an addition to the distribution declared today.”

There is a chance that AINV could be downgraded to ‘Level 3’ dividend coverage (implying the potential for a reduction in the amount of total dividends paid) depending on the progress of rotating out of “non-earning and lower yielding assets” and improved results/income from its investment in Merx Aviation:

“We believe Merx has successfully navigated this challenging period, and we expect AINV will be able to generate higher revenue from Merx in the coming quarters.”

Management has guided for portfolio growth using increased leverage which is already among the highest in the sector at 1.39 debt-to-equity (net of cash) compared to the average BDC currently around 0.95 as shown in the following table.

“Net leverage increased to 1.39 times at the end of June, up from of 1.36 times last quarter and slightly below our target leverage range of 1.40 times to 1.60 times. As we look ahead, we are confident in our ability to grow our portfolio and operate within our target leverage range, given the tremendous need for creative and flexible private capital and the unique and robust nature of the Apollo mid cap platform.”

The following table shows each BDC ranked by its simple (not effective) debt-to-equity ratio net of cash (non-restricted) along with its portfolio mix. The “Other” column includes everything that is not first or second-lien secured debt.


I have updated the projections for AINV to take into account the recently reported results as well as guidance from management on the recent and previous calls.

From previous call: “We said that we believe a $0.31 base distribution reflects a conservative estimate of the long-term earnings power of our core portfolio, and that the supplemental distribution would be a function of the redeployment of non-earning and lower yielding assets from noncore and legacy assets, as well as an increase in yield we received from our Merx investment. We remain constructive on each of these drivers, although we expect some of the benefits of these drivers will occur after we start accruing incentive fees. As a result, net investment income may fluctuate over the next few quarters as we continue to reposition out of noncore and legacy assets and grow the portfolio to within our target leverage range.”

“Looking ahead to fiscal year 2022, we will continue to seek to optimize and de-risk our portfolio and rotate out of our remaining noncore and second lien assets into core assets. The noncore assets are generating about a 4% or 5% return. So, as we generate cash off those assets and redeploy them into our current yield and we get Merx back to a level of producing income, not to where it was before, but to sort of a new moderated level, we can generate enough income after the incentive fee to cover that dividend.”

During the three months ended June 30, 2021, the Company repurchased 145,572 shares at a weighted average price per share of $13.92, inclusive of commissions, for a total cost of $2.0 million. This represents a discount of approximately 12.72% of the average net asset value per share for the three months ended June 30, 2021. During the period from July 1, 2021, through August 4, 2021, the Company repurchased 44,418 shares at a weighted average price per share of $13.46 inclusive of commissions, for a total cost of $0.6 million. Since the inception of the share repurchase program, the company has repurchased 13,800,150 shares at a weighted average price per share of $16.31 for a total cost of $225.1 million, leaving a maximum of $24 million available for future purchases. On July 9, 2021, the company priced an offering of $125 million of 4.500% Notes due July 16, 2026.

“Regarding liquidity, given the continued improvement in the quality of our investment portfolio, our liquidity position continues to strengthen both quarter end in July, we issued $125 million up 4.5% unsecured notes due on July 26. Despite the dilutive impact of these notes, we believe it was prudent to diversify and extend the maturity of our funding sources.”

“Regarding stock buybacks during the quarter AINV purchased 145,500 shares at an average price of $13.92 for a total cost of $2 million. From July 1 — this is first quarter to August 4, 2021, we purchased an additional 44,000 shares at an average price of $13.46 for a total cost of $600,000, leaving approximately $24 million authorization for future purchases under the Board’s current authorization.”

For calendar Q2 2021, AINV reported between its worst and base case projections due to the continued decline in its portfolio yield driving recurring interest income to its lowest level over the last 15 years. As shown in the following table, the company would have covered around 86% of the quarterly dividends if the full incentive fees had been paid which is a slight decline from the previous quarter.


Previously, AINV was considered a ‘Level 4’ dividend coverage BDC implying that a dividend reduction was imminent and on August 6, 2020, the company announced a decrease in the regular quarterly dividend per share from $0.45 to $0.31. Subsequently, AINV was upgraded to ‘Level 2’ due to the dividend reduction and the strong likelihood that the company would not be paying incentive feesover the coming quarters.

From previous call: “Turning to our distribution, in light of the challenges and uncertainty created by the COVID-19 pandemic and our plans to further reduce the funds leverage, we have reassessed the long-term earning power of the portfolio and included that as a prudent to adjust the distribution at this time. We believe that distribution level should reflect the prevailing market environment and be aligned with the long-term earnings power of the portfolio. Going forward in addition to a quarterly based distribution, the company’s Board expects to also declare supplemental distribution and an amount to be determined each quarter.”

It is important to note that AINV has experienced around $700 million of realized losses over the last ~8 years which is around $10.75 per share using the current number of shares. This compares to other BDCs with a history of realized gains such as ARCC with $725 million of realized gains during the same period. A good portion of AINV’s previous and recent losses were due to higher amounts of exposure to cyclical sectors including extended stay hotels and oil/energy. However, PNNT also had larger amounts of oil/energy exposure with much strong NAV performance during the same period. This is likely due to AINV’s management previously taking on too much risk including concentration risk in the wrong sectors.


AINV Quick Risk Profile Update

During calendar Q2 2021, non-accruals declined from 1.4% to 1.1% of the portfolio fair value (5.6% of the portfolio at cost) due to marking down its investments Glacier Oil & Gas and Ambrosia Buyer Corp partially offset by marking up Spotted Hawk. It should be noted that there will likely be continued realized losses over the coming quarters including previously discussed investments some of which are included in the table below. These investments alone account for $268 million or $4.11 per share of previous unrealized losses but still account for 7.0% of the total portfolio and 16.6% of NAV per share.


Management is working to exit its investment in Spotted Hawk and was discussed on the previous earnings call:

“The oil and gas investments, it’s really Spotted Hawk is the one of size. And we are — sort of now that oil prices have picked up and there’s some sense of — there’s some — visibility is too strong a word. There’s some possibility of sort of constructive transactions, we’re going to be as aggressive as we can there to sort of exit that.”

The largest markdown during the quarter was its equity position in Dynamic Product Tankers which is a shipping business 85% owned by AINV (since 2015) as discussed in previous reports. As shown below, AINV currently has $22 million subordinated loan due July 2024 at a very low rate of LIBOR +500 basis points and continues to mark down its equity position currently 40% of cost accounting for almost $30 million or $0.46 per share of unrealized losses.


Net asset value (“NAV”) per share increased by $0.14 or 0.9% (from $15.88 to $16.02) mostly due to Carbonfree Chemicals partially offset by Dynamic Product and Merx Aviation as well as overearning the dividend by almost $0.03 per share.

“During the quarter our corporate lending portfolio had a gain of $6 million or $0.09 per share. Merx had a slight loss of $1.2 million or $0.02 per share, and our non core and legacy assets had a net gain of $2 million or $0.03 per share. The net gain on non-core and legacy included a $9.8 million gain on Carbonfree, a legacy investment partially offset by losses on oil and gas and shipping.”


As discussed in previous reports, AINV restructured its first-lien loans to Carbonfree Chemicals and now owns 31% of the company. The equity portion was marked up during the recent quarter and now value at 46% of cost but needs to be watched as it could result in higher (or lower) NAV over the coming quarters. Carbonfree produces proprietary technologies that capture and reduce carbon emissions by producing chemicals such as limestone and baking soda for sale or for long term storage and could benefit from the current administration. Management discussed on the recent call:

“As a reminder, our investment in Carbonfree Chemicalsconsists of investment in the company’s proprietary carbon capture technologies and an investment in the company’s chemical plant. Carbonfree is benefiting from the strong interest in carbon capture utilization and storage. The increase in valuation is a result of a recent third party capital raise at Carbonfree.”

Previous call: “Carbonfree Chemicalswhich has some really good developments there. And that’s an all equity debt investment that had been converted to our equity. But that’s all equity and is a carbon-efficient business that has a lot of demand, obviously, where the world is going right now. And so, we hope that one over the next year can have some real significant positive things happen to it.”


Over the last few years, the company has been repositioning the portfolio into safer assets including reducing its exposure to oil & gas, unsecured debt, and CLOs. The “core strategies” portion of the portfolio remains around 92% of all investments:

“We continue to make good progress increasing our exposure to first lien floating rate corporate loans, while reducing our exposure to junior capital and non-core positions. Repayments during the quarter included the exit to second lien investments, as well as a small partial pay down from one of our shipping investments. We remain focused on reducing our exposure to the remaining non-core assets, while ensuring an optimal outcome for our shareholders.”

Its aircraft leasing through Merx Aviation remains the largest investment and remains around 13% of the portfolio and was marked down during the recent quarter as discussed on the call:

“Moving to Merx and beginning with the overall market. We are optimistic that the demand for air travel will continue to improve with the ongoing rollout of the vaccine and the lifting of travel restrictions. Additionally, we expect the aircraft leasing market will continue to be an important and growing percentage of the world fleet, as airlines will need to increasingly look to third party balance sheet to finance their operating assets. As the aircraft sector continues to recover, we have seen a notable pickup in sale leaseback transactions and in the ABS market, an important source to financing for aircraft lessors. Specific to our investment, we believe Merx has successfully navigated this challenging period. The level of lease revenue generated from our fleet has stabilized. We have worked through our exposure to airlines that have undergone restructurings. We’ve been able to remarket aircraft during this period with long term leases or sales. Our current lease maturity schedule is well staggered. Additionally, Merx continues to benefit from a growing servicing business, which has increased in value over time. We believe Merx’s portfolio compares favorably to other lessors in terms of asset, geography, age, maturity, and lessee diversification. Merx’s portfolio skewed towards the most widely used air — types of aircraft, which means demand for Merx’s fleet is anticipated to be resilient. Merx’s fleet primarily consists of narrowbody aircraft serving, both U.S. and foreign markets. At the end of June, Merx’s own portfolio consisted of 78 aircraft, 10 aircraft types, 39 lessees in 25 countries with an average aircraft age of 11.5 years, and an average lease maturity of 4.3 years. Merx’s fleet includes 75 narrowbody aircraft, two widebody aircraft and one stryder. The Apollo aviation platform will continue to seek to opportunistically deploy capital. To be clear, Merx is focused on its existing portfolio and is not seeking to materially grow its own balance sheet portfolio. However, growth in the overall Apollo aviation platform will nurture the benefit of Merx as the exclusive servicer for aircraft owned by other polyflon.”


What Can I Expect Each Week With a Paid Subscription?

Each week we provide a balance between easy to digest general information to make timely trading decisions supported by the detail in the Deep Dive Projection reports (for each BDC) for subscribers that are building larger BDC portfolios.

  • Monday Morning Update – Before the markets open each Monday morning we provide quick updates for the sector including significant events for each BDC along with upcoming earnings, reporting, and ex-dividend dates. Also, we provide a list of the best-priced opportunities along with oversold/overbought conditions, and what to look for in the coming week.
  • Deep Dive Projection Reports – Detailed reports on at least two BDCs each week prioritized by focusing on ‘buying opportunities’ as well as potential issues such as changes in portfolio credit quality and/or dividend coverage (usually related). This should help subscribers put together a shopping list ready for the next general market pullback.
  • Friday Comparison or Baby Bond Reports – A series of updates comparing expense/return ratios, leverage, Baby Bonds, portfolio mix, with discussions of impacts to dividend coverage and risk.

This information was previously made available to subscribers of Premium BDC Reports. BDCs trade within a wide range of multiples driving higher and lower yields mostly related to portfolio credit quality and dividend coverage potential (not necessarily historical coverage). This means investors need to do their due diligence before buying.
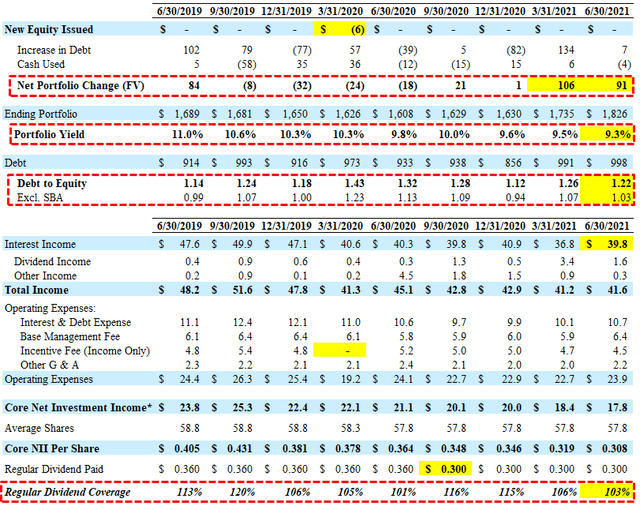
CGBD Quick Update: Buy For Higher Yield

The following information was previously provided to subscribers of Premium BDC Reports along with:

  • CGBD target prices/buying points
  • CGBD risk profile, potential credit issues, and overall rankings
  • CGBD dividend coverage projections (base, best, worst-case scenarios)


CGBD Summary

  • I have increased the target prices for CGBD to take into account continued improvement in credit quality and earnings potential likely driving quarterly supplementals of $0.05/share.
  • CGBD accounts for almost 3% of my portfolio providing investors with 70% total returns over the last 12 months.
  • Some of the reasons that CGBD remains a ‘Tier 3’ are discussed in this report including portfolio investments with a risk rating between 3 and 5 (implies downgraded) remains around 25.4% of the portfolio and non-accruals are still around 5.3% of the portfolio cost (3.3% of FV). I would like to see the company consistently earn $0.37 or more per share per quarter to cover the $0.32 regular quarterly dividend plus the $0.05 of quarterly supplemental dividends.

CGBD Dividend Coverage Update

Previous reports predicted a reduction in the regular quarterly dividend (from $0.37 to $0.32) due to lower income from its Credit Fund I, declines in portfolio yield and interest income primarily due to the decrease in LIBOR and additional loans placed on non-accrual as well as the need to reduce leverage. Similar to other BDCs, CGBD converted to a “variable distribution policy” with the objective of “paying out a majority of the excess above the $0.32 and we would anticipate doing the same going forward”.

From previous call: “Similar to last quarter, as we look forward to the rest of 2021, we remain very confident in our ability to comfortably deliver the $0.32 regular dividend, but continue the sizable supplemental dividends. In line with the $0.04 to $0.05 we have been paying the last few quarters.”

On August 3, 2021, the company announced a regular quarterly common dividend of $0.32 plus a supplemental dividend of $0.06, which are payable on October 15, 2021 to common stockholders of record on August 30, 2021. It should be noted that this was slightly above my base projected supplemental of $0.05.

“We generated net investment income of $0.38 per common share, and declared a total dividend of $0.38. This includes a base dividend of $0.32 and a $0.06 supplemental dividend in line with our policy of regularly distributing substantially all of the excess income earned over our base dividend. We see earnings continuing in the context of $0.36 to $0.37, as we’ve reported over the last several quarters, which remains comfortably in excess of our $0.32 base dividend.”


For Q2 2021, CGBD reported between its base and best-case projections covering its regular and supplemental dividends by 106% mostly due to higher-than-expected amendment and underwriting fees during the quarter. Also, there was another increase in its portfolio yield from 7.63% to 7.73%. Dividend income from its Credit Funds remained stable that currently represent around 13.9% of the total portfolio.


As mentioned in previous reports, the amount of payment-in-kind (“PIK”) interest income has been increasing and needs to be watched as it now accounts for 7.1% of interest income as compared to only 1.5% in Q1 2020.


Upcoming Share Repurchases:

On November 2, 2020, the Board authorized an extension as well as the expansion of its $150 million stock repurchase program at prices below NAV per share through November 5, 2021. The company previously repurchased around $86 million worth of shares but “paused” in Q2 2020. CGBD has reduced its debt-to-equity ratio increasing liquidity and management “intends to pursue the appropriate balance of both share repurchases and attractive new investment opportunities”.

During Q2 2021, the company repurchased 0.6 million shares at an average cost of $13.62 per share for $8.2 million resulting in accretion to NAV per share of $0.02. As of June 30, 2021, there was $39.4 million remaining under the stock repurchase program.

“We repurchased $8 million of our common stock, resulting in $0.02 of accretion to net asset value. We care deeply about our shareholders total return and at our stock’s current valuation, we’ll continue to be consistent active repurchasers of our shares.”

Management discussed on the previous call including less share repurchases if the stock price continues higher and I have taken into account with the updated projections:

“We will obviously scale those who purchases based on how accretive they are overall, and that will fluctuate as our as our stock price fluctuates. So, it shouldn’t be a surprise that we purchased a bit less this quarter. Repurchasing our shares was a bit less accretive this quarter than it had been in prior quarters. But nevertheless, again we continue to see great value in our shares. So, you should continue to see repurchases at least in the near future. And we have just as a side note, we have plenty of room and plenty of time left on our repurchase authorization that the Board gives us each year.”


Middle Market Credit Funds:

Previously, the company announced a new joint venture (“JV”) with Cliffwater to “create Middle Market Credit Fund II (“Credit Fund II”), a move that’s intended to better capitalize on senior-loan opportunities that have emerged from recent market volatility”. CGBD sold senior secured debt investments with a principal balance of $250 million to Credit Fund II in exchange for 84.13% of Credit Fund II’s membership interests and gross cash proceeds of $170 million. The new venture gives TCG BDC enhanced balance sheet flexibility, including increased capital to deploy into an attractive origination environment and additional capacity to repurchase shares.

Previously, there was a decline in income recognized from its Credit Fund I from $7.0 million in Q4 2019 to $5.5 million in Q2 2020 due to lower yields, OID, and lower leverage. During Q2 2021 ORCC recognized almost $7.5 million in income (same as previous quarter) related to the funds compared to $6.5 million in Q4 2020. Management expects the amount of dividend income to remain around $7.5 million and is taken into account with the ‘base case’ projections.

“Moving on to the performance of our 2 JVs. Total dividend income was $7.5 million in line with last quarter. On a combined basis, our dividend yield from the JVs inched up from 10% closer to a 11%. Given we’re able to make return of capital at MMCF 1 following a recent favorable amendment under our primary credit facility. Total assets at the JVs increased from $1.2 billion to $1.3 billion reversing the recent trend of declines that have been driven by repayment headwinds. This was particularly evident in the MMCF 1 portfolio with fair value increasing by over 10% in the second quarter. Going forward, we continue to expect stable dividend generation from the 2 JVs similar to this quarter’s results.”

As of June 30, 2021, CGBD had cash and cash equivalents of around $59 million and almost $323 million available for additional borrowings under its revolving credit facilities. Management is targeting a debt-to-equity ratio between 1.00 and 1.40 including the recently issued preferred equity and is taken into account with the projections.

“We continue to be very well positioned with the right side of our balance sheet. Statutory leverage was again stable at about 1.2x, while net financial leverage, which as soon as the preferred is converted in a risk metric we used to manage the business was again right around one turn of leverage. So we’re sitting close to the lower end of our target range of 1.00x to 1.40x giving us flexibility to invest prudently in the current robust field environment.”

In May 2020, the company issued $50 million in Series A Convertible Preferred Stock, purchased by an affiliate of The Carlyle Group, Inc. with the proceeds used to pay down outstanding debt. The Series A Convertible Preferred Stock pays dividends, at the Company’s option, at a rate of either 7% (to the extent paid in cash) or 9% (to the extent paid in kind) and is convertible into common shares at an implied conversion price of $9.50, or 57% above the current 30-day VWAP. This transaction improved the overall capitalization/liquidity but with a dilutive impact to current shareholders. Management continues to mention that “there is no intention to convert” into common shares:

Recent call: “And regarding the preferred equity issuance for May 2020. I’ll reiterate again, this instrument was a strong sign of support by Carlyle during the darkest days of the global pandemic. And it continues to be a long-term investment by Carlyle in our BDC. So currently, there is no intention to convert.”

Previous call: “And regarding the preferred equity issuance for May of 2020, our stock is now trading well above the conversion price. But as we’ve noted previously, this instrument remains a long-term investment by Carlyle in our BDC. So there currently is no intention to convert.”

Also discussed on the recent call was potentially refinancing the preferred stock especially given the current market for unsecured debt with many of the larger BDCs borrowing between 2% to 3% compared to the 7% currently being paid. I fully agree but management perceives this as “permanent equity” capital and provides the company with increased financial flexibility”:

Q. “You guys have been able to issue liability, unsecured notes recently at 4.5%. I wouldn’t be surprised if you could do something less than that in today’s market. So why is paying 7% cash on a convertible preferred, an attractive source of financing when you’re able to tap unsecured notes at 4.5% and then depending on your answer that we can get into converting that, what does that look like? How does that look like from a manager converting at a sizable discount, the external manager converting and having and making a sizable profit from supporting the BDC, I don’t know if that’s a great look either, but I just don’t understand that comment why paying 7% is attractive source when you guys are issuing debt for significantly below that.”

A. “So just to kind of reiterate if you recall, when we put the convert in place, life was pretty dire, right our stock price was half of what it is today, we’re in the middle of the pandemic, we’re looking at really how to make sure our balance sheet was strong and defensible during a time that was – just an enormous amount of uncertainty. And Carlyle coming in and doing the preferred was a really great testament not only to their support of our business, but also to just really help us achieve the goals that we wanted to achieve at that point in time. So, I’d like really people to kind of just put all of this in context. For Carlyle, it’s a great show support, but let’s not forget it, it is $50 million for Carlyle, and it’s $50 million for our balance sheets. So it’s relatively small, and Carlyle, this is strategic right they’re not looking to convert this anytime soon, it’s here to support the business, and we really look at this as equity. So, compared to our dividend yield on our common stock, this is paying 7%, which is we think, actually a pretty attractive piece of equity for our balance sheet. And converting it is just not really in the cards. So I would just encourage people to think of this really as permanent equity, which you may view as expensive, but we actually view as pretty, pretty cheap. And know that this is not something that is going to dilute our current shareholders really in the foreseeable future that that we can tell. So and we’re pretty conscious of that, when back when we issued this, we didn’t want to dilute shareholders especially back in the Spring of 2020 and that’s still our view now, there’s no reason to dilute current shareholders, not when Carlyle is standing behind the business like it is. We have the financial flexibility, effectively equity, we manage the business as if it’s equity, we get credit under our leverage facilities as if it’s equity. So certainly from the financial flexibility perspective, we think it’s well priced equity. So managing the business would mean we have to have this in the capital structure, we would have better capital structure.”

CGBD has an average fee structure of 1.50% base management fee (compared to 1.00% to 2.00%) and an incentive fee of 17.5% (compared to the standard 20.0%) but is not best-of-breed as it does not include a ‘total return hurdle’ to take into account capital losses when calculating the income incentive fees. This was discussed on the recent call:

Q. “I agree that life was pretty dire when the parents stepped up in during COVID. But it was also rather bright and sunny in 2018 when the BDC lost a lot of money and was paying the parent a full incentive fee. So I guess the question is, against your opening remarks about caring deeply about the shareholders total return. Do you perhaps care more deeply about the advisor or should something give – like, should there be sort of pick one between the convert and not having a credit look back?”

A. “We do believe that Carlyle, Carlyle has a very fair and balanced management fee structure. We think that in the shareholders are getting a lot of value for that. Keep in mind that, we do manage the JVs and don’t take a fee for that. So sometimes, I think that gets a little bit lost when people look at our overall fee structure. So we’re kind of getting the management the JVs at a very nice discount on the management fee. So our management fee and not having a look back, I’m not really sure that that is what is going to be driving our stock price higher, it’s really, we’ve got to continue on this straightforward consistent performance get our non-accruals down, which is looking better and better. And really keep our shareholders satisfied by knowing that we can generate our dividends, perform well on credits. And ultimately, we think that will get our stock price up. I’m not sure our management fee is really the issue.”


CGBD Quick Risk Profile

Non-accrual investments remain around 3.3% of the portfolio fair value as there have been no investments added over the last four quarters. If these investments were completely written off it would have an impact of around $1.14 to its net asset value (“NAV”) per share or around 7.1%.

“We have seen no new non-accruals in the last year and we’re confident in the trajectory and progress we’re making in each of our four non-accrual names. We’re proud of the performance of the portfolio through COVID. And most importantly, we see the current trajectory of improving performance and solid credit continuing on its current upward path. Total non-accruals were flat at 3.3% based on fair value, and this was the fourth consecutive quarter with no new additional non-accruals. Similar to last quarter, we don’t see any additional loans at risk of non-accrual.”


It should be noted that Direct Travel and Product Quest currently have a risk ranking of 4 compared to Derm Growth Partners and SolAero with a lower risk ranking of 5 and have been discussed in previous reports.

Risk Rating 4 – Borrower is operating materially below expectations and the loan’s risk has increased materially since origination. In addition to the borrower being generally out of compliance with debt covenants, loan payments may be past due, but generally not by more than 120 days. It is anticipated that we may not recoup our initial cost basis and may realize a loss of our initial cost basis upon exit.

Risk Rating 5 – Borrower is operating substantially below expectations and the loan’s risk has increased substantially since origination. Most or all of the debt covenants are out of compliance and payments are substantially delinquent. It is anticipated that we will not recoup our initial cost basis and may realize a substantial loss of our initial cost basis upon exit.

CGBD previously had 6 categories of risk ratings and basically combined the previous rating 3 and 4 that accounted for 16.7% of the portfolio as of Q1 2020 into the new rating 3 which is now 21.4% and needs to be watched. However, the total amount of investments with risk rating between 3 and 5 (which implies that these investments have been downgraded) declined from 26.8% (as of Q1 2021) to 25.4% (as of Q2 2021) of the portfolio but is still considered high and is one of the reasons that CGBD remains a ‘Tier 3’ BDC as discussed earlier.

“The total fair value of transactions risk rated 3 to 5, indicating some level of downgrade since we made the investment improved again this quarter by $14 million in the aggregate. While over $15 million in transactions experienced some level of upgrade. While there remain some unfinished work, we’re very pleased with the continued positive momentum and the performance of the overall portfolio.”


SolAero was marked slightly lower again in Q2 2021 (now valued at 20% of cost) and was discussed on the previous call:

From previous call: “So on SolAero that’s a deal we actually restructured about a year and a half ago, that had just fundamental issues based on the industry solid industry. It’s highly typical, and you’re exactly right, that this is had some issues based on its ties to one web that’s one that we are in the equity see in that transaction and it’s one that we see a positive resolution going forward or at least we’re in negotiations and hoping to have positive resolution in terms of that company, turning the corner and working with their top customer one web as one way emergence from their bankruptcy. Direct Travel probably one of, if not the most severely COVID impacted name on our book and that was the other transaction I noted, we had two deals that restructured that deal also restructured in early October timeframe and the lenders again supporting that business and are the majority owners going forward it providing the capital for that, for that business. I will say is each all four of those situations what I’d highlight is we are the original debt and existing debt is in the first lien position in each case. In three cases the lenders are there now all in the equity or we anticipate will own the equity. So we think we’re in a good position based on our seniority and based on our equity position to drive strong outcomes in recoveries in those situations.”

As discussed in previous reports, U.S. Dermatology Partners defaulted on a $377 million financing provided by a group of investment firms. The Washington Post previously reported that the company may have received financing from the Paycheck Protection Program. The dermatology practice owner was reviewing its options, including a recapitalization or debt-for-equity swap with its current lenders, Golub Capital, The Carlyle Group Inc. and Ares Management. CGBD’s investment in Derm Growth Partners (Dermatology Associates) was added to non-accrual status during Q4 2019. This investment will likely be restructured over “the next couple of quarters”.

From previous call: “Dermatology Associates is one we have been engaged and we remain engaged and we anticipate a similar resolution on that transaction or that current capital structure within, let’s call it the next couple of quarters.”

Also mentioned in previous reports, Direct Travel completed a restructuring whereby the lenders received the majority of the equity in Direct Travel but maintained the principal balance in the existing debt. As part of the transaction, the lenders also provided a delayed draw term loan facility to support ongoing liquidity of the business, CGBD received an approximate 9% ownership stake in Direct Travel and the debt remains on non-accrual.

From previous call: “You’ll see in the cases of Direct Travel and Central Security that we closed successful restructurings and now hold both debt and equity instruments. In both cases, we think with lenders now holding majority of the equity, we’re better positioned to achieve superior recoveries.”

During Q2 2021, CGBD’s net asset value (“NAV”) increased by another $0.44 or 2.8% mostly due to net unrealized appreciation of $0.39 per share driven by “stronger overall credit performance, particularly in those names impacted by COVID” including Derm Growth Partners and Direct Travel as well as accretive share repurchases adding $0.02 per share.

“Net asset value per share increased 2.8% or $0.44 from $15.70 to $16.14 while improving market yields drove some of this increase, NAV was substantially bolstered by stronger overall credit performance, particularly in those names impacted by COVID. We’ve taken an appropriately conservative approach to valuation through this cycle and we expect continued underlying fundamental improvement to drive positive NAV migration in the coming quarters. Additionally, we repurchased $8 million of our common stock, resulting in $0.02 of accretion to net asset value.”

“On evaluations our total aggregate realized and unrealized net gain was $21 million for the quarter. The fifth consecutive quarter of positive performance following the drop in March 2020. Using the same buckets I’ve outlined in prior quarters, we again saw improvement across the board. First, performing lower COVID-impacted names plus our equity investments in the JVs, which accounts for combined 70% of the portfolio increased in value about $8 million compared to 3/31. Second, the assets that have been underperforming pre-pandemic, so which have COVID exposure were up $4 million, marking the fifth consecutive quarter of stability or improvement. This included in exit at par of our investment in Plano Molding. The final category is the moderate to heavier COVID-impacted gains. We continue to see improvement in fundamentals and recovery prospects for these investments. Collectively they experienced a net $9 million increase in value.”
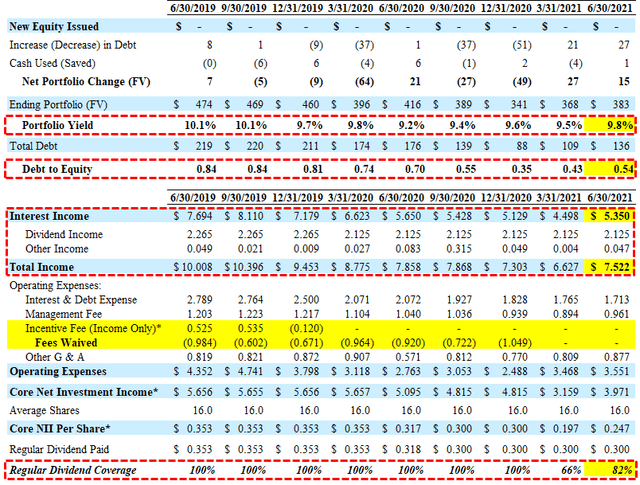

Full BDC Reports

This information was previously made available to subscribers of Premium BDC Reports. BDCs trade within a wide range of multiples driving higher and lower yields mostly related to portfolio credit quality and dividend coverage potential (not necessarily historical coverage). This means investors need to do their due diligence before buying.