The following information was previously provided to subscribers of Premium BDC Reports along with target prices, dividend coverage and risk profile rankings, earnings/dividend projections, quality of management, fee agreements, and my personal positions for all Business Development Companies (“BDCs”).

As discussed last month in “This High-Yield Sector Continues To Pummel REITs“, Business Development Companies (“BDCs”) have easily outperformed Real Estate Investment Trusts (“REITs”) and are starting to get some “respect” for the reasons discussed in previous articles (see list below) including minimal investments in cyclical sectors (discussed below), stronger credit performance than many private equity/debt funds and even many banks during recessionary periods, maintaining and often improving dividend coverage while others are cutting.
BDC pricing (multiples and yields) continues to head back to levels from early 2014 before the S&P and Russell removed BDCs from their indexes due to concerns cited by the indexes, including the distortion of expense ratios driven by AFFE rules. This was predicted and discussed last year in “New SEC Rules Could Improve Pricing For The BDC Sector“.
Introduction to Business Development Companies (“BDCs”)
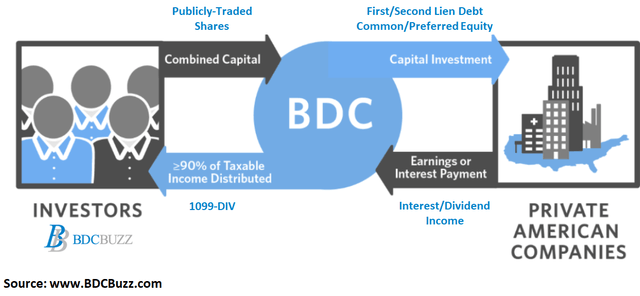
Similar to REITs, Business Development Companies (“BDCs”) are regulated investment companies (“RICs”) required to pay at least 90% of their annual taxable income to shareholders, avoiding corporate income taxes before distributing to shareholders. This structure prioritizes income to shareholders (over capital appreciation), driving higher annual dividend yields that mostly range from around 6% to 10%.
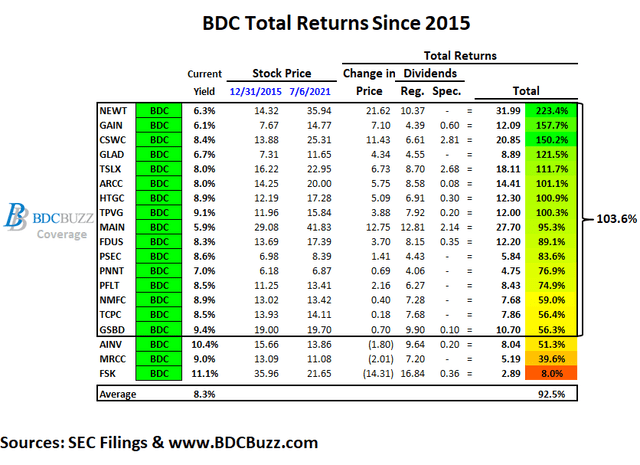
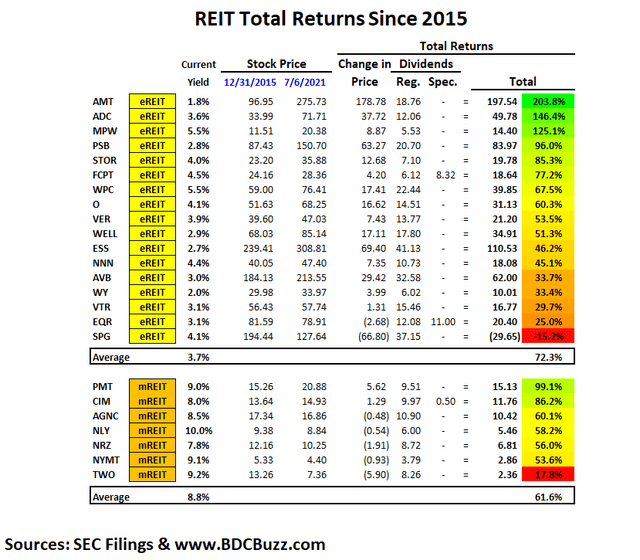
Comparison or BDC and REIT Returns Since 2015
- It should be noted that the BDC sector is relatively new and many of the best BDCs have not been publicly traded for longer than 10 years.
As mentioned in the article linked above, BDCs have easily outperformed REITs over the last 18 months but the following tables show the comparable total returns since 2015 which takes into account 2 major pullbacks in BDC pricing (2018 and 2020).
The following tables assume that you purchased each position at the close of Dec. 31, 2015, and sold at the close of July 6, 2021, collecting (not reinvesting) the dividends (includes paid, accrued, specials, and supplementals). Please see the end of this article for my takeaways from these tables.
I have included many of the BDCs that I cover as well as some others along with many of the larger/popular equity and mortgage REITs. The top performers were predicted/discussed in previous articles including:
- Newtek Business Services: Initiating Coverage
- Stocking Stuffer Or Sell The Recent Rally: GAIN
- Growing Dividends During A Pandemic: CSWC
- Top BDC Pick For 2020: TSLX
- ARCC: 9.4% Yield, Provides Preliminary Results
- Venture Debt Players Yielding 9% To 10% For Your Portfolio: HTGC/TPVG
- MAIN: New SEC Rules Could Improve Pricing For The BDC Sector
- I Bought FDUS: 12% Yield And 35% Below Book
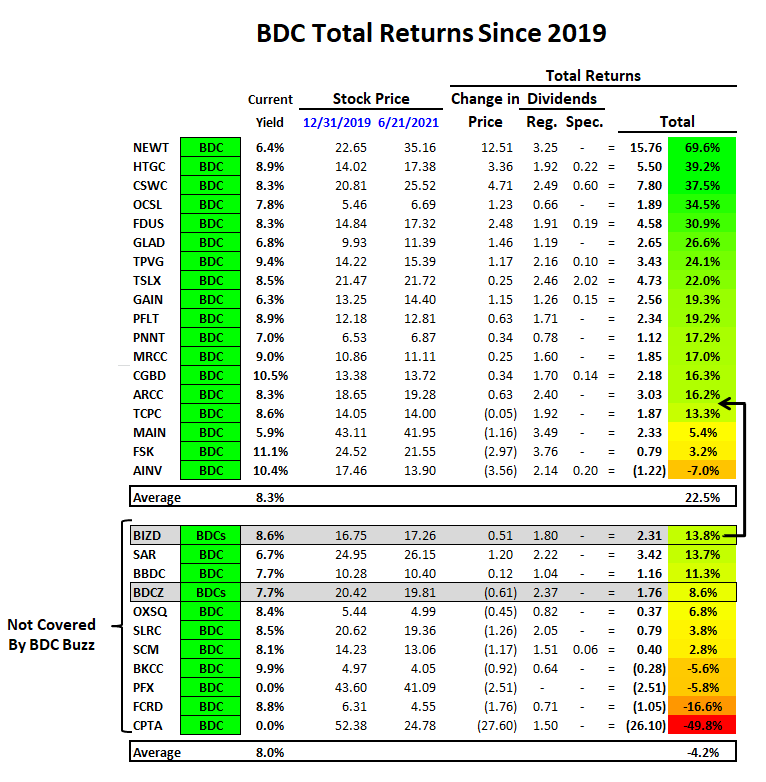
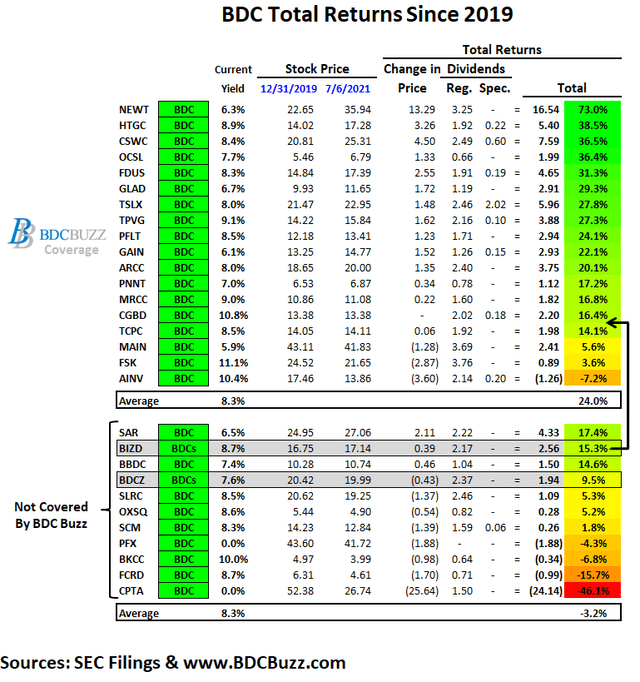
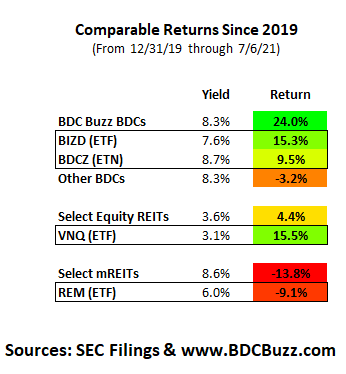
Comparison or BDC and REIT Returns Since 2019
The following tables show the updated returns over the last 18 months including VanEck Vectors BDC Income ETF (BIZD) and WF BDC Index ETN (BDCZ) which continually underperform the average for the reasons discussed in “ETFs Are The Worst Way To Invest In This High-Yield Sector“.
I do cover some of the lower return BDCs including AINV due to being one of the ‘older’ BDCs and FSK only due to being one of the largest in the sector especially after taking into account the merger with FSKR. It should be noted that BDCZ has quite a bit of exposure to many of the lower-performing BDCs including FSK and FSKR that accounted for more than 15.5%.
The “Other BDCs” include many of the lower performing companies that I do not actively cover including SLRC, SCM, OXSQ, BBDC, HCAP, PFX, BKCC, FCRD, and SAR. It should be noted that all of these BDCs with the exception of SAR and BBDC have not reached their pre-COVID stock price levels similar to AINV and FSK partially responsible for the lower returns. Also, most of these BDCs have cut their dividends and will be discussed in the next article.
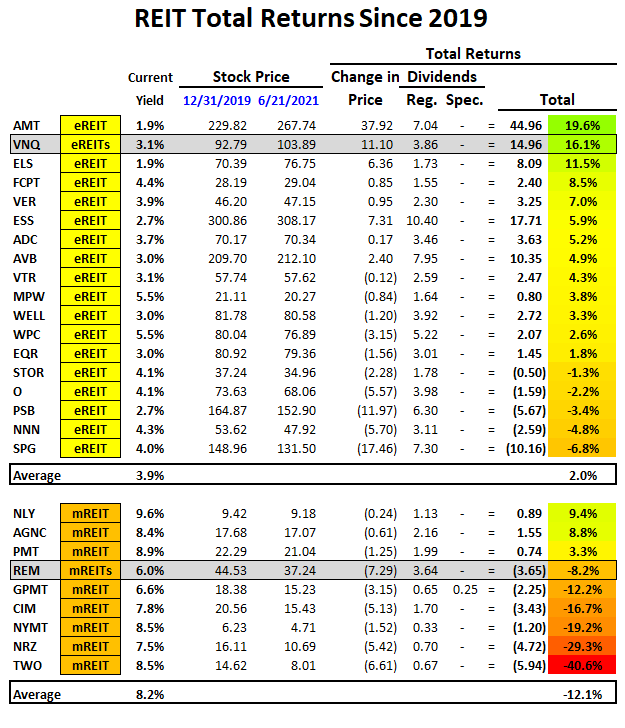
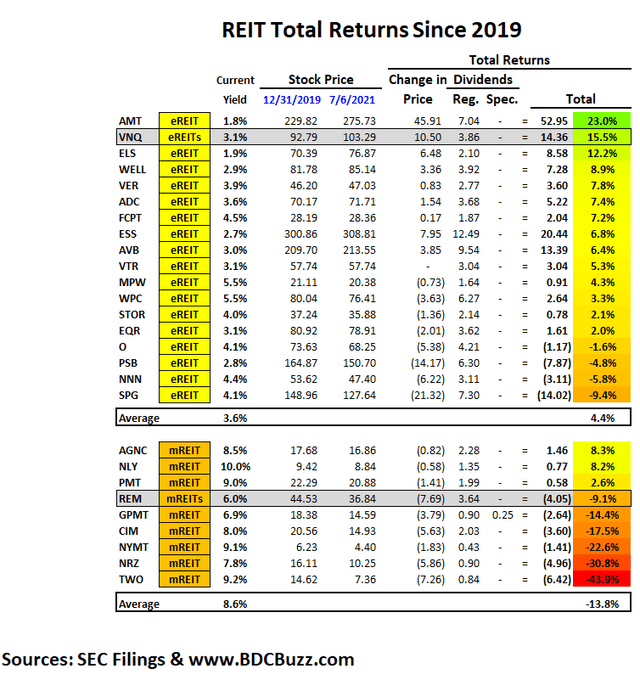
The following tables show the comparable REIT returns including the Vanguard Real Estate Index Fund (VNQ) and a Mortgage REIT Index (REM) which have outperformed many/most of the larger REIT components. As mentioned in previous articles, I only invest in VNQ (during market pullbacks) for my REIT allocation which has easily outperformed many of its components including AVB, ESS, EQR, SPG, ADC, WPC, FCPT, O, NNN, STOR, and PSB.
Why do REITs Underperform BDCs?
Upcoming articles will discuss many of the reasons that the average REIT underperforms the BDC sector including return on equity (“ROE”) measures and dividends/distributions paid to shareholders and some simple fundamentals including changes in net asset/book values.
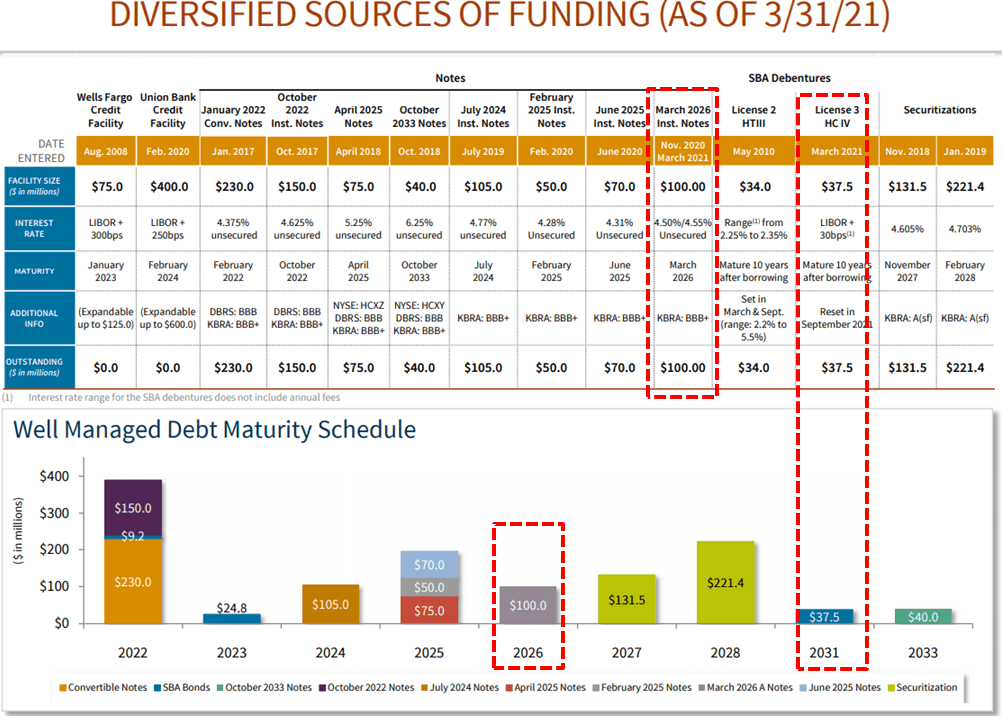
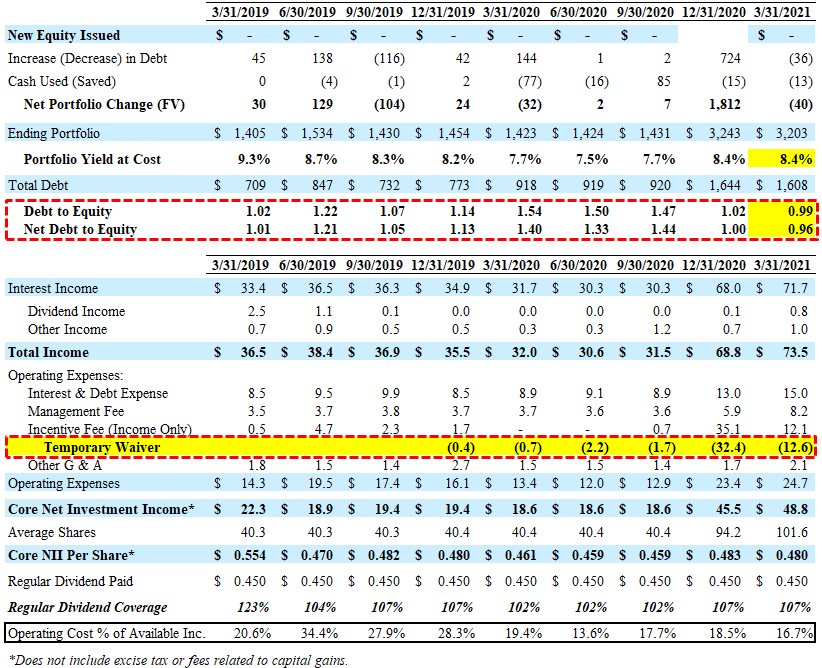
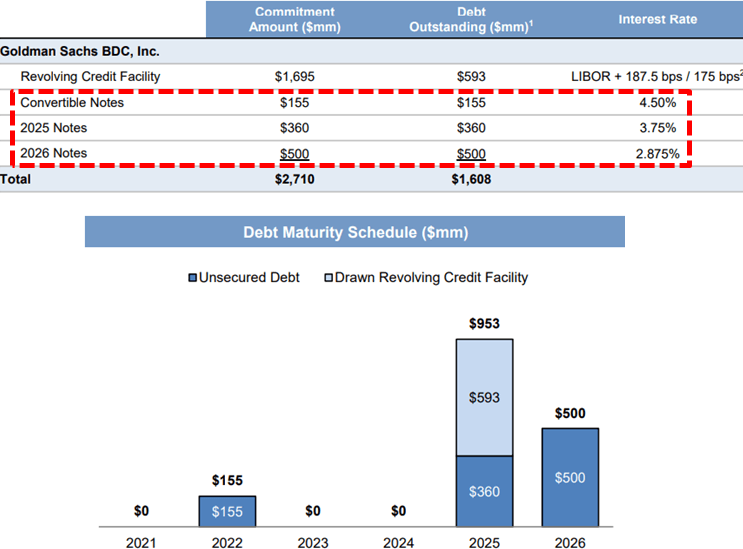
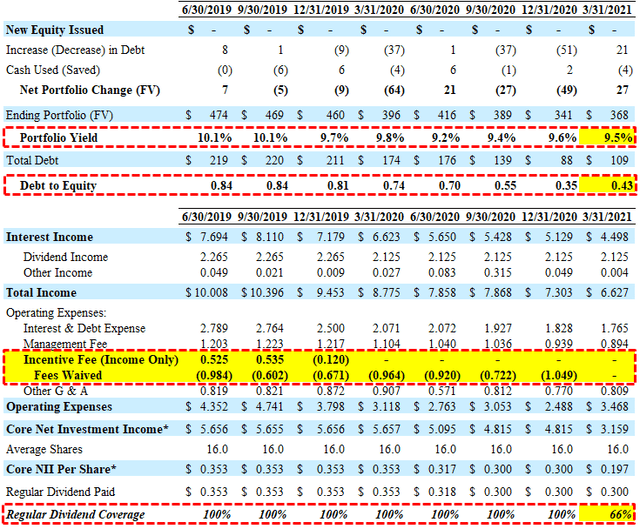
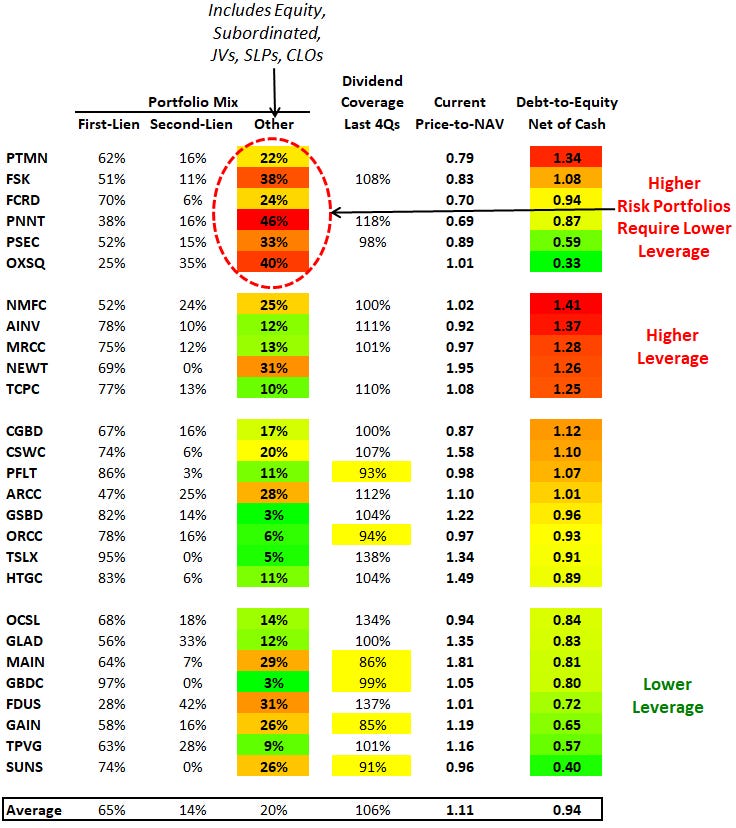
It should be noted that most BDCs continue to position their portfolios away from cyclical sectors and into growth, technology, defensive sectors that will continue to do well over the coming quarters. Also, almost every BDC used the recent pandemic to strengthen their balance sheets with longer-term unsecured borrowings at extremely low fixed rates. These changes have resulted in much stronger balance sheets ready for anything from an economic recession to an overheated economy driving higher interest rates.
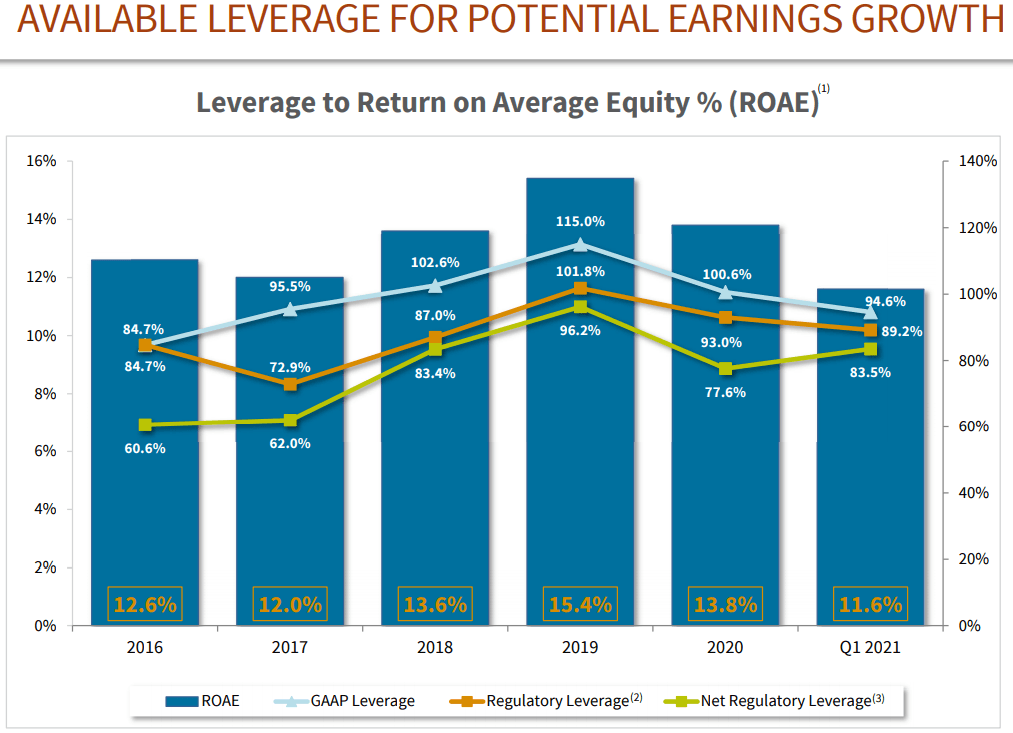
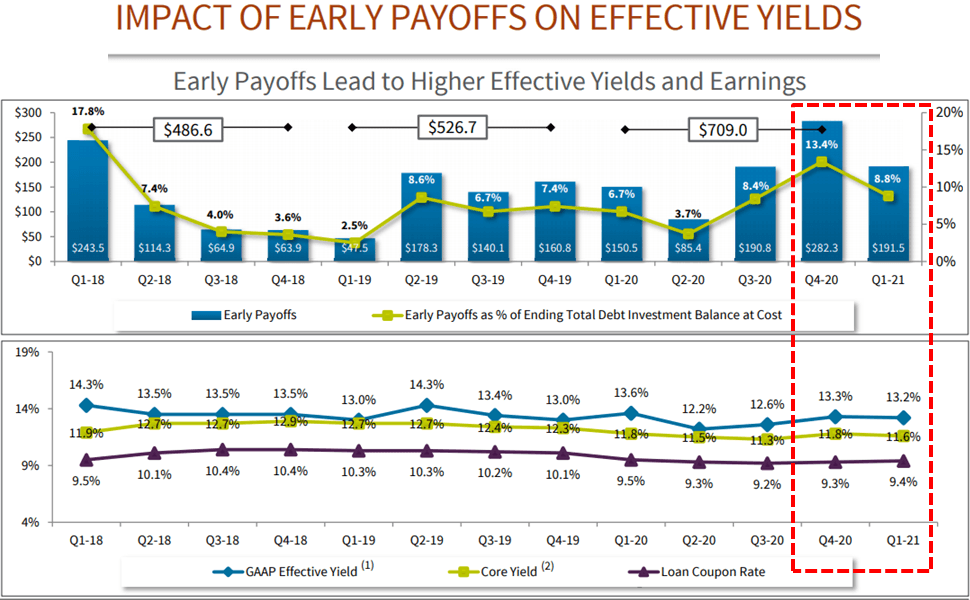
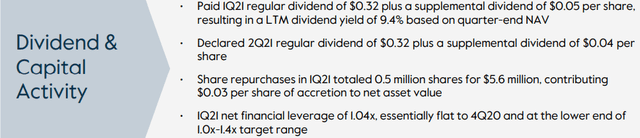
Source: ARCC Debt Investor Presentation
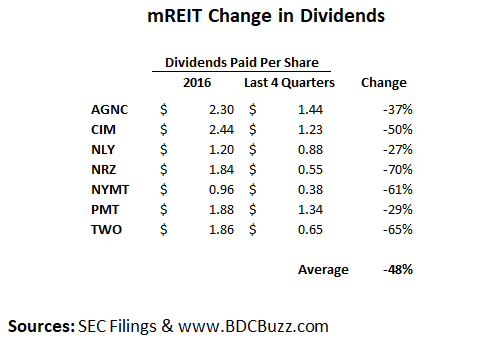
I will likely not spend much time on mortgage REITs as I do not see these as long-term holding positions. The following table shows the change in mortgage REIT distributions for the companies listed in the previous tables (excluding GPMT which became publicly traded in 2017) showing an average decline of almost 50%:
Also, I will discuss portfolio allocations for BDCs and REITs, total return comparisons between additional (smaller and less known) BDCs and REITs, other considerations including risk and pricing volatility. Again, the BDC sector is relatively new and many of the best BDCs have not been publicly traded for longer than 10 years but I will provide comparisons of some of the older BDCs in upcoming articles.
Summary & Takeaways
The following table includes the return comparisons from the previous tables with some quick takeaways below that will also be discussed in upcoming articles.
What is the best way for yield-oriented investors to maximize their returns over the long term while earning solid dividends?
- Adjust portfolio allocations including higher amounts of BDCs compared to REITs as they have been outperforming over the long and short term.
- For your REIT allocation please use VNQ which outperforms the average but with a lower yield. VNQ has much better diversification than BIZD/BDCZ.
- If you are investing for higher total returns especially in a rising rate and/or inflationary environment it’s likely better to invest in higher quality BDCs.
- If you are investing mostly for higher yield it’s better to use a typical/average BDC vs. mREITs.
- For the same amount of income with less risk, it’s better to invest 50% less capital in BDCs at 8.3% compared to equity REITs at 3.1% to 3.6%.
- Do not use BIZD or BDCZ to invest in the BDC sector as they continually underperformed the average BDC. You could pick five random BDCs and easily have higher returns and likely higher yield due to fees.
- Mortgage REITs are likely not good long-term holdings but can provide higher yields and returns if traded correctly. REM is lower yield but could also reduce the risk for that sector.
- Investors can easily make higher returns by taking advantage of pricing volatility.
Full BDC Reports
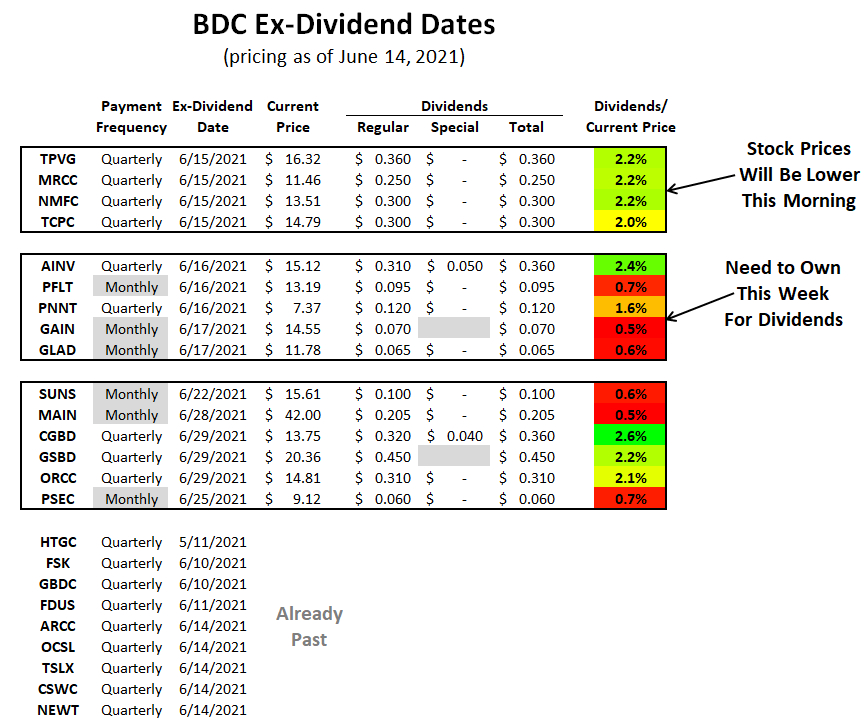
- Weekly BDC Sector Update – Before the markets open Monday morning we provide quick updates for the sector including significant events for each of the companies that we follow along with upcoming earnings, reporting, and ex-dividend dates. Also, we provide a list of the best-priced opportunities along with oversold/overbought conditions, what to look for in the coming week, and any other meaningful economic events that need to be considered for the sector.
- Deep Dive Projection Reports – Detailed reports on 2 to 3 BDCs per week prioritized by first focusing on potential issues such as dividend coverage and/or portfolio credit quality changes. We look for portfolio updates that might be mentioned in the SEC filings as compared to company announcements. Then, reports are prioritized based on pricing opportunities including equity offerings.
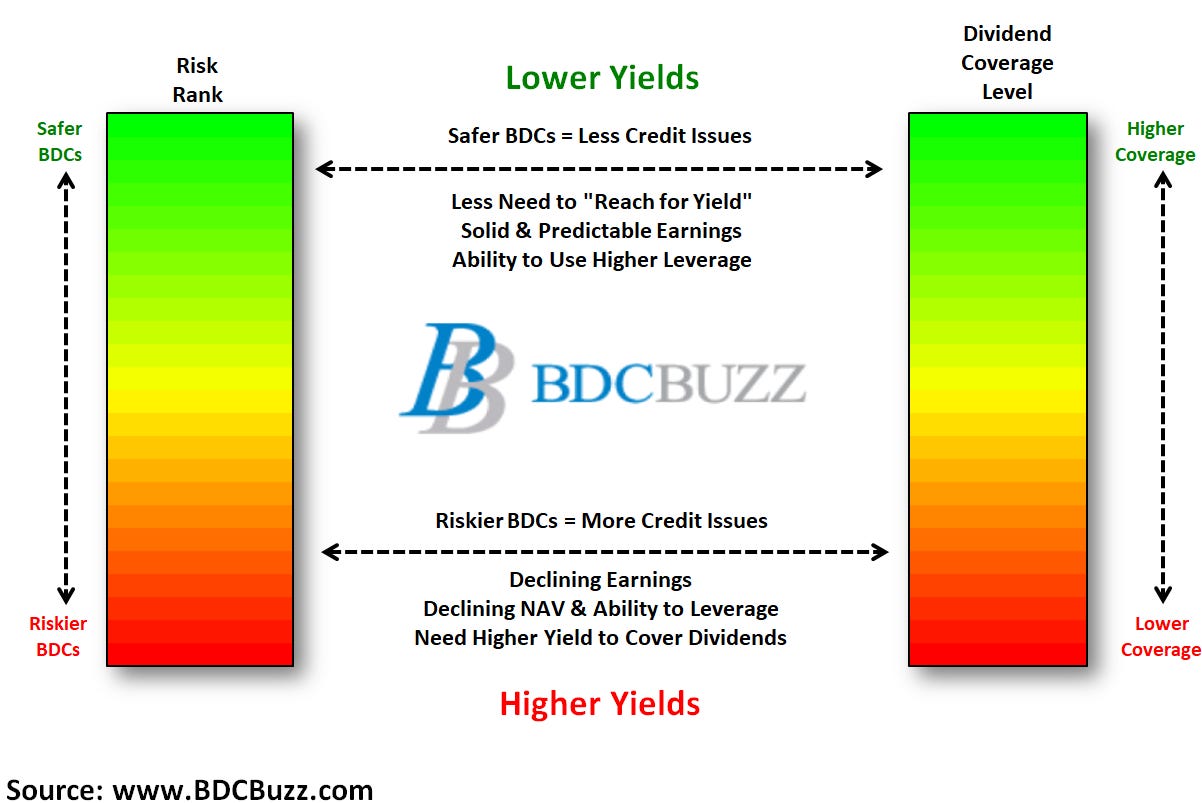
This information was previously made available to subscribers of Premium BDC Reports. BDCs trade within a wide range of multiples driving higher and lower yields mostly related to portfolio credit quality and dividend coverage potential (not necessarily historical coverage). This means investors need to do their due diligence before buying.