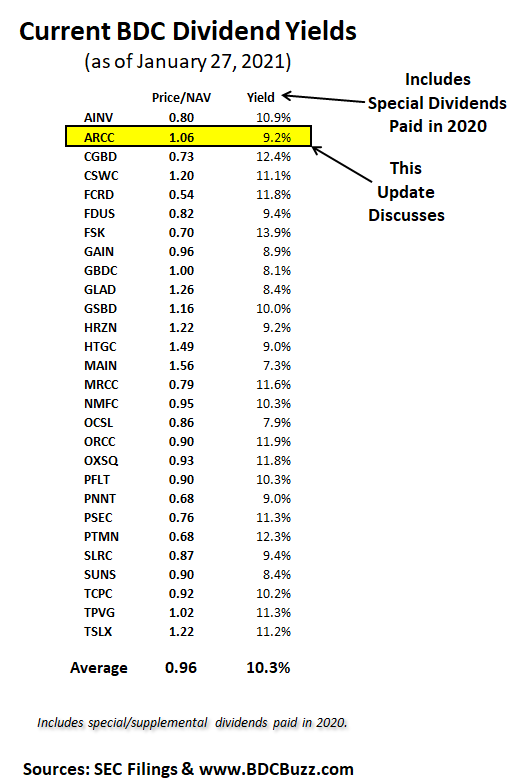
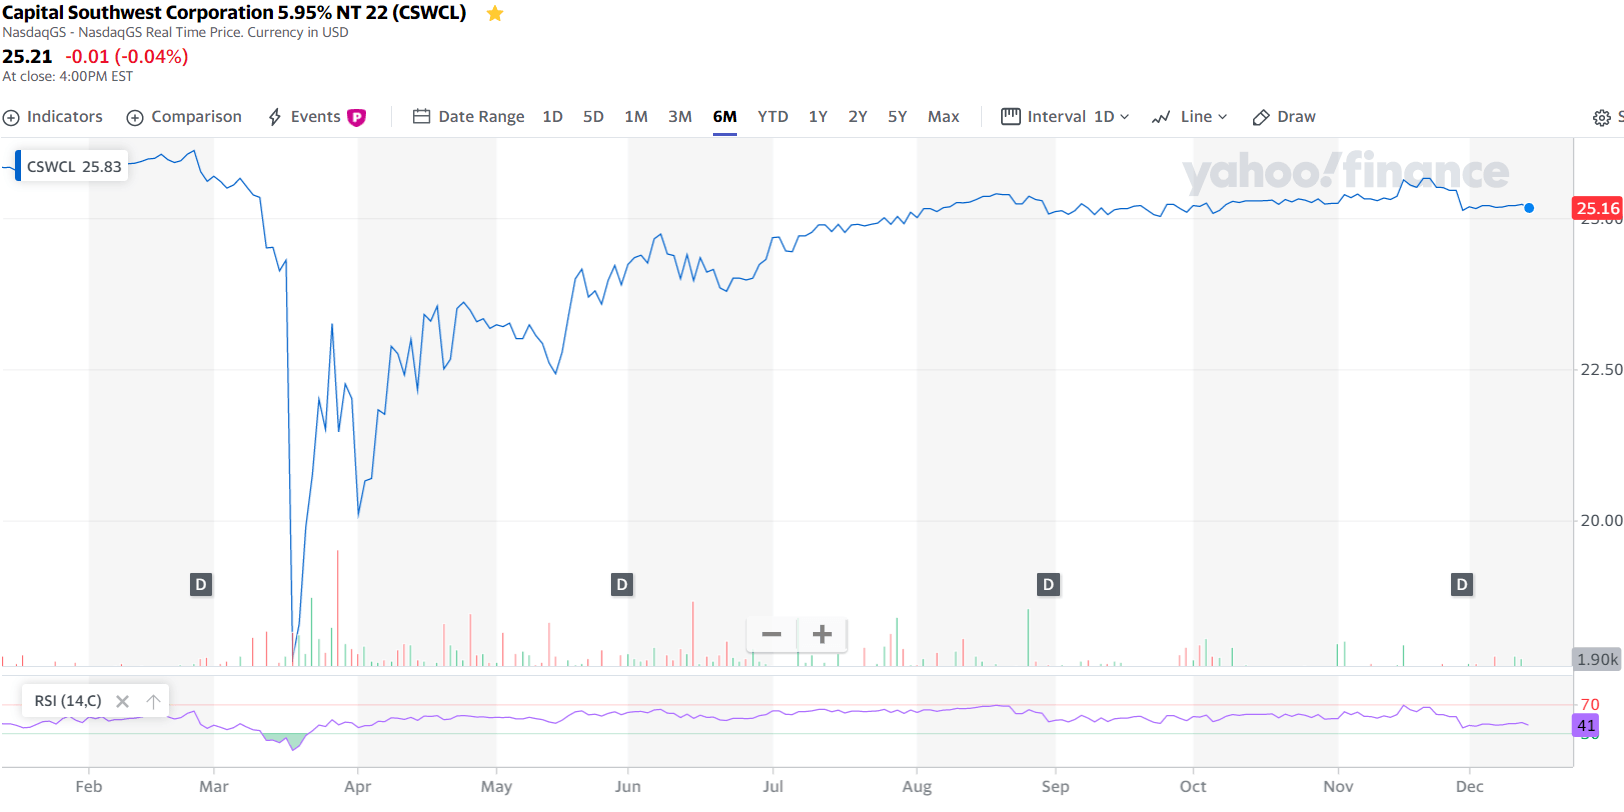
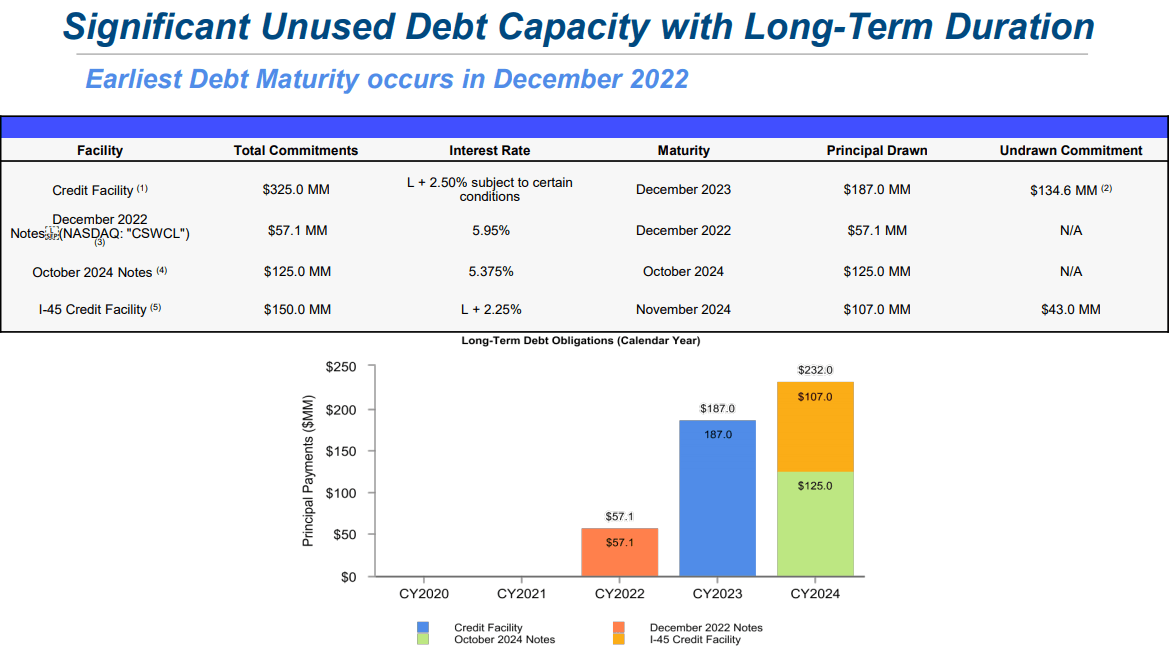
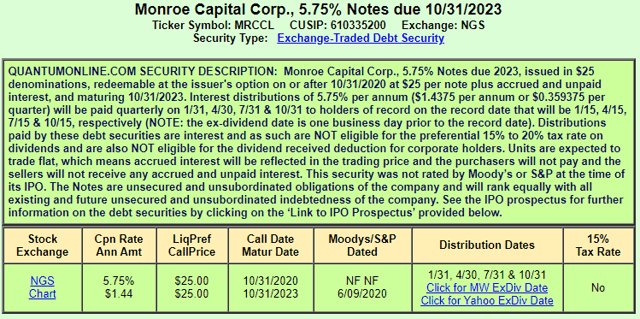
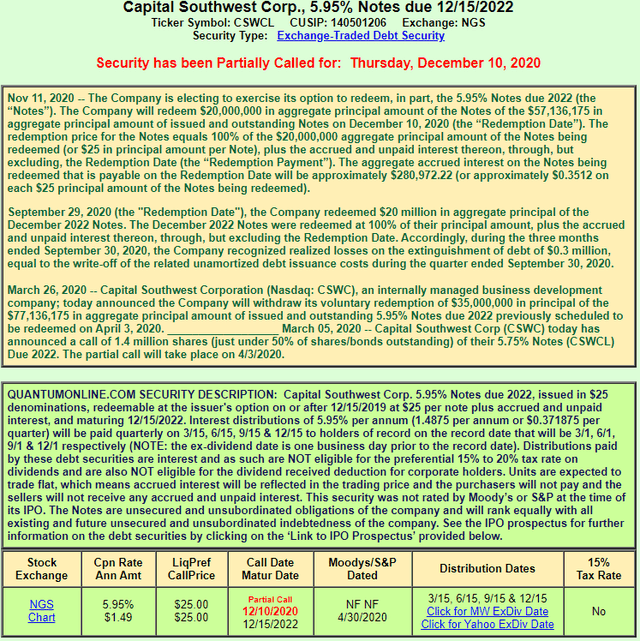
Capital Southwest 5.95% Notes due 12/15/2022 (CSWCL)
On November 5, 2020, CSWC announced the partial redemption (another $20 million) of its 5.95% Notes due 2022 (CUSIP No. 140501206; NASDAQ: CSWCL) on December 10, 2020.
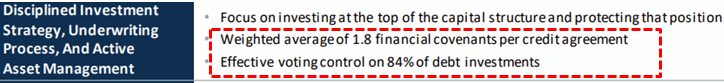
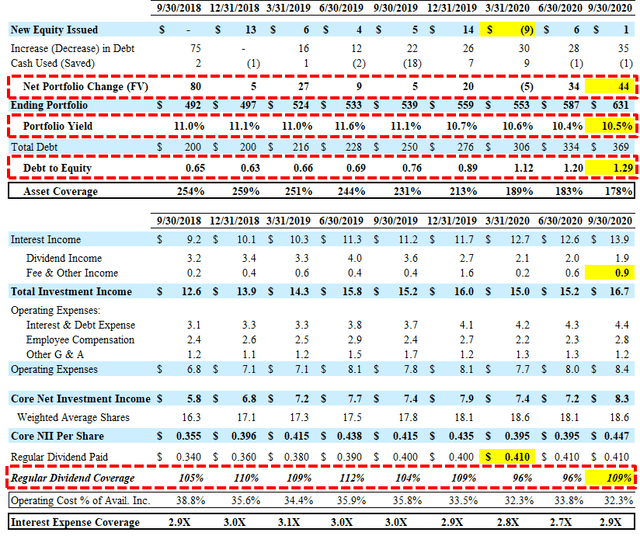
The “Bond Risk” tab of the BDC Google Sheets includes a summary of metrics used to analyze the safety of a debt position such as the “Interest Expense Coverage” ratio which is used to see how well a firm can pay the interest on outstanding debt. Also called the times-interest-earned ratio, this ratio is used by creditors and prospective lenders to assess the risk of lending capital to a firm. A higher coverage ratio is better, although the ideal ratio may vary by industry. When a company’s interest coverage ratio is only 1.5 or lower, its ability to meet interest expenses may be questionable.
The asset coverage ratio is a financial metric that measures how well a company can repay its debts by selling or liquidating its assets. The higher the asset coverage ratio, the more times a company can cover its debt. Therefore, a company with a high asset coverage ratio is considered to be less risky than a company with a low asset coverage ratio.
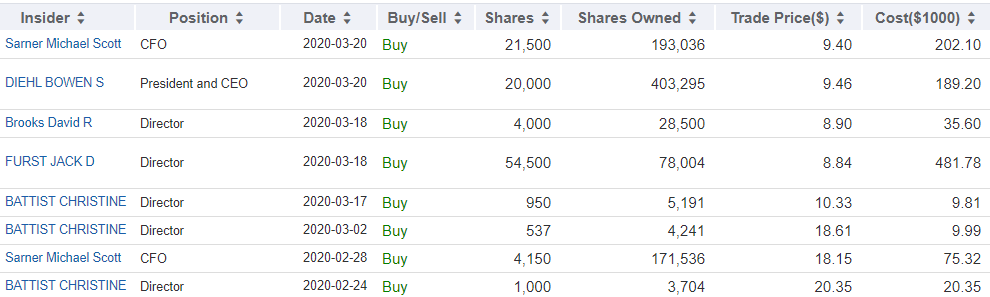
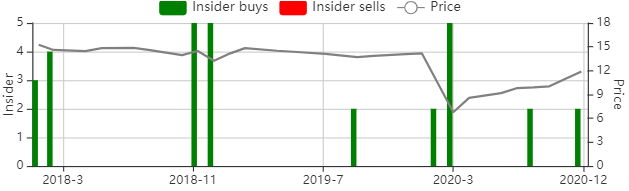
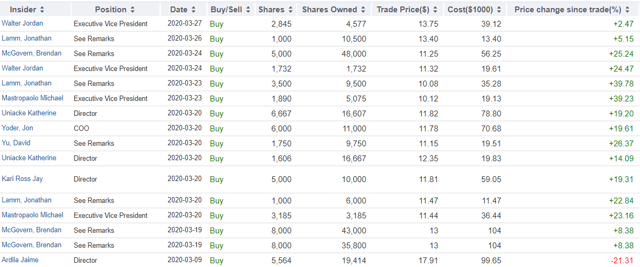
Previous CSWC Insider Purchases
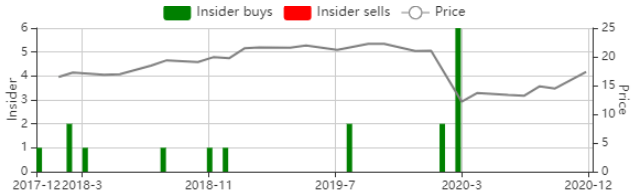
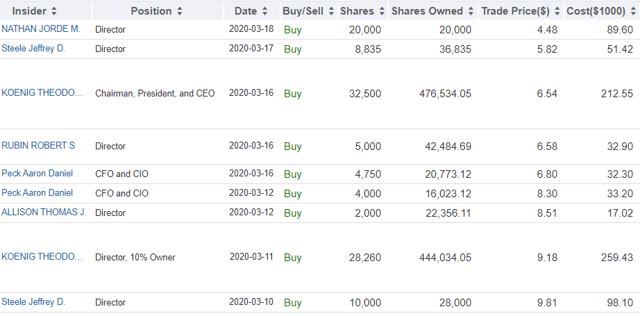
From previous call: “As a further demonstration of our confidence and shareholder alignment, our directors and officers purchased approximately 107,000 shares of CSWC stock during the quarter, bringing the group’s total ownership in Capital Southwest to approximately 10% of the outstanding common stock.”

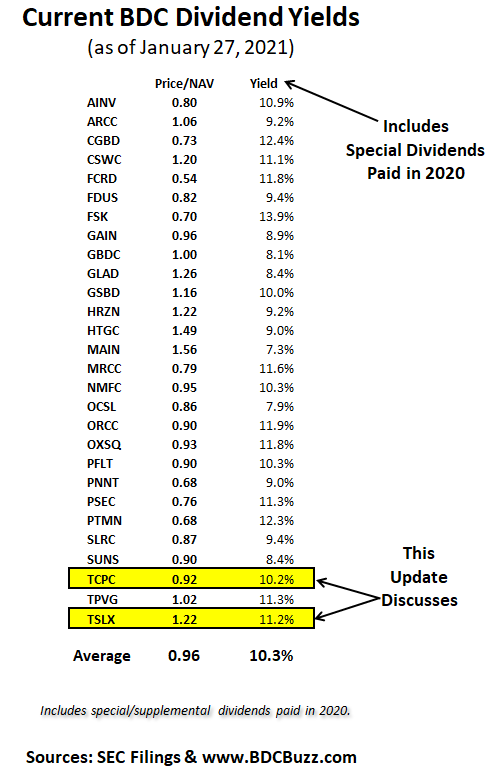
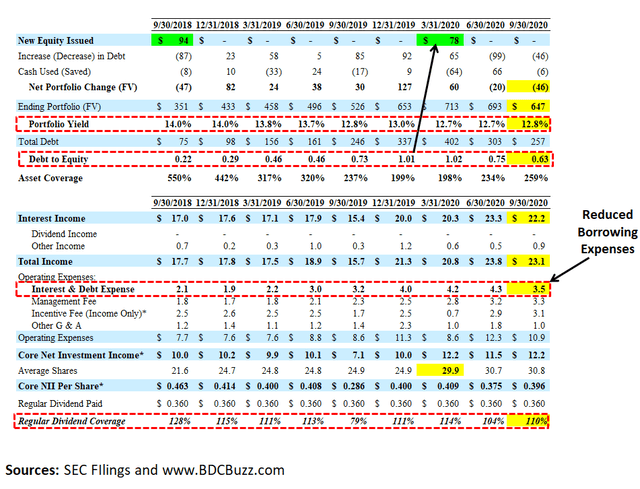
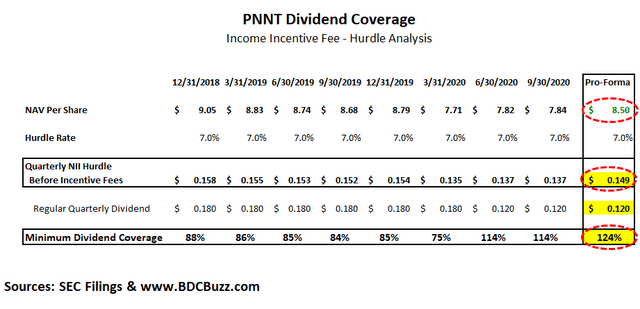
CSWC Dividend Coverage Update
“I think we do have an eye on growing the regular dividend over time, based on origination to date and sort of this transition to the five points — getting away from those unsecured bonds, we think our run rate in the next quarter or two is going to be in the $0.42 to $0.43 in terms of NII. When we feel comfortable there, we’ll probably inch up the dividend in turn. When we make the full transition out of those notes, and we start drawing on the revolver next year, we see quite a bit of an increase in NII. To quantify it long term, I think I’ve said this on the last call and once we have fully immersed in the FDIC, fully deployed, we see that’s a 20% to 25% increase relative to using bonds in the next two to three years. So we’re definitely looking ahead towards increasing that dividend slowly and steadily.”
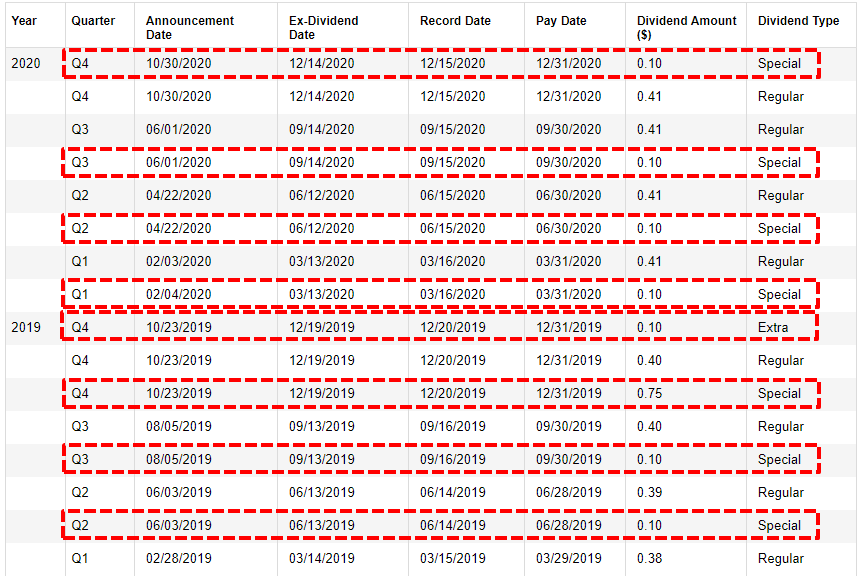
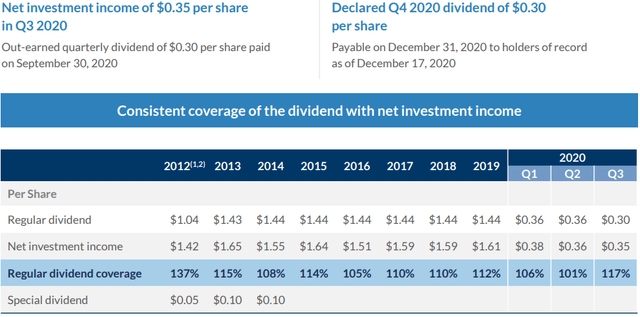
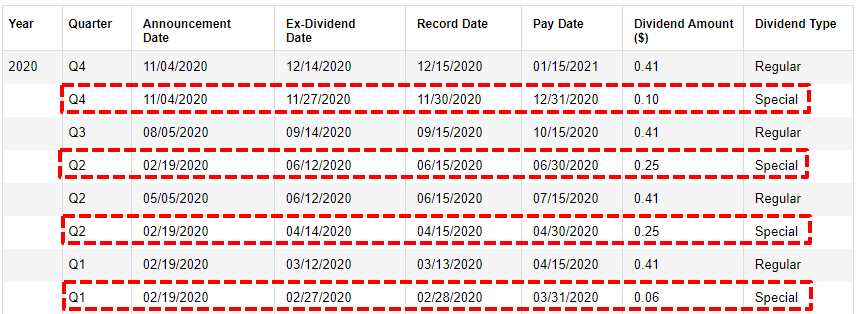
CSWC’s Board declared a total dividend of $0.51 per share for the quarter ended December 31, 2020, including the regular quarterly dividend of $0.41 per share and a supplemental dividend of $0.10 per share.
“Total dividends for the quarter of $0.51 per share represented an annualized dividend yield on the quarter stock price per share of 14.5% and an annualized yield on net asset value per share of 13.3%. I’m also pleased to announce that our board has declared total dividends of $0.51 per share again for the quarter ended December 31, 2020, consisting of a regular dividend of $0.41 per share and a supplemental dividend of $0.10 per share.”

CSWC’s target pricing and dividend yield in the BDC Google Sheets takes into account $0.10 per share of quarterly supplemental/special distributions that will likely continue beyond 2021. Similar to MAIN, the supplemental dividends are typically covered by realized capital gains and over-earning the regular dividend. CSWC had net realized gains of $44 million during calendar Q4 2019 related to the exit of Media Recovery. As of September 30, 2020, CSWC had $1.19 per share of undistributed taxable income and gains. Management is likely going to maintain its dividends going forward as they need to distribute this over the coming quarters:
“We also continued our supplemental dividend program paying out an additional $0.10 per share, funded by our sizable undistributed taxable income balance. As a reminder, the supplemental dividend program allows our shareholders to meaningfully participate in the successful exits of our investment portfolio through distributions from our UTI balance. As of September 30, 2020, our estimated UTI balance was $1.19 per share.”
From previous call: “Due to the successful sale of Media Recovery in late 2019, we were able to replenish our UTI balance to the maximum allowable level as of the end of the 2019 tax year, providing visibility on the longevity of the program well into the future. The program will continue to be funded from UTI earned from realized gains on both debt and equity, as well as undistributed net investment income earned each quarter in excess of our regular dividends. The good news is the UTI balance that you have is not affected by having realized losses. What it does create is sort of an amount that you have to overcome with realized gains before you’re able to book additional pennies into the UTI bucket. We feel like we’ve got two to three years of runway to create those gains to apply against those losses to continue this program without any interruption.”
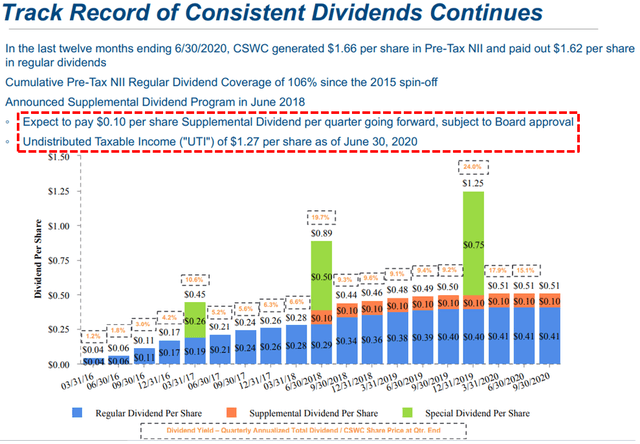
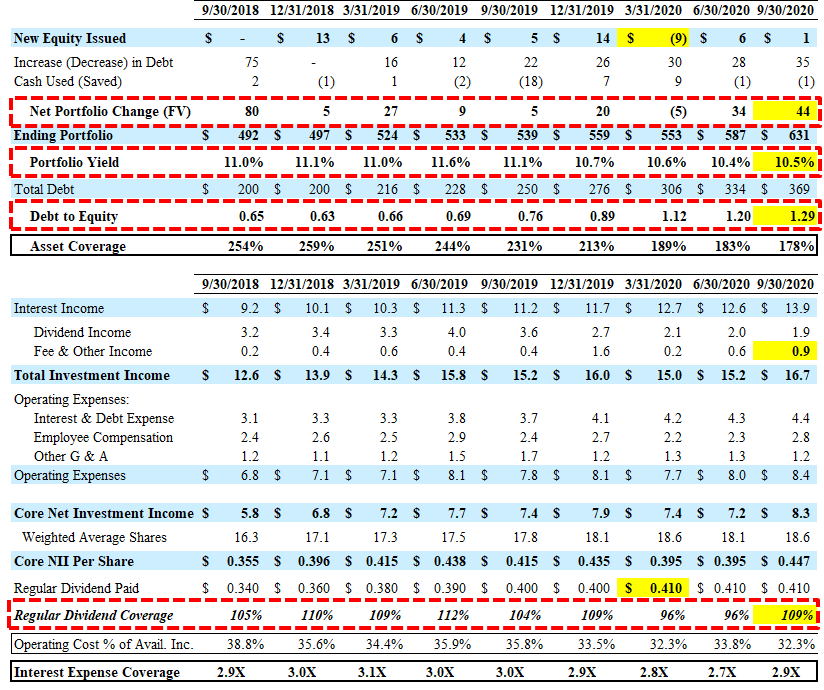
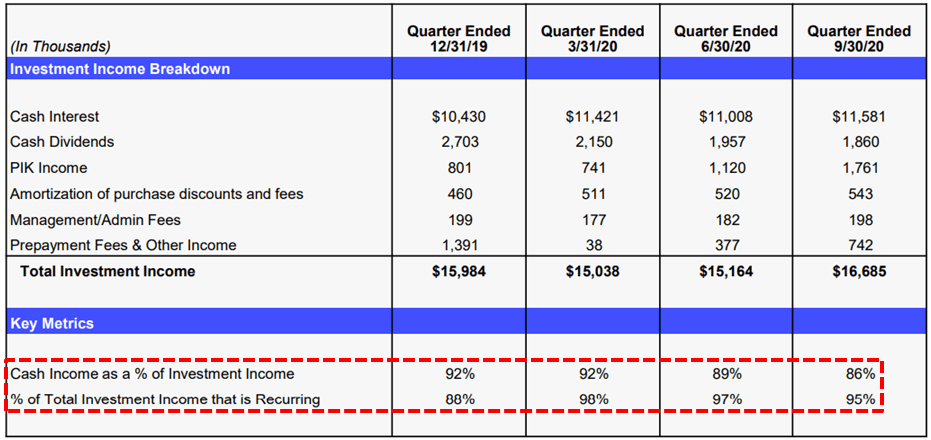
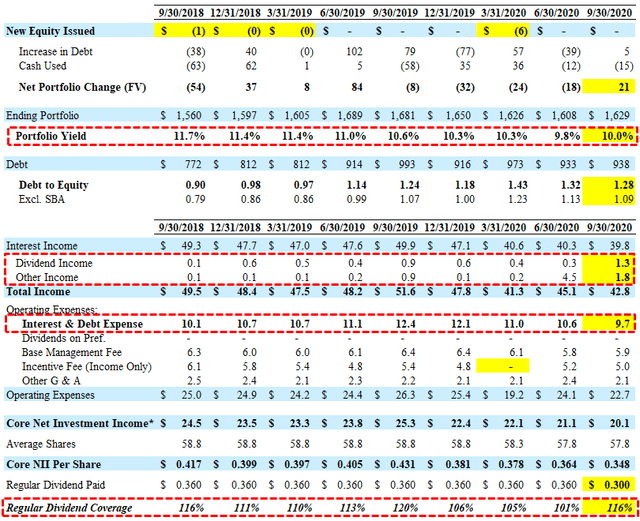
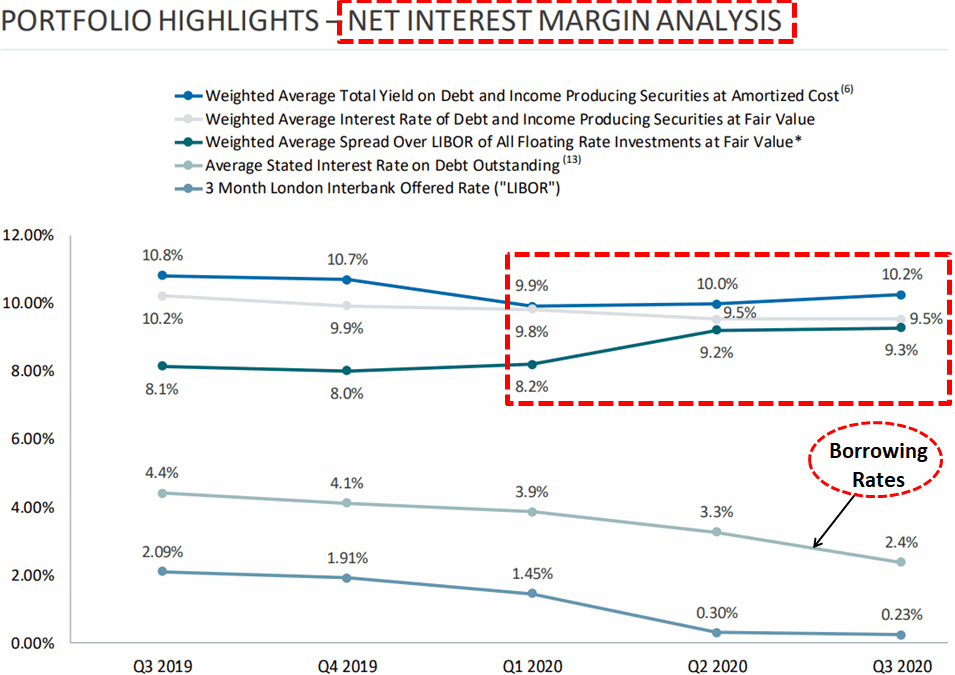
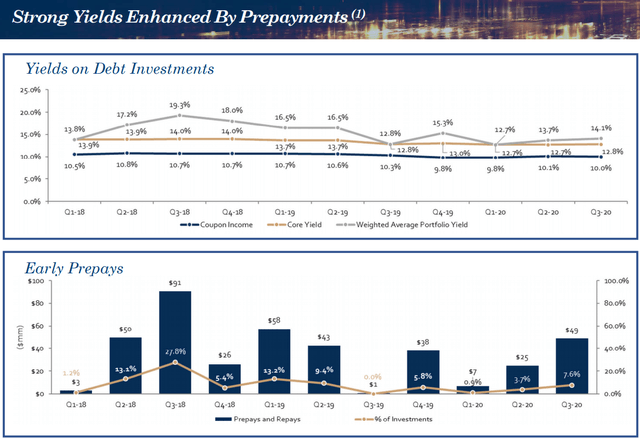
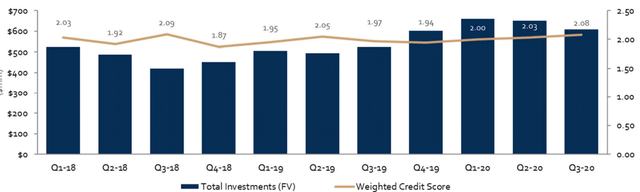
For calendar Q3 2020, CSWC reported just above its best-case projections with higher-than-expected portfolio growth, interest and fee income covering its regular quarterly dividend by 109%. The company is now above its upper targeted leverage (1.20) with a debt-to-equity ratio of 1.29 but recently submitted its application to form a new SBIC subsidiary with access to an additional $175 million of low-cost capital with potential approval by the end of this year as discussed later.
“This quarter, we had probably about $400,000-ish of one-time fees that are above our normal expectation or run rate. Then in terms of this quarter repayments — right now I think of the one to three prepayments, one of them does not have a [indiscernible], and I think that there’s maybe one small one between the other two. So I would tell you, it’s like $50,000-ish but having said that, there’s always something that comes up so that number could be elevated by the end of the quarter.”
As predicted in the previous report, dividend coverage improved partly due to adding Delphi Intermediate Healthco back on accrual status. Over the coming quarters, dividend coverage should continue to improve due to additional investments added back to accrual status (discussed later) and reduced borrowing expenses including the previously discussed redemption of $20 million of its Baby Bond “CSWCL” and SBIC license, and new investments at a relatively higher yield. An SBIC license will provide CSWC an incremental source of long-term capital by permitting it to issue up to $175 million of SBA-guaranteed debentures. These debentures have maturities of ten years with fixed interest rates currently around 3%.
“During the quarter, we raised an additional $50 million on our 5.375% unsecured notes due 2024 and subsequently paid down $20 million on our 5.95% baby bond due 2022. We will continue to be opportunistic in paying down higher price debt to optimize net investment income while also being mindful of maintaining appropriate flexibility in our liability structure. So we will be ramping up our revolver, in fact, to both pay down some of the 5.95% bonds, as well as to accommodate originations that are not in the SBIC going forward. Finally, as we mentioned last quarter, we continue to work with the U.S. Small Business Administration towards becoming officially licensed as an SBIC. We are pleased to report that we completed our final license submittal during the quarter, and look forward to reporting developments on the status of our pending license application to our shareholders as warranted. As a reminder, final approval, and issuance to Capital southwest of an SBIC license would provide a 10-year commitment to provide Capital Southwest with up to $175 million in debt financing to be drawn to fund investment in our lower middle market strategy.”
Also, management is actively growing the portfolio including $66 million of new originations in Q3 2020: “On the new origination front, we remained active, committing $66.3 million in originations to both new and existing portfolio companies.”
On July 30, 2020, CSWC announced that the U.S. Small Business Administration (the “SBA”) has issued a “green light” letter inviting the company to file its application to obtain a license to operate a Small Business Investment Company (“SBIC”) subsidiary. During Q3 2020, the CSWC submitted its final application and is expecting to receive its first license by the end of the year with qualifying investments that could be funded as early as Q1 2021:
“We estimate that the vast majority of the deals we have reviewed over the past five years would qualify for SBIC financing, giving us a high level of competence that we will be able to invest this capital in our existing strategy and continue to support growth and employment in small businesses across the country. As a reminder, each draw from the SBIC debenture program separately represents a new debt security in our capital structure with a 10-year maturity from the date of draw, making this capital truly long term in nature. From a cost perspective, if treasury rates remain close to today’s level, the all-in cost of the SBIC debentures would be less than 3%. This program is clearly a perfect fit for our lower middle market focus and we look forward to continuing to work with the SBA in completing the application process and in successfully executing the SBA’s mission of supporting growth and employment in U.S. Small businesses. We believe we’re in the final stages of the licensing process and are hopeful of receiving our license by the end of the calendar year. We are excited to integrate the SBIC license into our capitalization strategy as the flexibility and low cost of SBIC debentures should be highly accretive to our net investment income per share, while also allowing us to continue to provide important growth and acquisition capital to U.S. Small businesses.”
“We actually expect that we’re weeks away from actually having that application. We don’t want to be presumptive, but that’s the kind of the guidance we’ve been given. So we’re going to just wait until probably December and likely start allocating those assets to the SBIC, probably in January.”
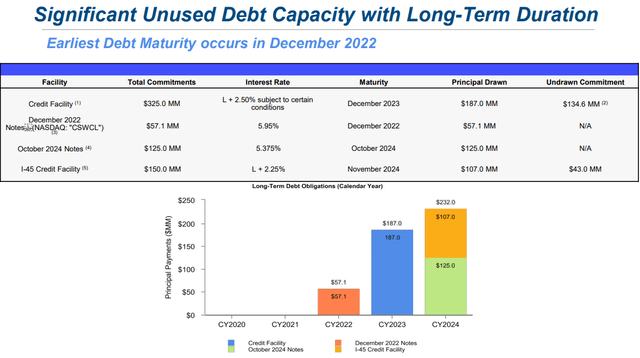
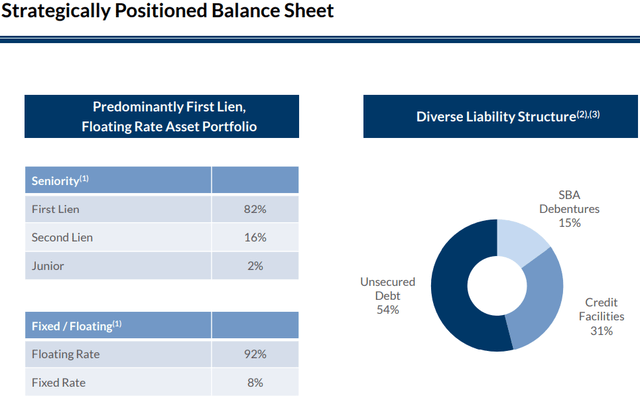
On September 29, 2020, CSWC redeemed $20 million of its 5.95% Notes due December 2022 and recognized realized losses on the extinguishment of debt of $0.3 million. In August 2020, the company issued an additional $50 million of the 5.375% Notes due October 2024. As of September 30, 2020, CSWC had almost $16 million in unrestricted cash and almost $135 million in available borrowings under its credit facility for upcoming portfolio growth. In April 2018, the Board approved the application of the modified asset coverage requirements and the minimum asset coverage ratio applicable to the company was decreased from 200% to 150%. Previously, management was targeting a debt-to-equity ratio between 1.00 and 1.20 but is expecting around $30 million of prepayments in Q4 2020 and is taken into account with the updated projections along with additional prepayment fees:
“If you think about leverage up to 1.28, the answer is, yes, we’re comfortable with where we are. It is higher than our 1.1 to 1.2 target range we gave pre-COVID. If you look at — if you just take a high level, look at the depreciation in the portfolio during COVID, retracing that COVID effect on the portfolio, we’re basically back to the top end of our leverage range and so, you have to keep in mind that as the portfolio re-appreciate that leverage, all else equal will come down. So that’s one point and why I can say we’re comfortable with where we are. The next thing is we’ve got visibility on $30 million to $35 million of pre-payments coming in from portfolio companies that are performing very well and are being sold or refinanced or what have you. So if you of think about leverage, we have visibility on cash coming in. So we’ll obviously be redeploying that cash in originations.”
In March 2019, CSWC established its equity “At-The-Market” (“ATM”) program of slowly issuing small amounts of shares at a premium to book value/NAV and accretive to shareholders. As CSWC’s stock price continues higher, management will likely use the ATM program for raising equity capital, rather than larger equity offerings. This approach is beneficial for many reasons including being more efficient, delivering higher net proceeds to the company and less disruptive to market pricing. During Q3 2020, the company sold only 35,112 shares of its common stock at a weighted-average price of $14.99 per share, raising $0.5 million.
“But that’s another point. And the third thing I would say is, if you think about — we traded well above book for almost two years pre-COVID. So I believe that we’ve proven that our business model and our strategy in a more normal market should trade above NAV. So if it trades above NAV, as you know, we’ve got an ATM program that we’re diligent about accessing at very low spreads to trade. So that’s obviously a function and our yield on NAV today is 13.5% or so. And on the stock price, it’s north of 14%. The market will figure out the risk premium on our stock over time. So we’re comfortable and just letting the market play out. But those yield levels, based on our strategy and track record, really are not where we believe those yield levels will normalize out over time, which we believe will trade above NAV and we’ll be able to raise equity. So, those are all the points that are in my head, as I look at the leverage of 1.28 and go, am I comfortable with that or not?”
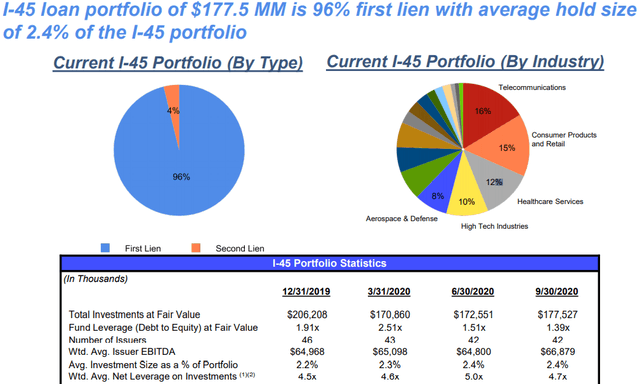
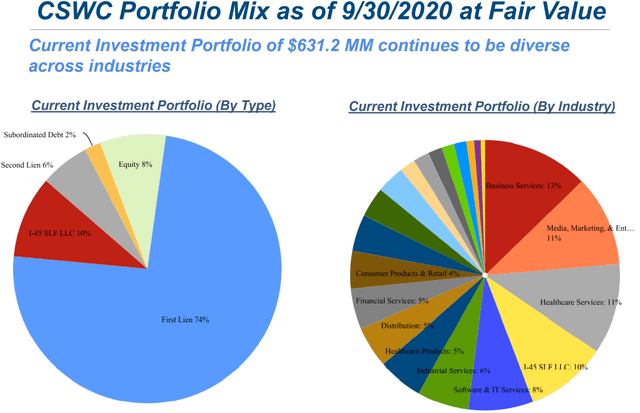
As expected, its I-45 Senior Loan Fund was marked up again, remains around 10% of the total portfolio and is a joint venture with MAIN created in September 2015. The portfolio is 96% invested in first-lien assets with CSWC receiving over 75% of the profits providing 11.0% annualized yield (previously 12.5%) paying a quarterly dividend of $1.7 million compared to $1.8 million during the previous quarter.
“Turning to Slide 16, the I-45 portfolio shows meaningful improvement during the quarter as our investment in I-45 appreciated by $4.7 million or 8%. Leverage at the I-45 fund level is now 1.39x debt to equity at fair value, which is substantially improved from the March 31, quarter average of 2.51x.”
Its regular quarterly dividends are covered mostly through recurring cash sources:

CSWC Risk Profile Update
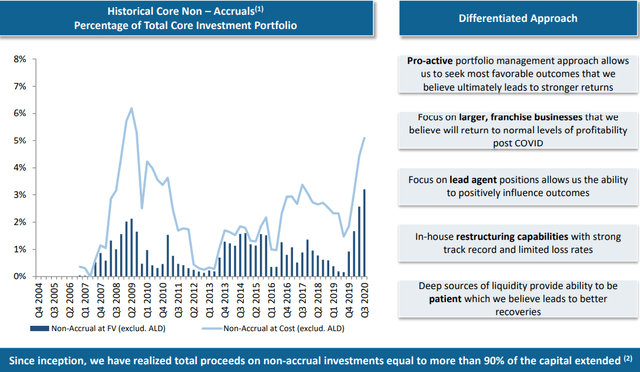
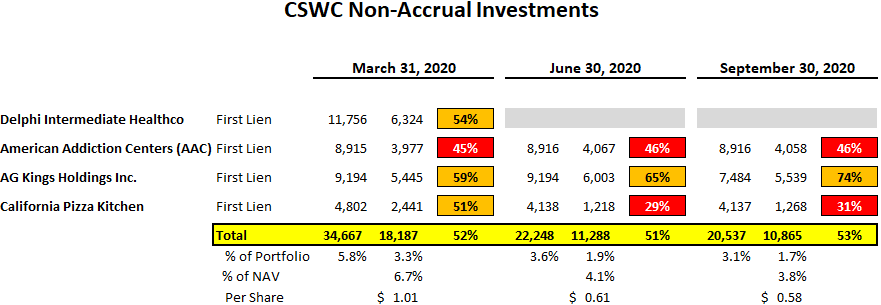
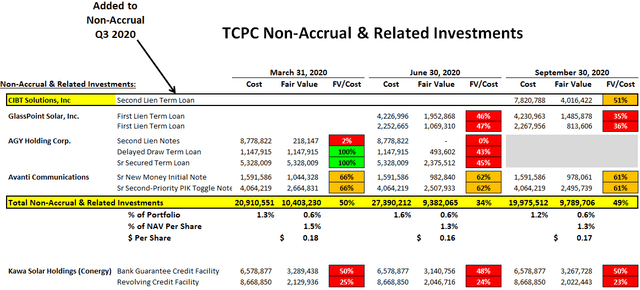
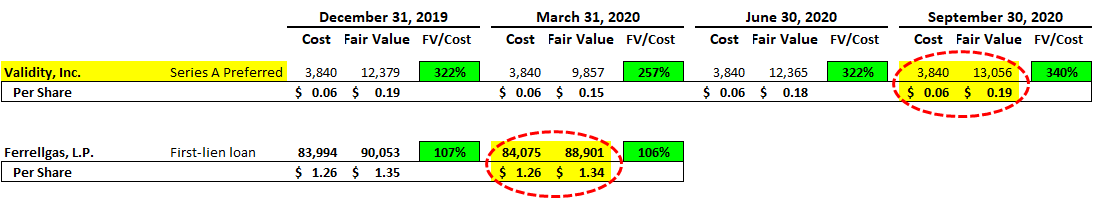
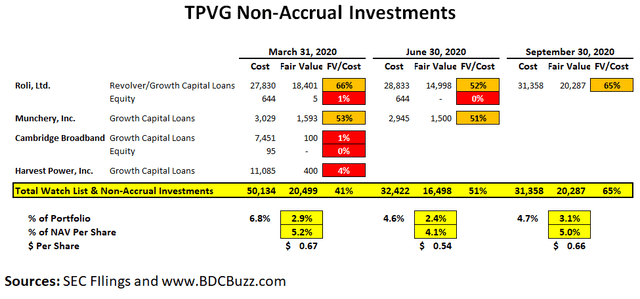
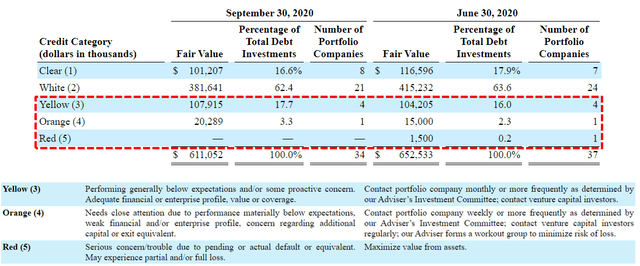
There were no additional investments added to non-accrual status during the quarter. American Addiction Centers (“AAC”), AG Kings Holdings, and California Pizza Kitchen (“CPK”) remain on non-accrual status with a total fair value of $10.9 million or 1.7% of the total portfolio. If completely written off would impact NAV per share by around 3.8% as shown in the following table.
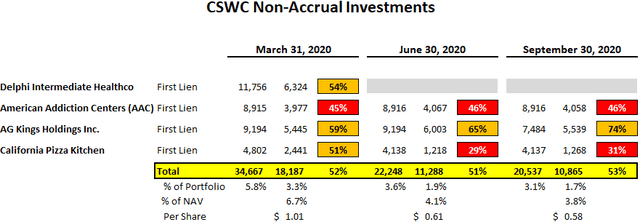
These investments were discussed on the recent call and management is expecting some positive results including either being restructured back on accrual status (AAC and CPK) or outright sales (AG Kings is being purchased by Albertsons) and then reinvested into income-producing assets:
Q. “I wanted to touch on the non-performing loans, if I’m not mistaken, they’re all in certain stages of bankruptcy. And I think there’s been some movements since our last call. So starting with American Addiction, from what I’ve read, the information is a little sparse, it looks like you’re going to be repaid in cash on that from asset sales. Is that correct? And when will that be?”
A. “So based on what’s public, it’s going to emerge from bankruptcy relatively soon. It’ll be restructured. So the lender group, which we are a part of, will end up holding a debt security, first lien debt security in the new restructured company, and then ownership of the equity in the company. So it’ll be restructured, it will emerge from bankruptcy and Capital Southwest actually will have a board seat. And so, that’s that, it will all be resolved relatively soon. I mean, it’s not in our control, but it’s basically got to work through taxes and various things, structuring the recap, the restructuring, so that’s AC. Anyway, you want to talk about Kings and CPK, as well?”
Q. “So CPK, it looks like similarly you’re going to get equity and debt. Is that correct? And when is that going to happen?”
A. “Similar story as AC as far as what will happen from the bankruptcy perspective. So we’ll end up with a performing, firs lien note and equity in the company, we will not have a board seat in that instance. We think that’s going to happen — I think it may be announced, but it’ll be relatively soon. This manager team seems to be doing a really good job with the business. And it’s one thing, and then the other thing is that the restaurants that have opened, people come eat there, and so it tells me that the brand is relevant, and it’s desired, and there’s a demand for that brand and that concept in the market. So that’s encouraging. Clearly COVID is a bunch of noise out there. It’s affecting all the restaurants, the management team is doing some interesting creative things around that, with respect to CPK. The election and any kind of unrest that may result — unrest in an area affects all the retailers, all the places, restaurants included in those areas. So there’s clearly noise out there. But the thing I grab on to is manager team is seem to be doing a great job, we have weekly calls, and the restaurants that are open, people want to eat there. And so, based on those two things, that gives me a lot of encouragement as to the future of that concept once all the market noise, COVID pandemic noise sort of fades away, which will, this too shall pass. And so, still challenges, but good team, and there’s some definitely some signs of relevance of that concept and brand.”
Q. “And on AG Kings, obviously there was a stalking-horse bid. I haven’t seen another bid come through unless I’m mistaken. Is that correct? Or are there other folks snooping around and potentially going to offer?”
A. “Yes, so that’s actually been announced, and they signed a purchase agreement to sell the Albertsons. That’s in a process of closing/documentation process. And it’s pretty much all I should really say about it, but our evaluation is the best guess on waterfall analysis around the proceeds on a sale.”
Similar to other BDCs, I am expecting additional increases in its net asset value (“NAV”) per share over the coming quarters:
“So as far as NAV I think a big uplift in NAV for many BDCs including us will be just re-appreciation of the noise that’s been created by the current market environment. I think we certainly expect to see that. Then we have a nice equity portfolio with some companies that are growing, a couple of companies that we’ve had to decrease the appreciation to write it down based on COVID, which we certainly expect that to re-appreciate. So I think that clearly there are — from where we sit today, there are definitely tailwinds that should support NAV growth going forward.”
“Our investment strategy has remained consistent since its launch in January of 2015. We continue to focus on our core lower middle market, while also maintaining the ability to invest in the upper-middle market when attractive risk-adjusted returns exist. In a lower middle market, we directly originate opportunities consisting of debt investments and equity co-investments. Building out a well-performing and granular portfolio of equity co-investments is important to driving NAV per share growth as well as aiding in the mitigation of any credit losses over time.”
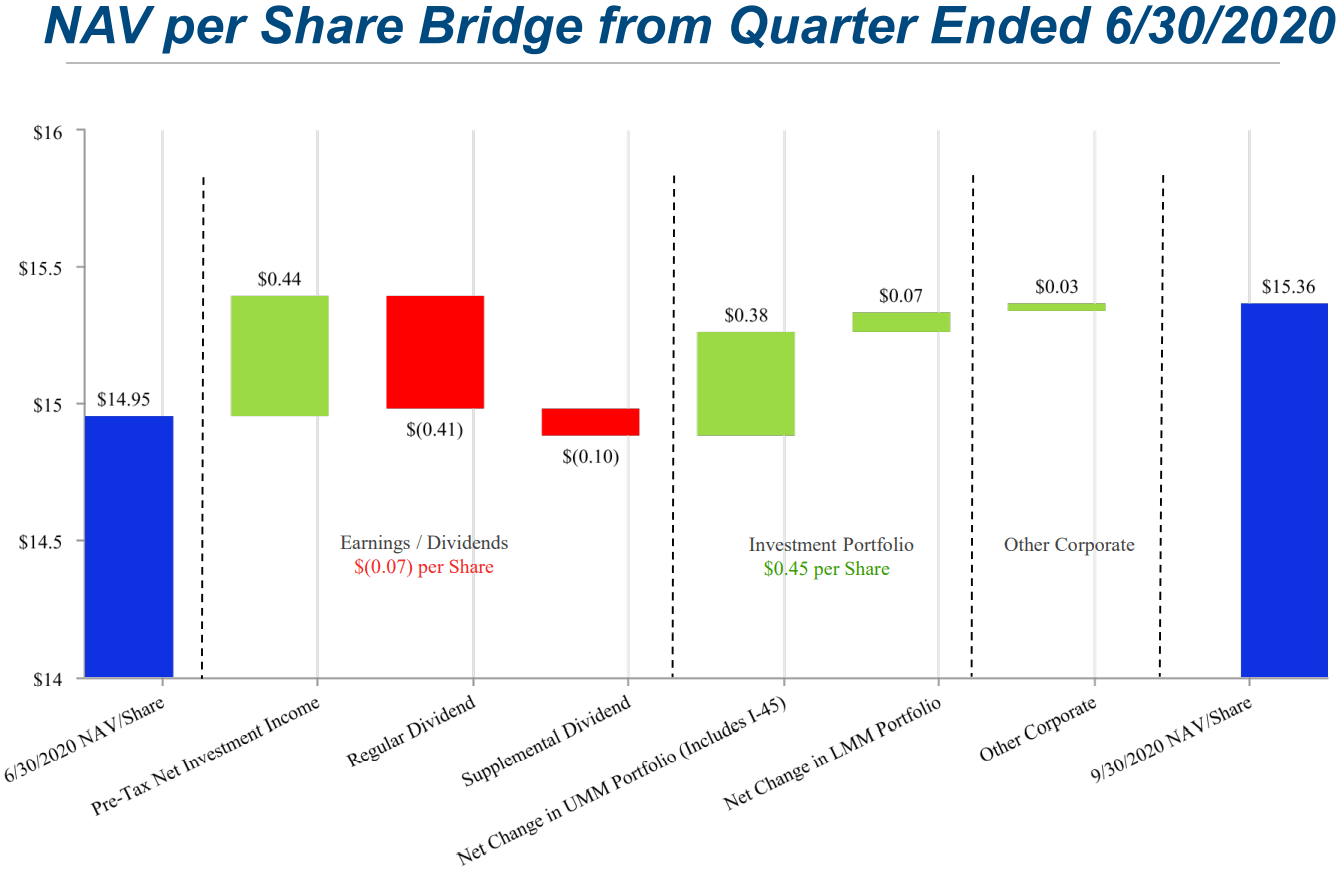
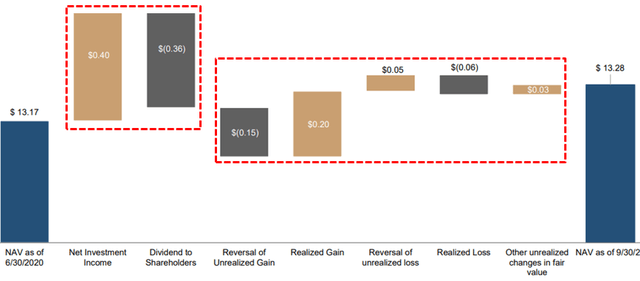
For Q3 2020, CSWC’s NAV per share increased by $0.18 or 2.7% (from $14.95 to $15.36) “primarily due to net unrealized appreciation on the investment portfolio”,
“Turning to Slide 20, the company’s NAV per share as of September 30, 2020, was $15.36 as compared to $14.95 at June 30, 2020. The main driver of the NAV per share increase was $8.4 million of appreciation in the investment portfolio, much of which was in the upper-middle market portfolio.”

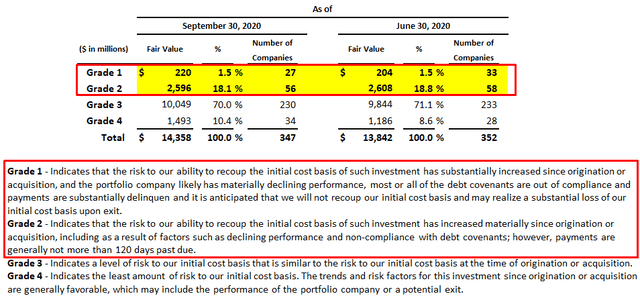
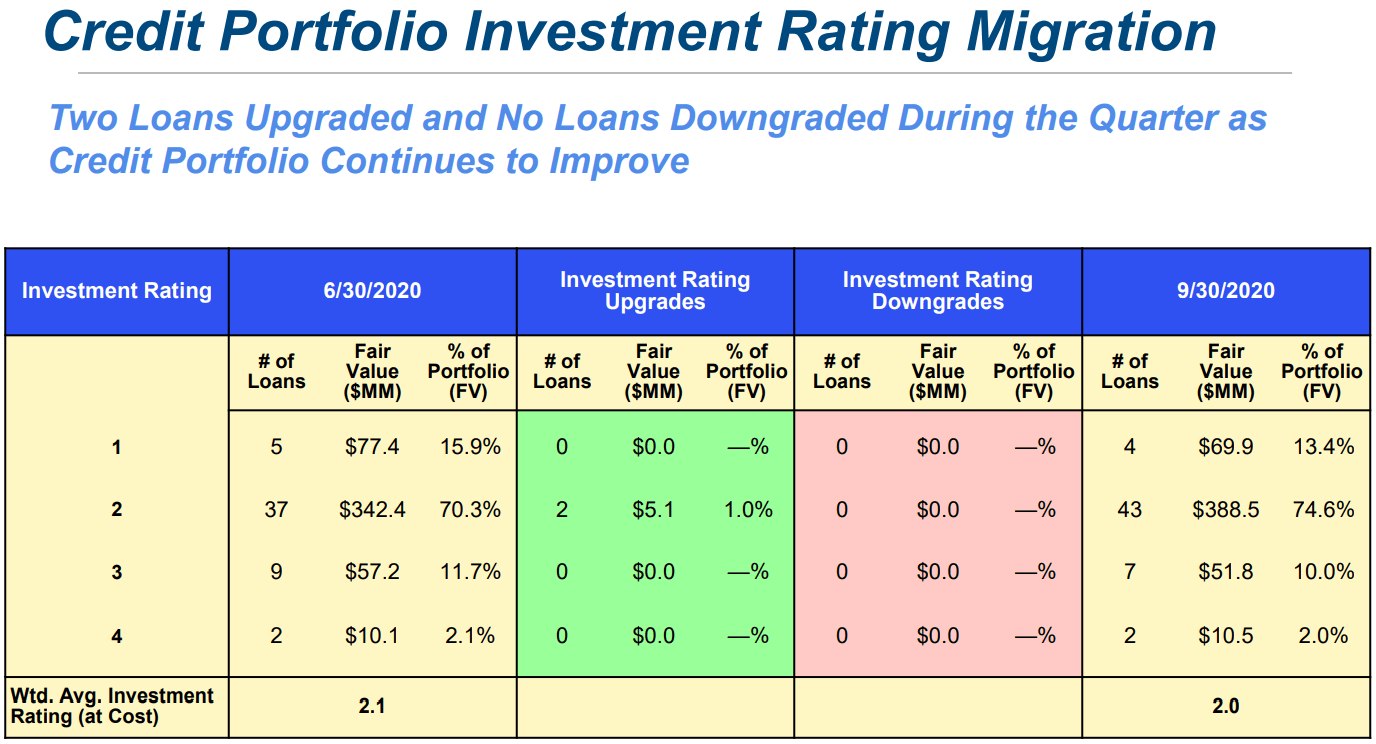
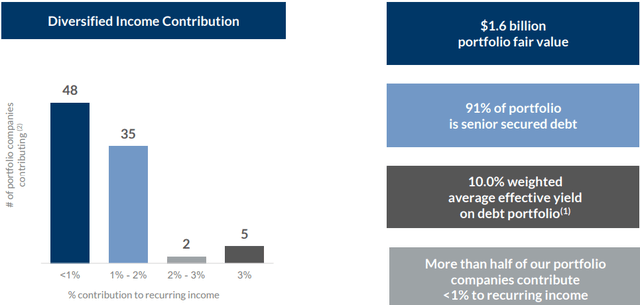
There was an improvement in overall credit quality including two upgrades to ‘Investment Rating 1’ and no downgrades. Similar to other BDCs, my primary concern is the 10.0% (previously 12.5% in Q1 2020) of the portfolio considered ‘Investment Rating 3’ which implies that the “investment may be out of compliance with financial covenants and interest payments may be impaired, however, principal payments are generally not past due.”
“Turning to Slide 14, we have laid out the rating migration within our portfolio for the quarter. During the quarter we had two loans upgraded while having no loans downgraded. As a reminder, all loans upon origination are initially assigned an investment rating of two on a four-point scale, with 1 being the highest rating and 4 being the lowest rating. The upgrades consisted of two loans to one portfolio company previously rated at 3, which were upgraded to a 2 rating based on much-improved performance. As of the end of the quarter, 80% of our investment portfolio at fair value was rated in one of the top two categories a one or two. We had seven loans representing 10% of the portfolio at fair value rated a three and only two loans representing 2% of the portfolio at fair value rated a four.”
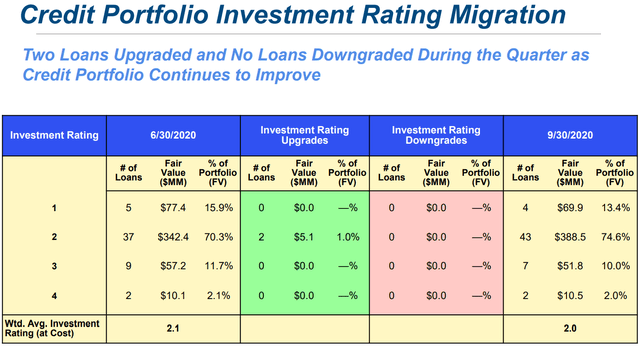
Investment Rating 3 involves an investment performing below underwriting expectations and the trends and risk factors are generally neutral to negative. The portfolio company or investment may be out of compliance with financial covenants and interest payments may be impaired, however principal payments are generally not past due.
Investment Rating 4 indicates that the investment is performing materially below underwriting expectations, the trends and risk factors are generally negative and the risk of the investment has increased substantially. Interest and principal payments on our investment are likely to be impaired.
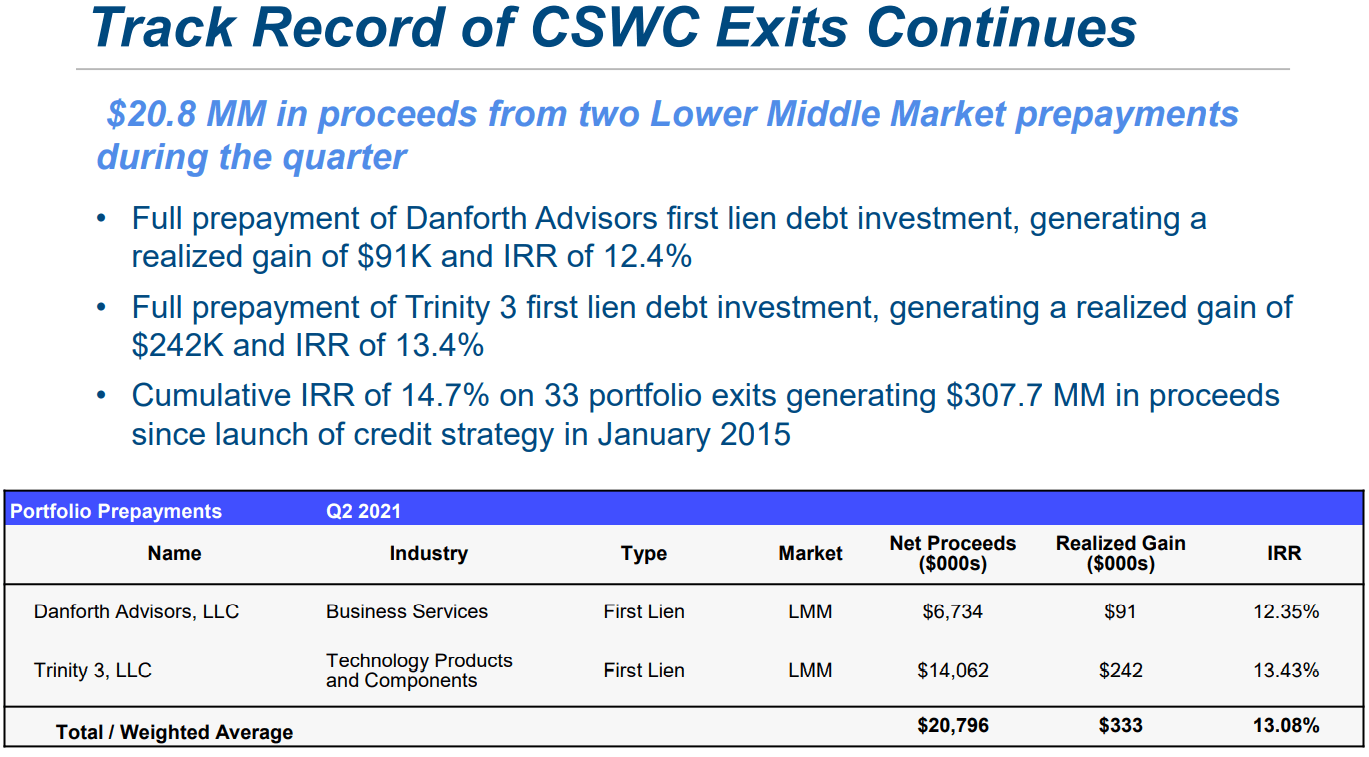
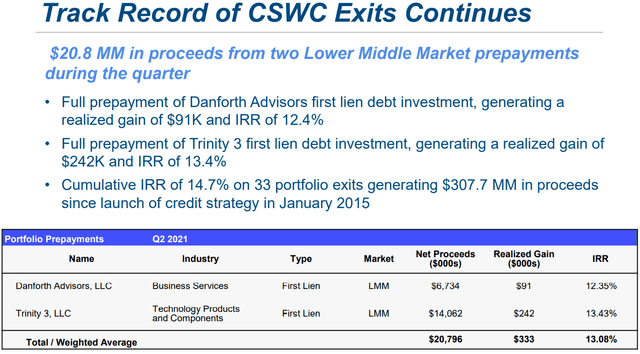
“Turning to Slide 12, as I previously alluded to, we had two lower than the market exits this quarter, Danforth Advisors and Trinity 3. Our debt at Danforth was refinanced by a traditional bank, repaying our loan in full, generating proceeds of $6.7 million and an IRR of 12.4%. We continue to hold equity in Danforth alongside the sponsor and we are excited to watch this management team and sponsor continue its stellar performance.”
“In the case of Trinity 3, which also appears on the New Deal funding’s for the quarter, we were able to participate in a much larger club deal which refinanced our original loan and finance a large strategic acquisition for Trinity 3. We also hold an equity interest in this company and are very excited about its continued growth prospects going forward. This continues our track record of successful exits. To date, we have generated a cumulative weighted average IRR of 14.7% on 33 portfolio exits, generating approximately $308 million in proceeds.”
New portfolio company investment transactions that occurred during the quarter ended September 30, 2020, are summarized as follows:
- Electronic Transaction Consultants LLC, $10.0 million 1st Lien Senior Secured Debt, $3.7 million Revolving Loan, $1.0 million Common Equity: Electronic Transaction Consultants Corporation designs, implements, supports and maintains software systems used to facilitate electronic toll collections for toll road authorities and operators.
- Ian, Evan, & Alexander Corporation (d/b/a EverWatch), $10.0 million 1st Lien Senior Secured Debt, $2.0 million Revolving Loan: EverWatch is a technology solutions company providing advanced defense, intelligence, and deployed support to mission critical missions in the national security and intelligence space.
- RTIC Subsidiary Holdings, LLC, $6.9 million 1st Lien Senior Secured Debt, $1.1 million Revolving Loan: RTIC Holdings, LLC is the largest pure-play direct-to-consumer eCommerce provider of high-quality outdoor products that are priced for value-conscious outdoor enthusiasts.
- Sonobi, Inc., $8.5 million 1st Lien Senior Secured Debt, $0.5 million Common Equity: Sonobi, Inc. is a digital media technology platform that directly connects advertisers in order to efficiently connect brands with their desired consumers.
- “We had 39 lower middle market portfolio companies with a weighted average leverage ratio measured as debt to EBITDA through our security of 3.9x down from 4.1x weighted average leverage in the prior quarter. This reduction in leverage was primarily driven by EBITDA performance across the lower middle market portfolio during the quarter. Within our lower middle market portfolio, as of the end of the quarter, we held equity ownership in approximately two-thirds of our portfolio companies.”
- “Our own balance sheet upper middle market portfolio excluding I-45 consisted of 12 companies with an average leverage ratio through our security of 3.7x down meaningfully from the 4.4x weighted average leverage for the prior quarter. This decrease was also driven primarily by EBITDA improvement quarter-over-quarter across the portfolio.”
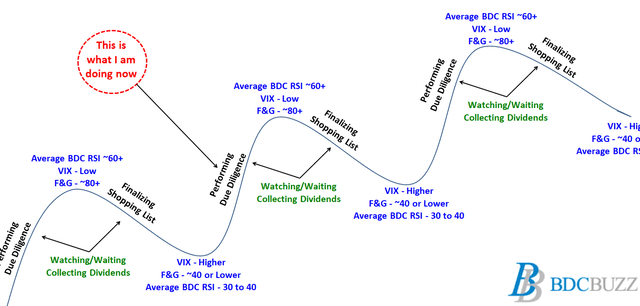
Volatility is your friend!
BDC pricing can be volatile and timing is everything for investors that want to get the “biggest bang for their buck” but still have a higher-quality portfolio that will deliver higher-than-average returns over the long term. One of my goals is to help subscribers take advantage of “oversold” conditions.
Full BDC Reports
This information was previously made available to subscribers of Premium BDC Reports, along with:
- CSWC target prices and buying points
- CSWC risk profile, potential credit issues, and overall rankings
- CSWC dividend coverage projections and worst-case scenarios
- Real-time changes to my personal portfolio
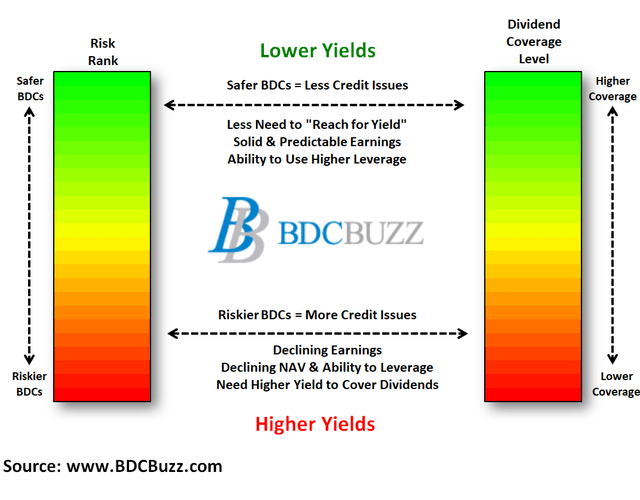
BDCs trade within a wide range of multiples driving higher and lower yields mostly related to portfolio credit quality and dividend coverage potential (not necessarily historical coverage). This means investors need to do their due diligence before buying.
To be a successful BDC investor:
- Identify BDCs that fit your risk profile.
- Establish appropriate price targets based on relative risk and returns (mostly from regular and potential special dividends).
- As companies report results, closely monitor dividend coverage potential and portfolio credit quality.
- Diversify your BDC portfolio with at least five companies. There are around 45 publicly traded BDCs; please be selective.