The following is a quick PFLT Update that was previously provided to subscribers of Premium Reports along with revised target prices, dividend coverage and risk profile rankings, potential credit issues, earnings/dividend projections, quality of management, fee agreements, and my personal positions for all business development companies (“BDCs”).
Recent PFLT Insider Purchases
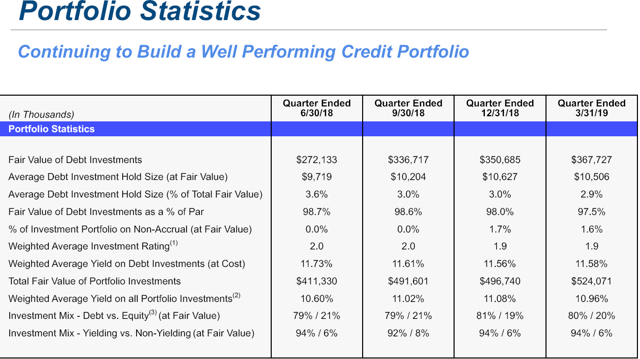
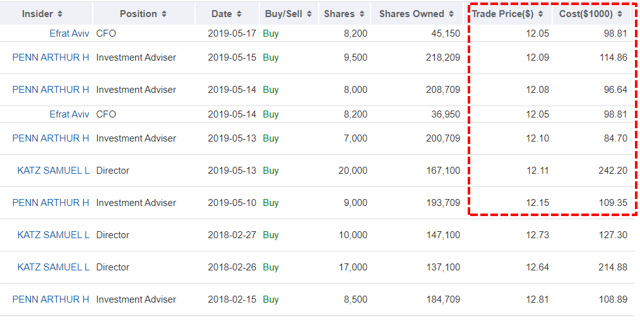
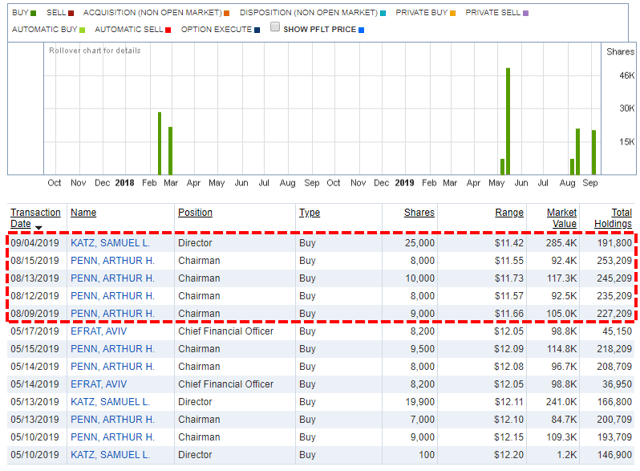
As shown below, Art Penn (Chairman and CEO) was actively purchasing shares last month at prices between $11.55 and $11.73:
PFLT Risk Profile Update
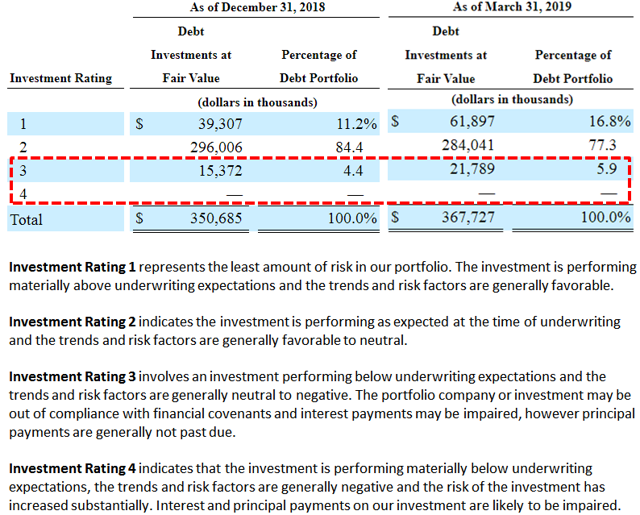
I consider the recent portfolio credit issues to be idiosyncratic (as compared to systematic) implying that they are not indicative of general underwriting issues within the portfolio. These investments have been discussed in many of the previous reports as management was clearly marking their values. PFLT has not experienced non-accruals over the last two years and “it’s unfortunate that they all happened in this one quarter”:
From previous call: “Look, we haven’t had a non-accrual and over two years, it looks lumpy here and we’re certainly disappointed, but non-accruals are part of this business. It’s unfortunate that they all happened in this one quarter. But we normally, they’d be smoothed out overtime and we had, as you said, we already had already marked them down by and large. So, this should not have been a big surprise to people to know for them were exhibiting weakness in the past.”
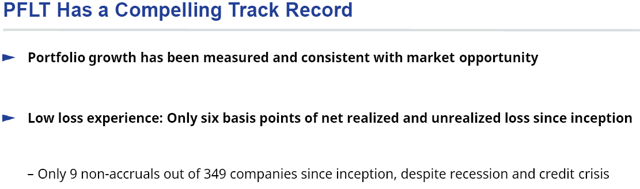
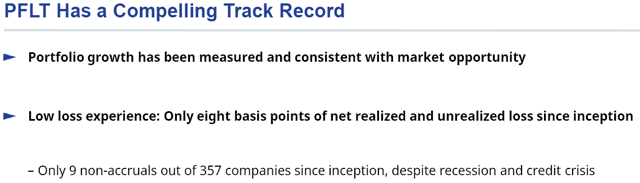
“Our credit quality since inception eight years ago has been excellent. Out of 357 companies in which we have invested since inception, we’ve experienced only nine non-accruals. Since inception, PFLT has made investments totaling about $3 billion at an average yield of 8.1%. This compares with an annualized loss ratio, including both realized and unrealized losses of only about 8 basis points annually.”
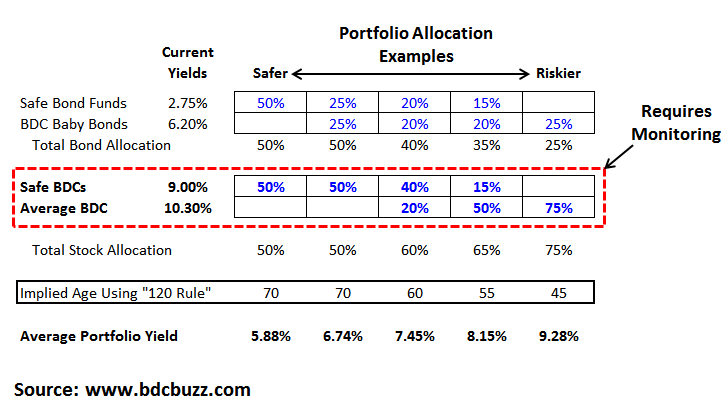
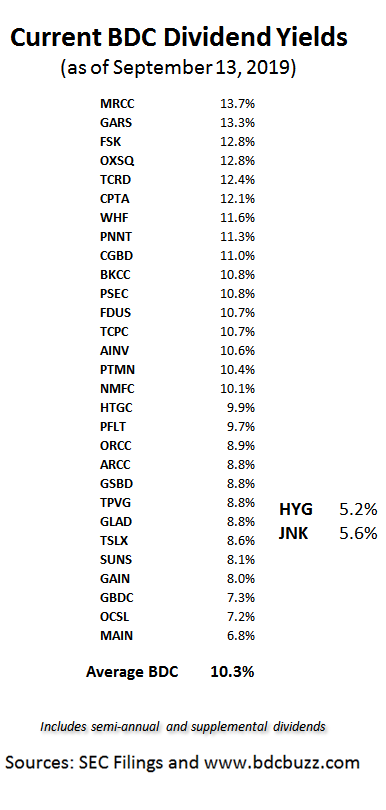
PFLT remains a component in the suggested ‘Risk Averse’ portfolio due to its portfolio of mostly higher quality, first-lien senior secured investments at floating rates.
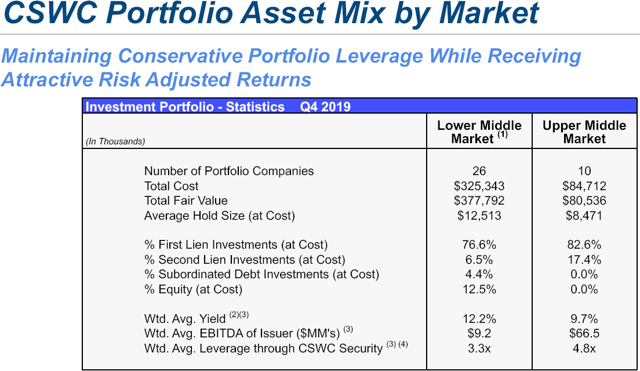
“The cash interest coverage ratio, the amount by which EBITDA or cash flow exceeds cash interest expense continue to be healthy 2.8 times. This provides significant cushion to support stable investment income. Additionally, at cost, the ratio of debt-to-EBITDA on the overall portfolio was 4.8 times, another indication of prudent risk. In our core market of companies with 15 million to 50 million of EBITDA, our capital is generally important to the borrowers and sponsors. We are still seeing attractive risk reward, and we are receiving covenants, which help protect our capital.”
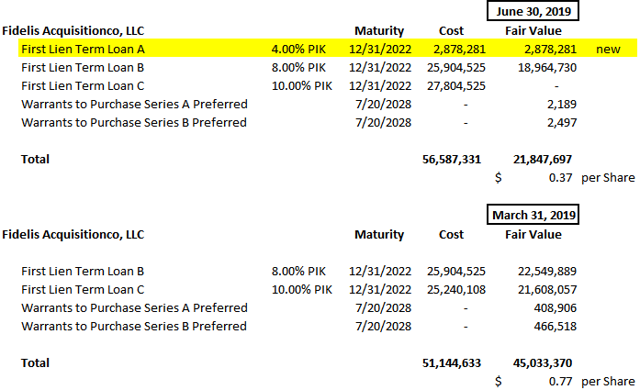
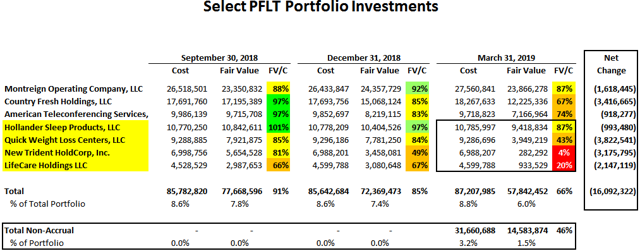
During calendar Q2 2019, its net asset value (“NAV”) per share declined by $0.17 or 1.3% (from $13.24 to $13.07) due to the previously discussed investments shown in the following table. Country Fresh Holdings is still not considered a ‘non-accrual’ but was restructured during the quarter resulting in realized losses of $7.2 million. PFLT now has $2.3 million of first-lien, $5.2 million of second-lien and $10.5 million of non-income producing common equity fair valued at $8.6 million. The other meaningful realized loss came from exiting its non-accrual investment in New Trident HoldCorp resulting in another $7.0 million of realized loss for the quarter.
“New Trident was certainly a big driver. The other ones were [Hollander], which remains a problem, that was one of the non-accruals; and Country Fresh, which got restructured into our quarter. Those were the negative drivers. We do have some very nice co-invest like By Light, DecoPac, Cano Health and Walker Edison, which have been performing well, which, you know, the theme here of course is we are going to make mistakes from time to time; we are going to have non-accruals; and these equity co-invest investments are meant to have some upside that could, you know, in part or in full, you know, fill some of those gaps. So, New Trident certainly was a negative outcome for sure.”
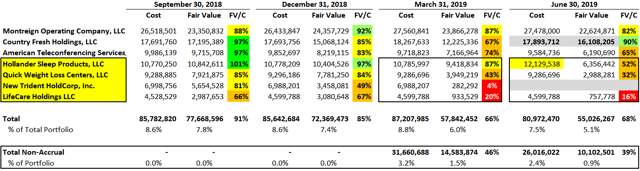
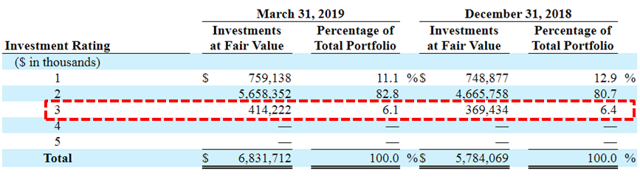
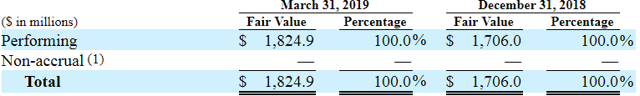
Hollander Sleep Products, Quick Weight Loss Centers, and LifeCare Holdings remain on non-accrual status and were marked down again during the recent quarter but still account for $10.1 million in fair value or 0.9% of the portfolio. If the current non-accruals were completely written off, the impact to NAV per share would be around $0.26 or 2.0% (previously $0.38 or 2.8%). However, management mentioned that there were only two companies on non-accrual as of the earnings call on August 8, 2019:
“Credit quality has improved since last quarter. Today, we only have two non-accruals on the books, representing only 1.4% of the portfolio at cost, and 0.5% end market. As of June 30, we had three non-accruals, which represented about 2.3% of our overall portfolio cost and 0.8% at market. We are pleased with the progress we are making on this front.”
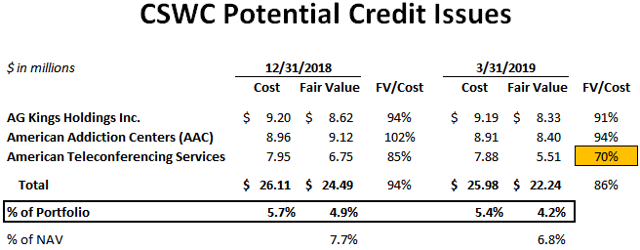
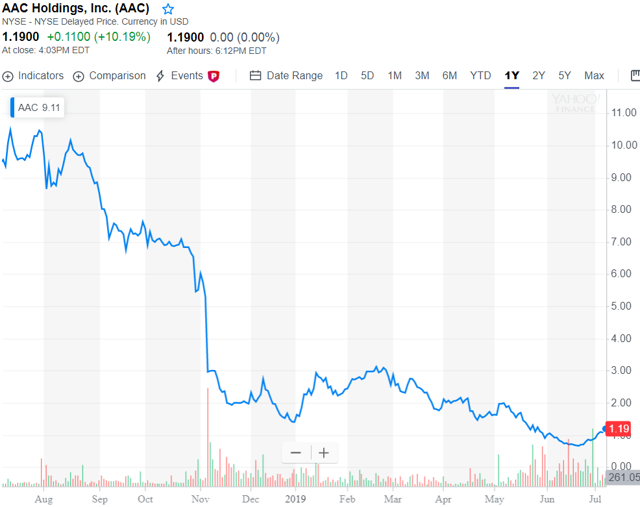
That would imply that Quick Weight Loss Centers was likely restructured or exited during calendar Q3 2019. American Teleconferencing Services was marked down again but is still considered to be performing asset that could be restructured and/or added to non-accrual status over the coming quarters.
As discussed in the previous report,Hollander and LifeCare filed for bankruptcy in May 2019 and are both working to reduce costs to improve overall profitability and/or selling assets. Hollander cited “across-the-board increase in costs, including new tariffs, rising material, labor and shipping costs and the costs of integrating a competitor it acquired last year had left it in a severe liquidity squeeze”. In June 2019, Hollander announced that it could be closing its plant in Thompson, Georgia. In addition, Hollander has been spending money to integrate Pacific Coast Feather Co., which it acquired in 2017.
On September 4, 2019, a New York bankruptcy judge approved the $102 million sale of Hollander to private equity firm Centre Lane Partners. In the motion asking for approval of the new plan, Hollander said negotiations since the filing produced a global creditor settlement that was approved by the court on August 15, 2019. Under the terms of the settlement, Hollander and the plan sponsors will put up $1.25 million to be paid to the company’s unsecured creditors, it said. While the settlement negotiations were happening, the company said it was also soliciting bids for its assets. Ten initial expressions of interest were narrowed down to the one acceptable bid from Bedding Acquisition, it said.
A revised plan with a “toggle” feature to allow switching to an asset sale was put to a vote by the impaired creditors and received approval from the holders of all of the company’s $173.9 million in term loan debt and the holders of more than 95% of its $38.5 million in unsecured debt, it said. Hollander noted that additional changes to the plan include that the providers of the company’s $90 million in debtor-in-possession funding have agreed to accept less than full repayment and to cede repayment priority to Hollander’s prepetition term loan creditors, as well as the establishment of a $1 million wind-down reserve fund.
CEO Marc Pfefferle said “Upon emergence [from bankruptcy], we will have a stronger balance sheet and the financial flexibility needed to compete in today’s dynamic business environment now and over the long-term.”
Montreign Operating Co. is owned by Empire Resorts (NYNY) and operates a resort casino in Monticello, New York that previously received $130 million of additional equity capital from its sponsor as discussed in the previous report. On August 19, 2019, NYNY announced that it was being acquired by Kien Huat Realty and Genting Malaysia Berhad. Kien Huat has agreed to provide incremental credit support to Empire Resorts, “which will enable the company to meet its debt obligations as we continue to execute on our business strategy”.
Ryan Eller, President and CEO of Empire Resorts, said, “With the resources and support of Kien Huat and Genting Malaysia, Empire Resorts will be better positioned financially and operationally, which will help us advance our mission of delivering a winning combination of luxury facilities, quality entertainment and exceptional customer service. This transaction is a win-win for all our stakeholders, including our stockholders, customers, employees, creditors and the communities in which we operate.”
The transaction is expected to close in the fourth quarter of 2019 and I am expecting PFLT’s investment in Montreign to be marked back up to 100% over the coming quarters which would positively impact NAV per share by around $0.13 or 1.0%. Management discussed Montreign on the recent call:
Q. “I believe on the last call you mentioned activity from the sponsor up at Montreign, the casino in the Catskills, and with the announcement over the last few days about the sponsor possibly taking out the minority shareholders, I’m wondering how does that all flows through to your holding in it and the value you assign to that holding?”
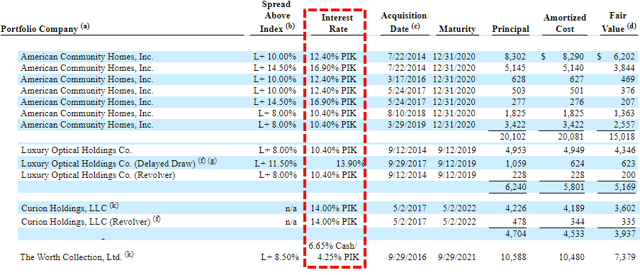
A. “Montreign is – the equity there is controlled by an entrepreneur, and KT Lim, is well-known in the gaming sector. He controls Genting, which is a large gaming company. Montreign is owned in a public company called the New York-New York, NYNY is the ticker. KT Lim has made an announcement that he wants to take NYNY private. He already owns 80% plus of it. At the enterprise value that he’s proposed to take the company private; it values the equity around $300 million. That $300 million of equity of course is junior to $500 million of debt. We own a piece of the Montreign debt, which, today is marked in the mid-80s or so. We still think this is par. Obviously, if the entrepreneur behind it is valuing the equity of $300 million beneath the debt, we think the debt is par, the entrepreneur is indicating that he thinks the debt is par, you know, we’ll see. We think we have a fairly full position right now in PFLT, so we’re not going to add any more debt, but for all those of you in the market who want to buy what we think is very attractive piece of paper, that is broker dealer quoted in the mid-80s, Montreign first lien debt is and we think it’s going to end up being a par piece of paper.”
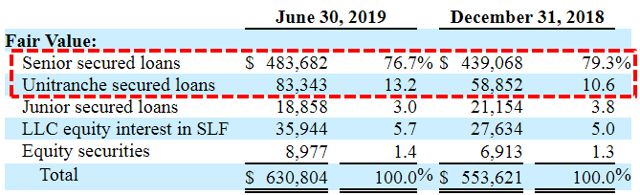
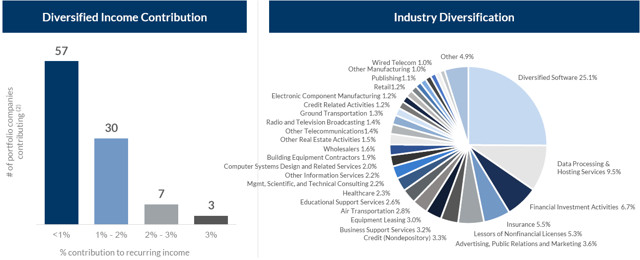
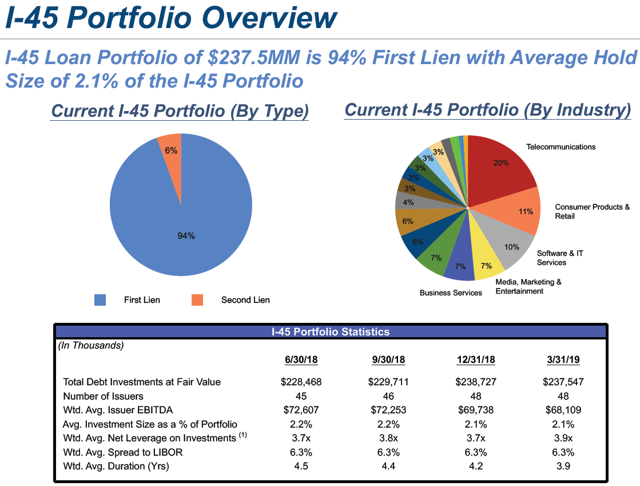
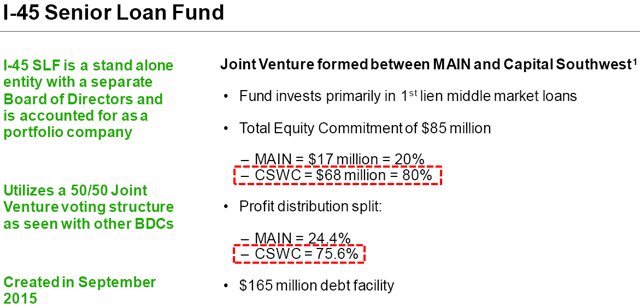
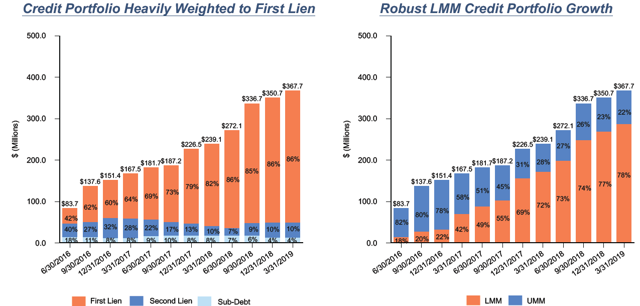
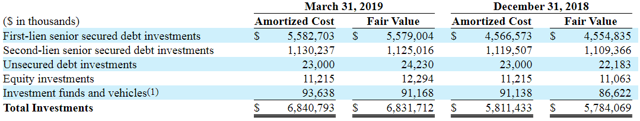
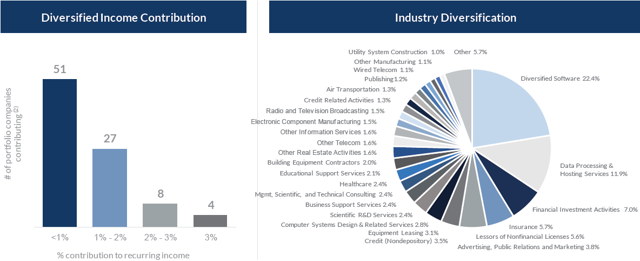
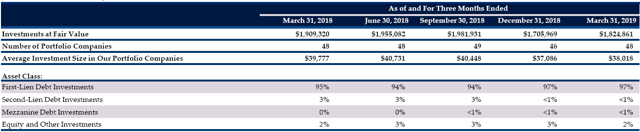
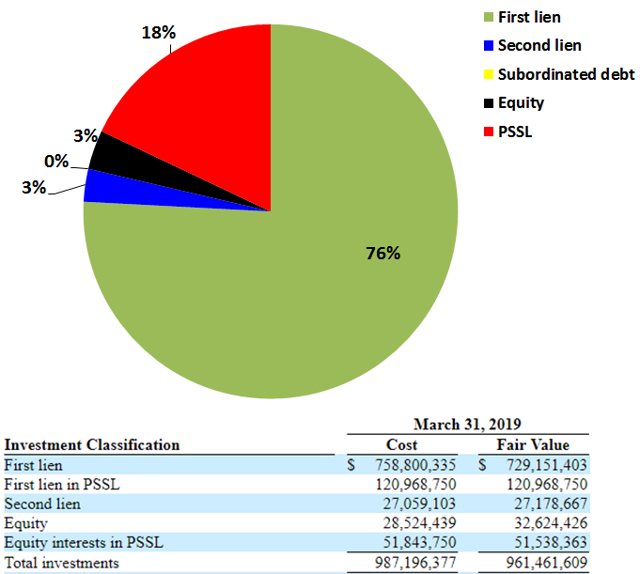
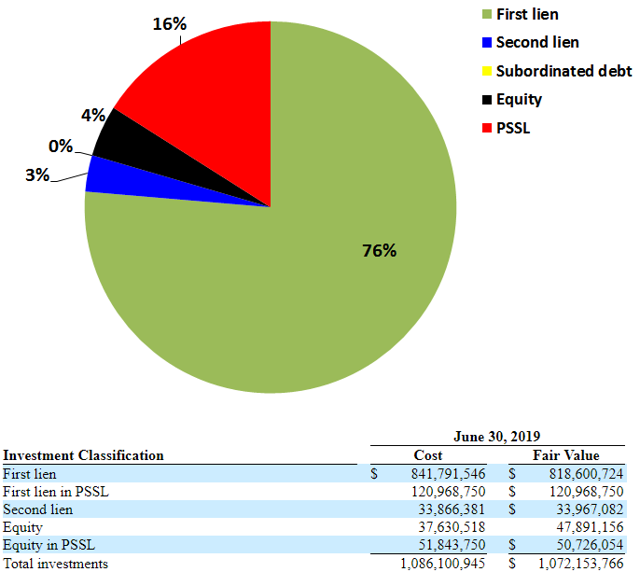
The portfolio remains predominantly invested in first-lien debt at around 76% portfolio and the PSSL has grown from 9% to 16% (previously 18%) over the last four quarters. It is important to note that its PSSL is 100% invested in first-lien debt.
“Although PFLT was not in existence back then, PennantPark as an organization was, and at that time was focused primarily on investing in subordinated and mezzanine debt. Prior to the onset of the global financial crisis in September 2008, we initiated investments which ultimately aggregated $480 million, again primarily in subordinated debt. During the recession, the weighted average EBITDA of those underlying portfolio companies, declined by 7.2% at the trough of the recession. This compares to the average EBITDA decline of the Bloomberg North American High Yield Index of down 42%. As a result, the IRR of those underlying investments was 8% even though they were done prior to the financial crisis and recession. We are proud of this downside case track record on primarily subordinated debt.”
From previous call: “We underwrite as if it is the peak of the credit cycle. We do our downside cases in our investment memos assuming a recession hits next year. On average, the equity cushions from the financial sponsors are 40%, 50%. So, we’re underwriting as if we’re at the peak of the credit cycle.”
“We can be extremely selective about what we ultimately invest in. We are only investing in about 2% of the deals that we have shown. We remain primarily focused on long term value and making investments that will perform well over several years and can withstand different business cycles. Our focus continues to be on companies and structures that are more defensive, have low leverage, strong covenants and high returns.”
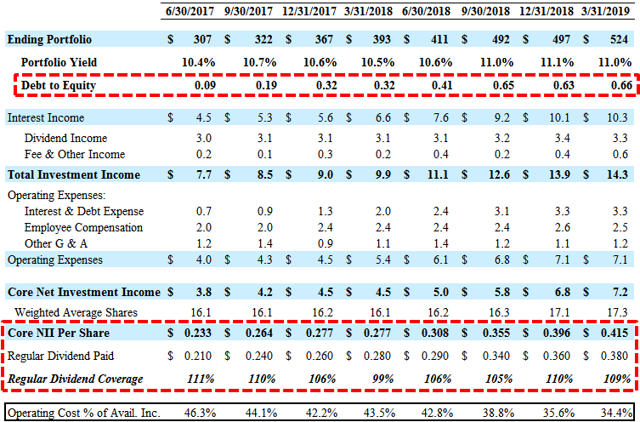
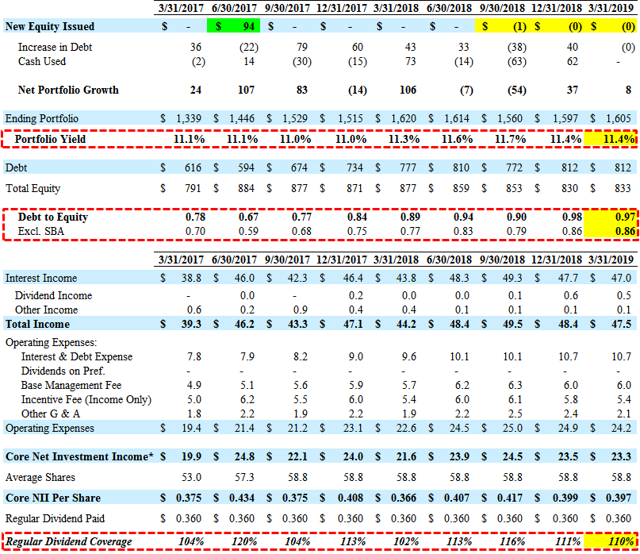
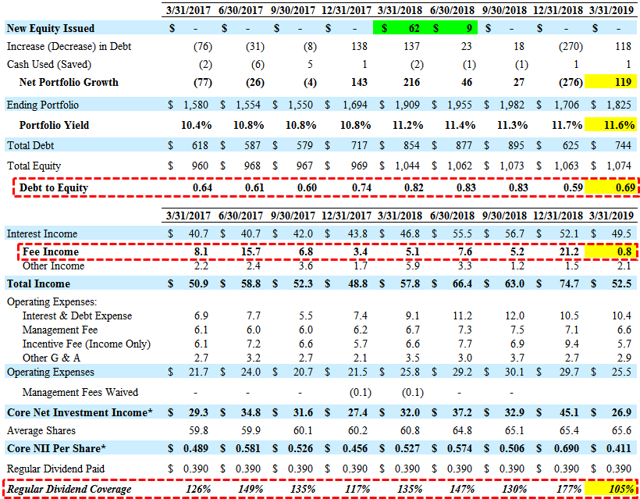
PFLT Dividend Coverage Update
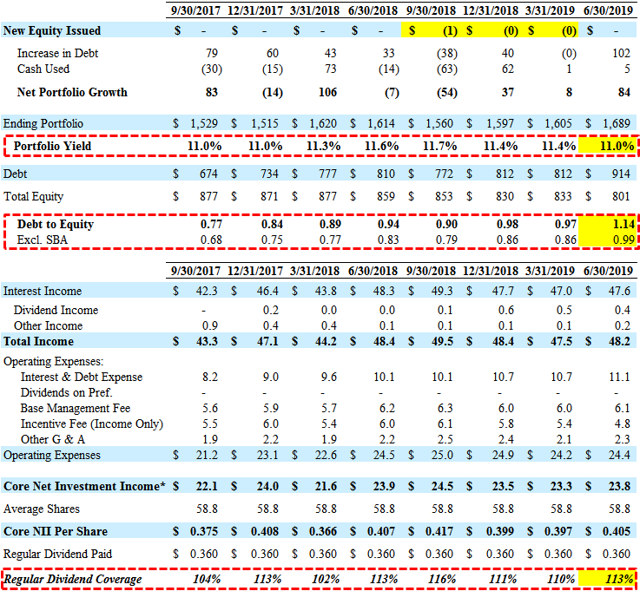
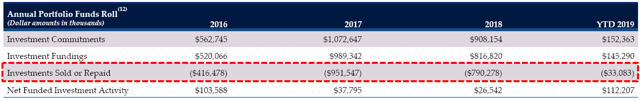
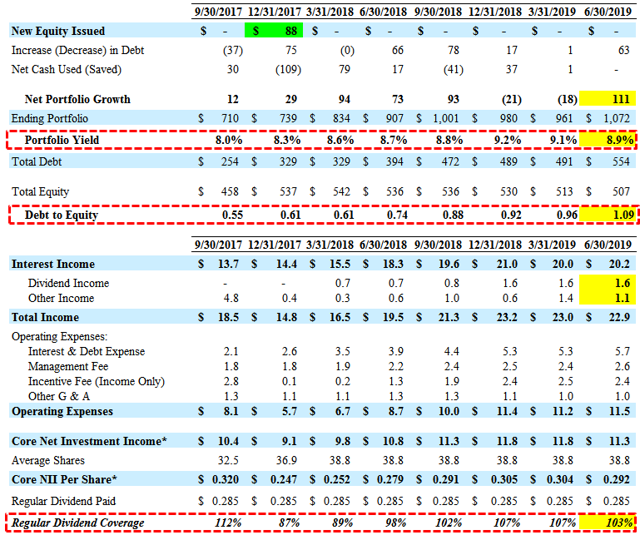
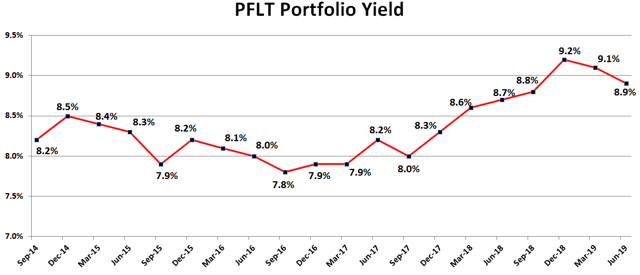
PFLT continues to increase leverage, growing its portfolio and overall yield through ramping of its PennantPark Senior Secured Loan Fund (“PSSL”).
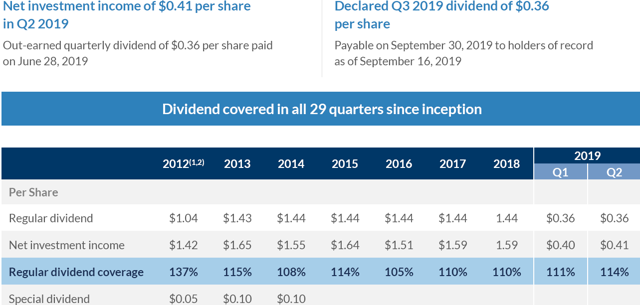
Art Penn, Chairman and CEO. “Due to our activity level and the maturation of PSSL, we are pleased that our current run rate net investment income covers our dividend. Our earnings stream should have a nice tailwind based on gradual increase in our debt to equity ratio, while still maintaining a prudent debt profile. As of September 30, our spillover was $0.31 per share.”
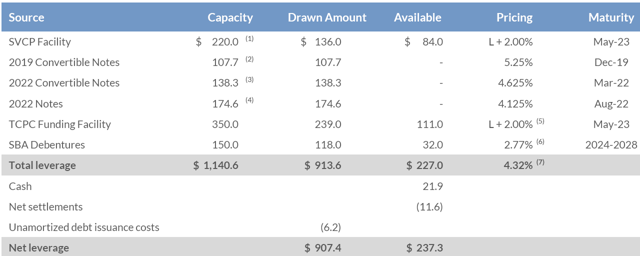
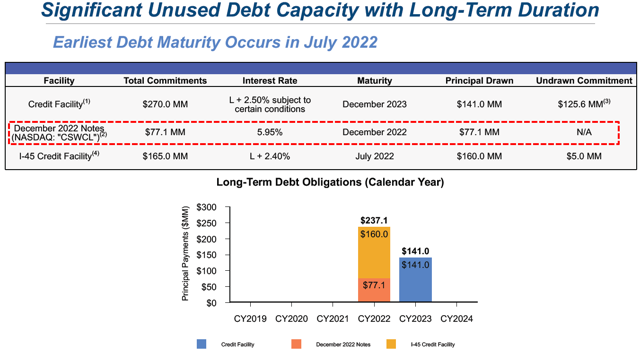
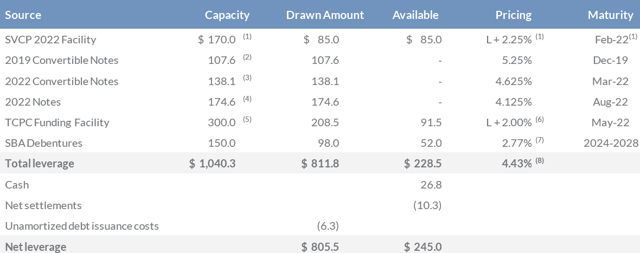
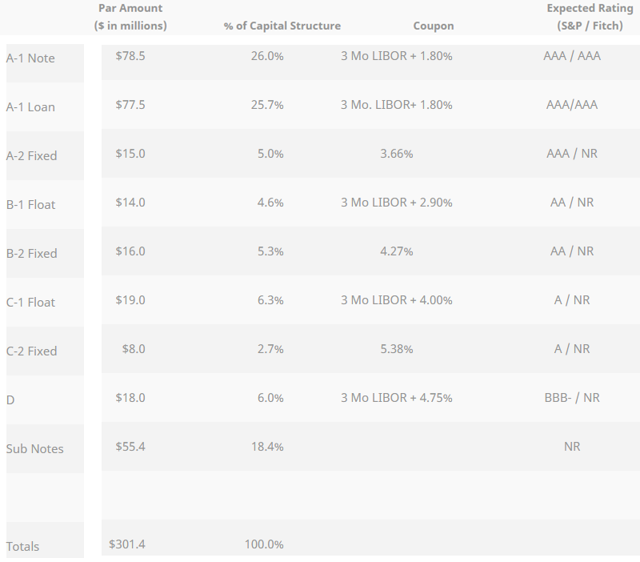
On August 26, 2019, PFLT announced that it had priced its $301.4 million debt securitization in the form of a collateralized loan obligation (“CLO”) which is a lower-cost alternative to its credit facility as well as longer-term and more flexible. The company will retain all of the Class D Notes and Subordinated Notes through a consolidated subsidiary.
“You know CLO financing, you know, has a nice long term and longer than our credit facility. So, we’re actively assessing that option, and as we, you know, think about gradually and prudently increasing leverage of that, that could be a key element of doing that really doing CLO financing, contributing assets to that, and then fraying up the revolver to finance future growth.”
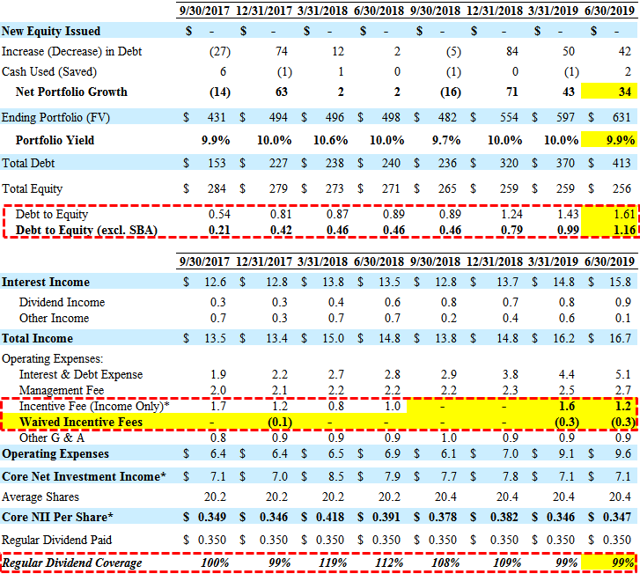
On April 5, 2018, the Board approved the application of the modified asset coverage requirements reduced from 200% to 150%, effective as of April 5, 2019. Management is targeting a debt-to-equity ratio of 1.40 to 1.70 that will “take several quarters”:
“Over time, we are targeting a debt to equity ratio 1.4 to 1.7 times. We will not reach this target overnight. We will continue to carefully invest and it may take us several quarters to reach the new target. Given the seniority of our assets, in the near-term we’re actively considering utilizing CLO financing to help achieve the target.”
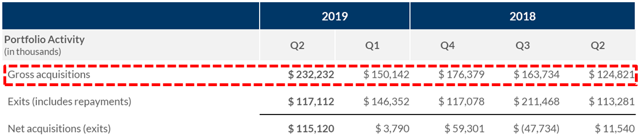
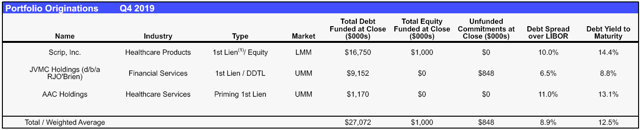
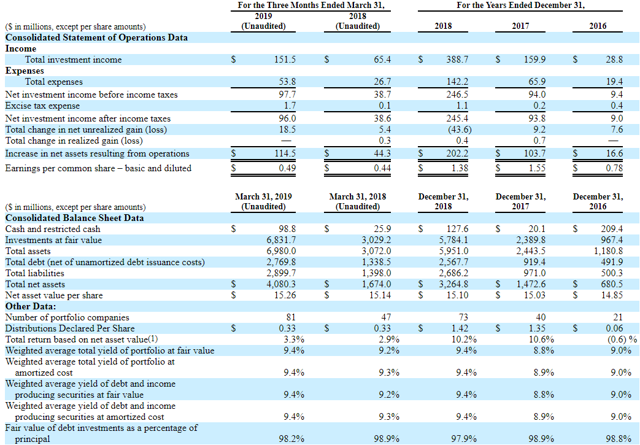
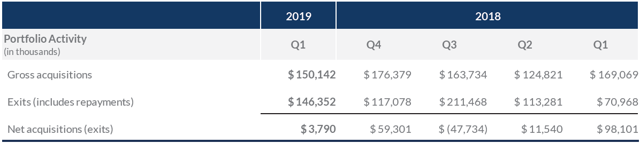
For the quarter ended June 30, 2019, PFLT reported just above base case projections with much higher-than-expected portfolio growth partially offset by continued lower portfolio yield. During the quarter, the company invested $183 million of in 14 existing portfolio companies with a weighted average yield of 9.3% with sales and repayments of $67 million. As expected, the company continues to increase leverage with a debt-to-equity of 1.09 utilizing its Board approved reduced asset coverage ratio, effective as of April 5, 2019. It should be pointed out that the company had $36.5 million of ‘payables for investments purchased’ that is not included in the current borrowing.
This information was previously made available to subscribers of Premium BDC Reports, along with:
- PFLT target prices and buying points
- PFLT risk profile, potential credit issues, and overall rankings
- PFLT dividend coverage projections and worst-case scenarios
- Real-time changes to my personal portfolio
To be a successful BDC investor:
- As companies report results, closely monitor dividend coverage potential and portfolio credit quality.
- Identify BDCs that fit your risk profile.
- Establish appropriate price targets based on relative risk and returns (mostly from regular and potential special dividends).
- Diversify your BDC portfolio with at least five companies. There are around 50 publicly traded BDCs; please be selective.