HTGC: This 10.0% Yielding Tech-Focused BDC Will Likely Increase Its Dividend

Summary

  • HTGC is currently yielding 10% with RSI of 25 indicating ‘oversold’ and will rebound at some point, especially given the potential for a dividend increase as discussed in this article.
  • Recent SEC filings for HCXY included updated portfolio information indicating slightly lower-than-expected portfolio growth and higher amounts of accretive share issuances.
  • The BDC sector has been pulling back and I have started to make purchases of select BDCs but still hoping for lower prices in the coming weeks.
  • As predicted, HTGC’s NAV per share recently increased by 5.1% due to previous share issuances and equity position in DOCU. Special Meeting for shareholders to approve higher leverage will be held on December 6, 2018.
  • On September 6, HTGC announced that the SBA issued a “green light” letter for a third SBIC license for access to additional growth capital of $175 million. Final approval is anticipated to occur by the Q1 2019.

You can read the full article at the following link:

Please read the full article at the link provided above or sign up for Premium Reports that includes updated Deep Dive Reports on each BDC including this one.


Quick HTGC & BDC Buzz History

As many readers know, I am typically a ‘Buy and Hold’ investor making additional purchases during general market pullbacks (including this one) and only selling if there are serious issues. I have been investing (on and off) in  Hercules Capital (HTGC) over the last 10 years and writing public articles on Seeking Alpha discussing the stock for over 5 years. Some of the most recent public articles were:

It should be noted that I have not made additional purchases of HTGC since March 26, 2018, at $12.03.


Quick BDC Market Update

As shown above, HTGC’s stock price has pulled back, along with other Business Development Company (“BDCs”), for the reasons discussed earlier this week in “BDC Sector Volatility Driving 10.5% Average Yield“. I am expecting continued lower BDC prices for the reasons discussed in the article including the general widening of rate spreads. Please see the end of this article for the recent changes in stock price for each BDC including HTGC that is down 8% over the last two months compared to the average BDC at a 10% decline. However, there has been a wide range of recent performance from TPG Specialty Lending (TSLX) down less that 2% for the reason discussed in “TSLX: Upcoming Special Dividends & Shareholders Overwhelmingly Approve Increased Leverage” to NEWT down almost 25%.

As shown below, the ‘BofA Merrill Lynch US Corporate B Index’ (Corp B) yield continues to rise and is now at its highest level since November 2016:

Source: FRED

The recent drop in HTGC’s stock price is not due to underlying fundamentals, but likely investor expectations of higher yields, which is not necessarily tied to higher expected defaults given the strong economic fundamentals. In fact, there is a good chance that the recent widening of yield spreads will be discussed on the upcoming earnings call as a positive tailwind for new investments and earnings in the coming quarters. HTGC will be reporting results next week and most of my personal trades are based on actual or projected changes in portfolio credit quality and dividend coverage.

Obviously, timing is important when investing, but especially with BDCs for many reasons, including opaque reporting standards, general sector volatility, and being largely retailed owned. The opaque and inconsistent reporting for BDCs often results in retail investors making poor decisions. Focusing on simple coverage of the dividend with the previous quarter net investment income (“NII”) or changes in net asset value (“NAV”) are not enough.

BDCs will begin reporting calendar Q3 2018 results this week. Please sign up for Premium Report to receive real-time notifications of changes in risk profile and dividend coverage potential for each company as they report results.


TSLX: Upcoming Special Dividends & Shareholders Overwhelmingly Approve Increased Leverage

Summary

  • There has been plenty of ‘good news’ for TSLX shareholders since my previous article which is likely responsible for the continued stock price increase and out-performance compared to the others.
  • On October 8, TSLX held a special meeting and shareholders overwhelmingly approved the proposal to allow the company to increase leverage.
  • On August 30, 2018, PennEnergy Resources, LLC agreed to acquire substantially all the assets of Rex Energy Corporation for a cash purchase price of $600.5 million driving “approximately $0.05 per share to next quarters income.”
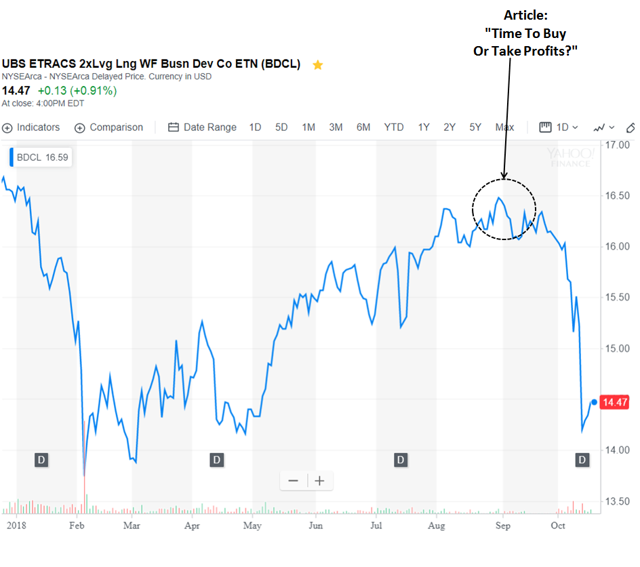
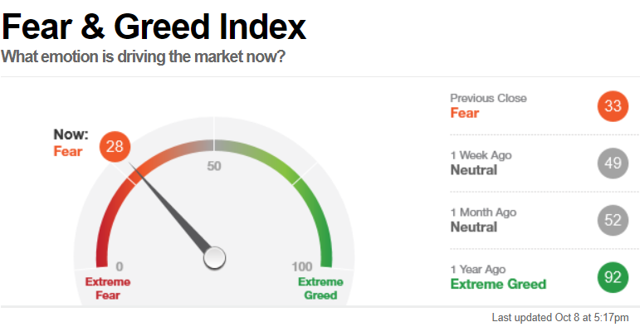
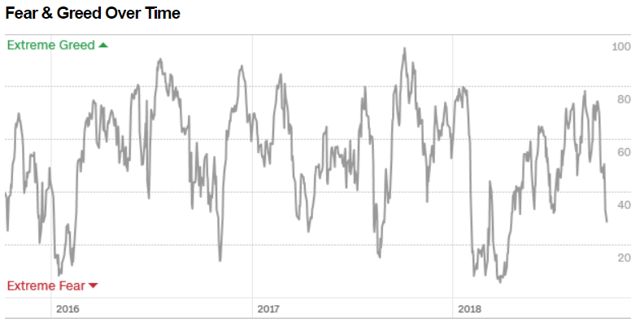
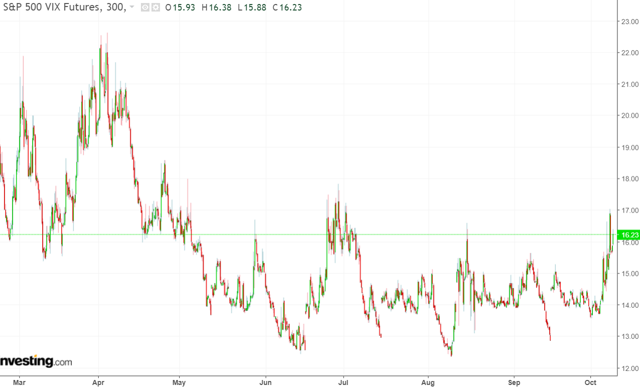
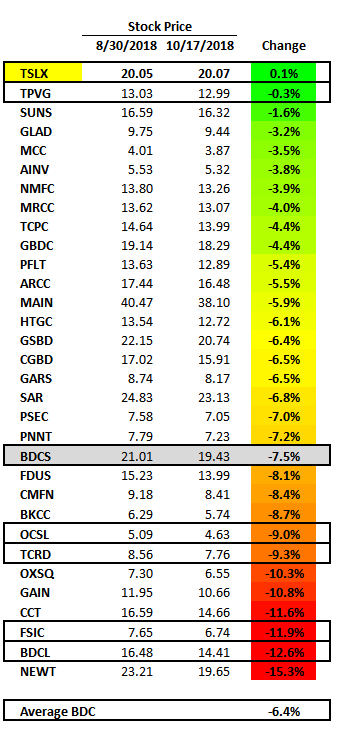
  • BDC pricing has been volatile over the last 2 to 6 weeks but higher quality companies such as TSLX have outperformed. However, I am expecting continued volatility.
  • TSLX will be paying additional special dividends for the reasons discussed in this article.


The following is a quick update that was previously provided to subscribers of Premium Reports along with target prices, dividend coverage and risk profile rankings, credit issues, earnings/dividend projections, quality of management, fee agreements, and my personal positions on all BDCs  (including this one) please see Deep Dive Reports.

TSLX Article Follow-Up:

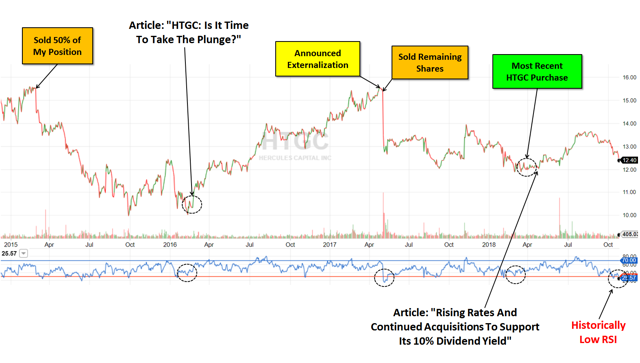
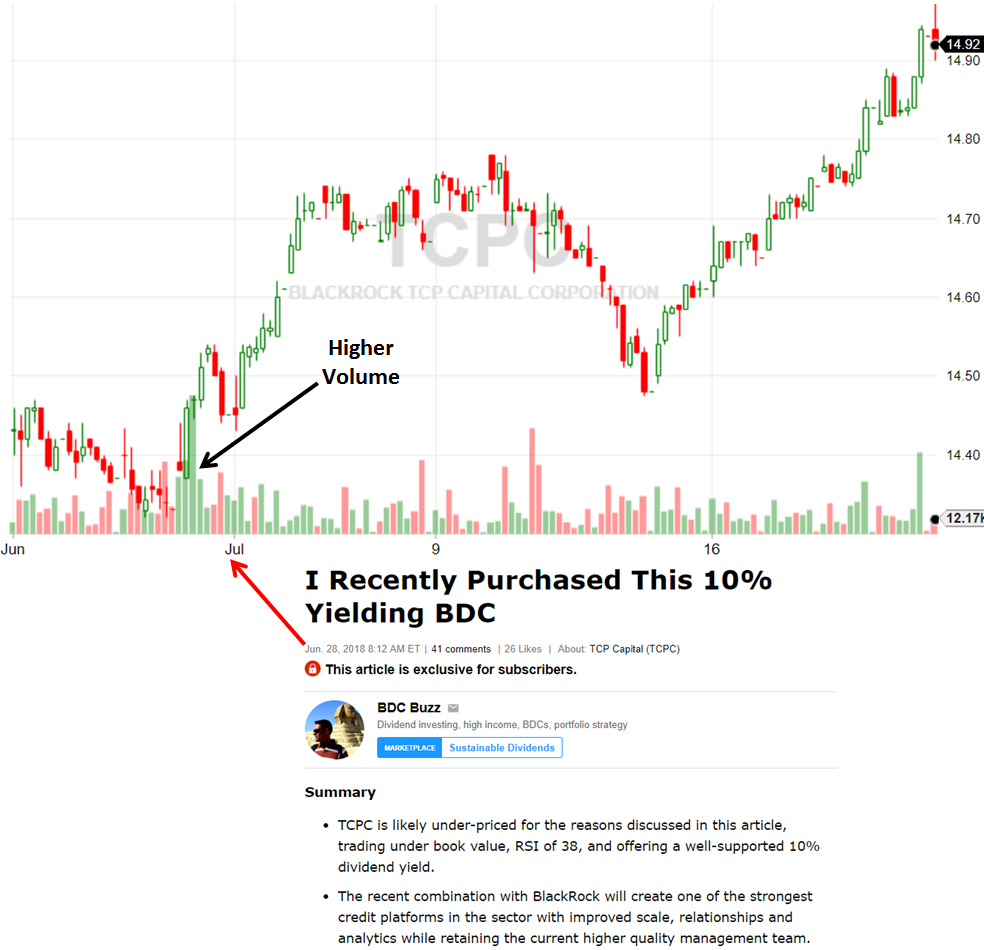
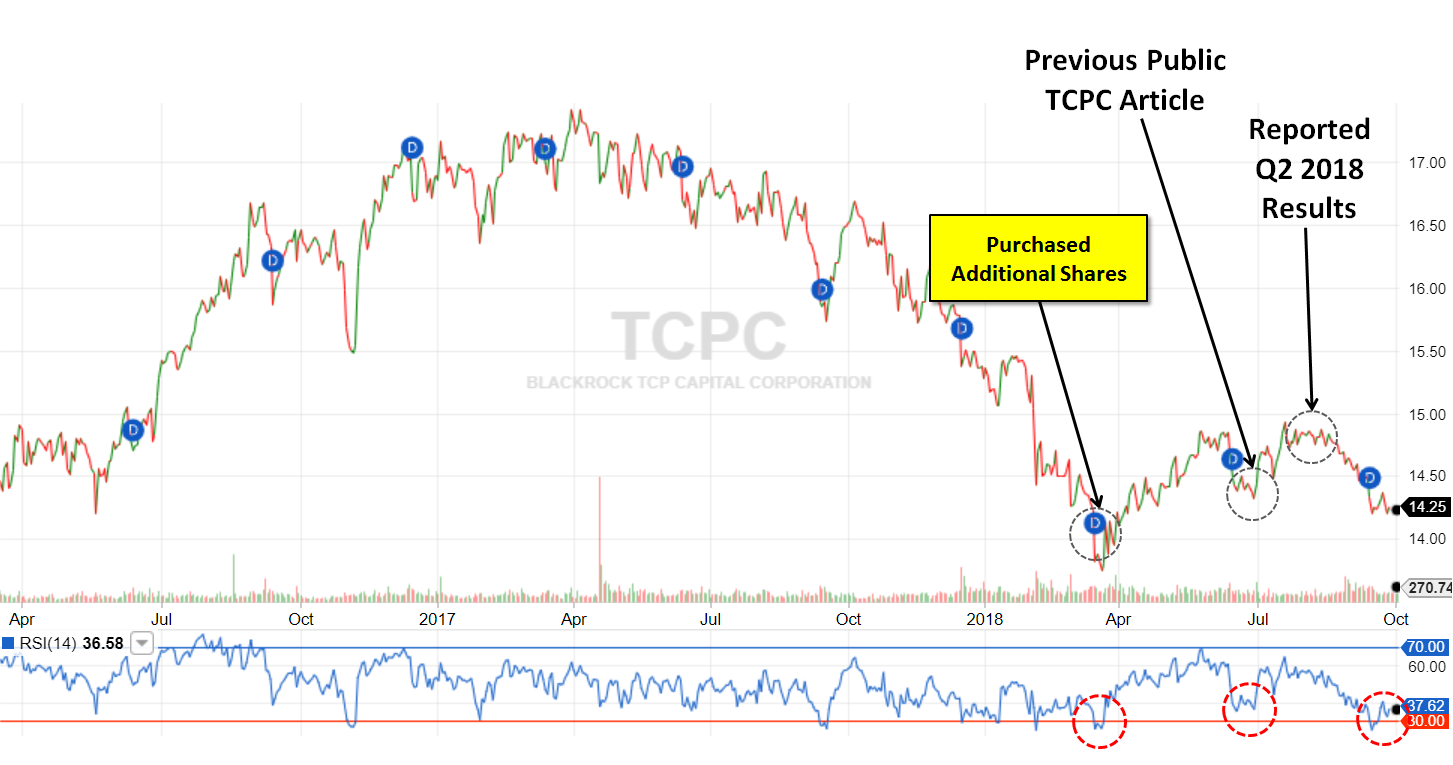
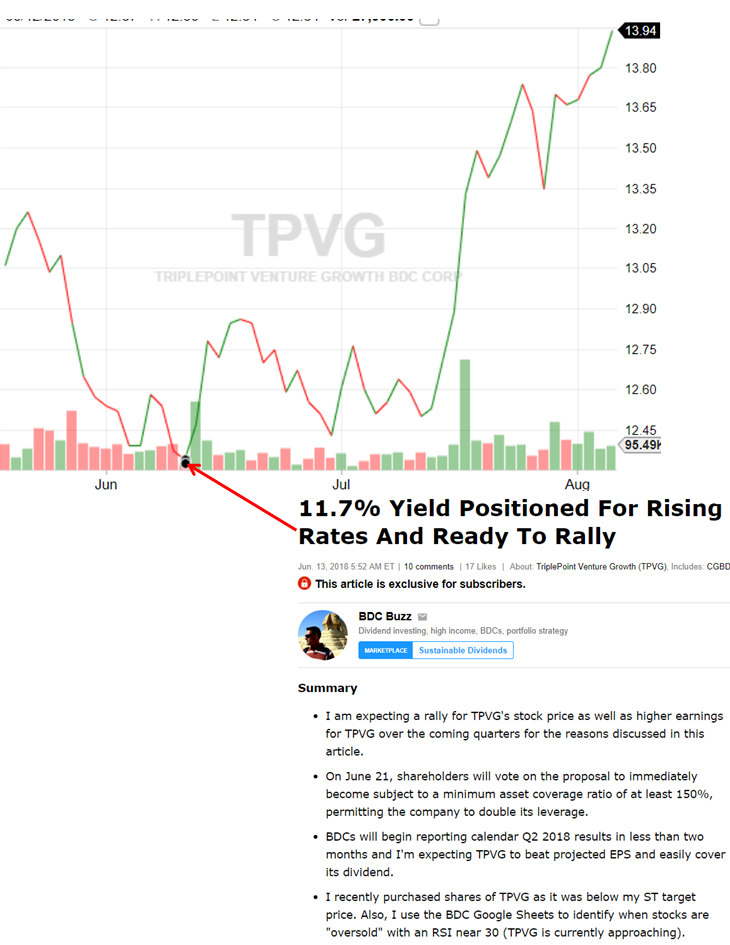
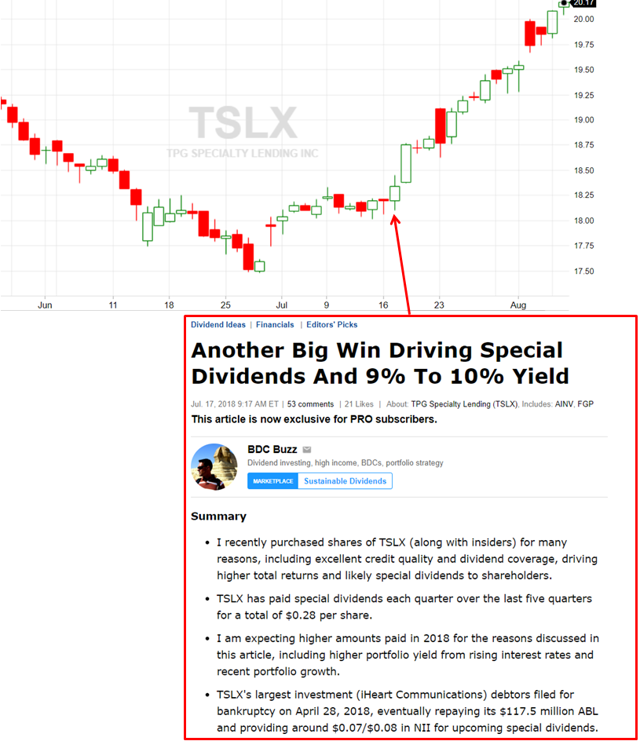
As shown in the following chart, TSLX’s stock price rebounded after my public article “Another Big Win Driving Special Dividends And 9% To 10% Yield” that discussed my reasons for purchasing shares at $17.46, after the March 2018 ex-dividend and as the Relative Strength Index or RSI dipped near 30.

There has been plenty of ‘good news’ for TSLX shareholders since my previous article (and personal purchase of additional shares) which is likely responsible for the continued rise in stock price and out-performance compared to the other BDCs.


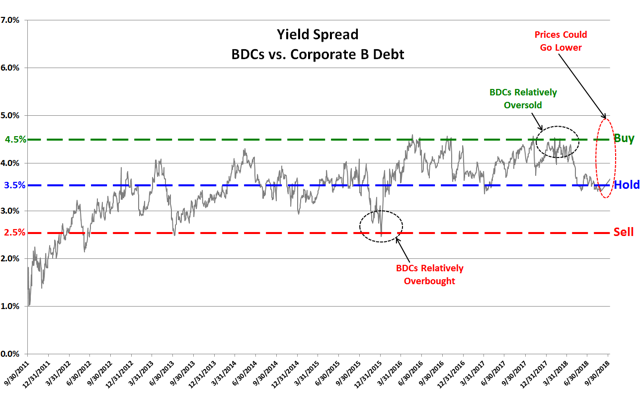
As mentioned in “Recent Volatility for BDCs“, BDC pricing has been pulling back and likely for the reasons discussed in previous updates.

TSLX Reduced Asset Coverage Ratio

On October 8, 2018, TSLX held a special meeting and shareholders overwhelmingly approved the proposal to allow the company to increase leverage by approving the application to the company of a minimum asset coverage ratio of 150% effective October 9, 2018:
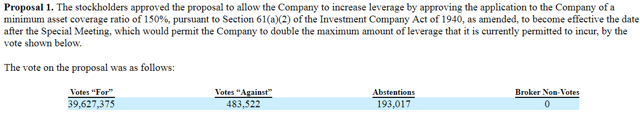
Source: 8-K Filing

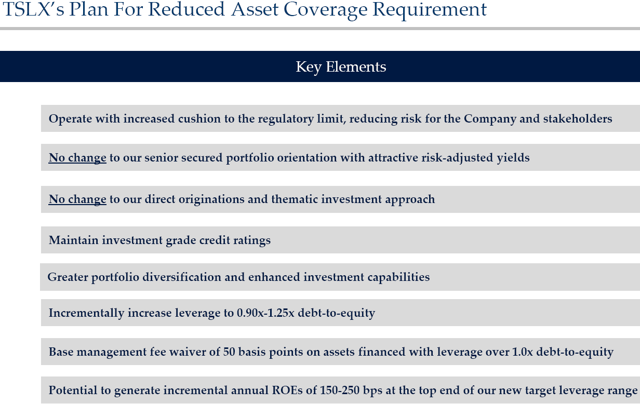
Management gave the following reasons for the ability to increase leverage:

  • Increase the regulatory cushion through a lower minimum asset coverage requirement; reduces risks for the Company and stakeholders
  • Maintain investment grade ratings with revised financial policy of 0.90x-1.25x debt-to-equity; continued access to diversified debt funding sources
  • The relative benefits of increasing the fundamental earnings power of the business outweighs the potential risks associated with greater leverage
  • Track record of strong performance; greater investment capabilities from additional flexibility to manage capital resources and enhance the diversification profile of the portfolio


TSL Advisers, LLC intends to waive a portion of the fees by reducing the management fee on assets financed using leverage over 200% asset coverage (in other words, over 1.0x debt to equity):

“Pursuant to the waiver, the Adviser intends to waive the portion of the Management Fee in excess of an annual rate of 1.0% (0.250% per quarter) on the average value of the Company’s gross assets as of the end of the two most recently completed calendar quarters that exceeds the product of (1) 200% and (2) the average value of the Company’s net asset value at the end of the two most recently completed calendar quarters.”

Source: 10-Q Filing

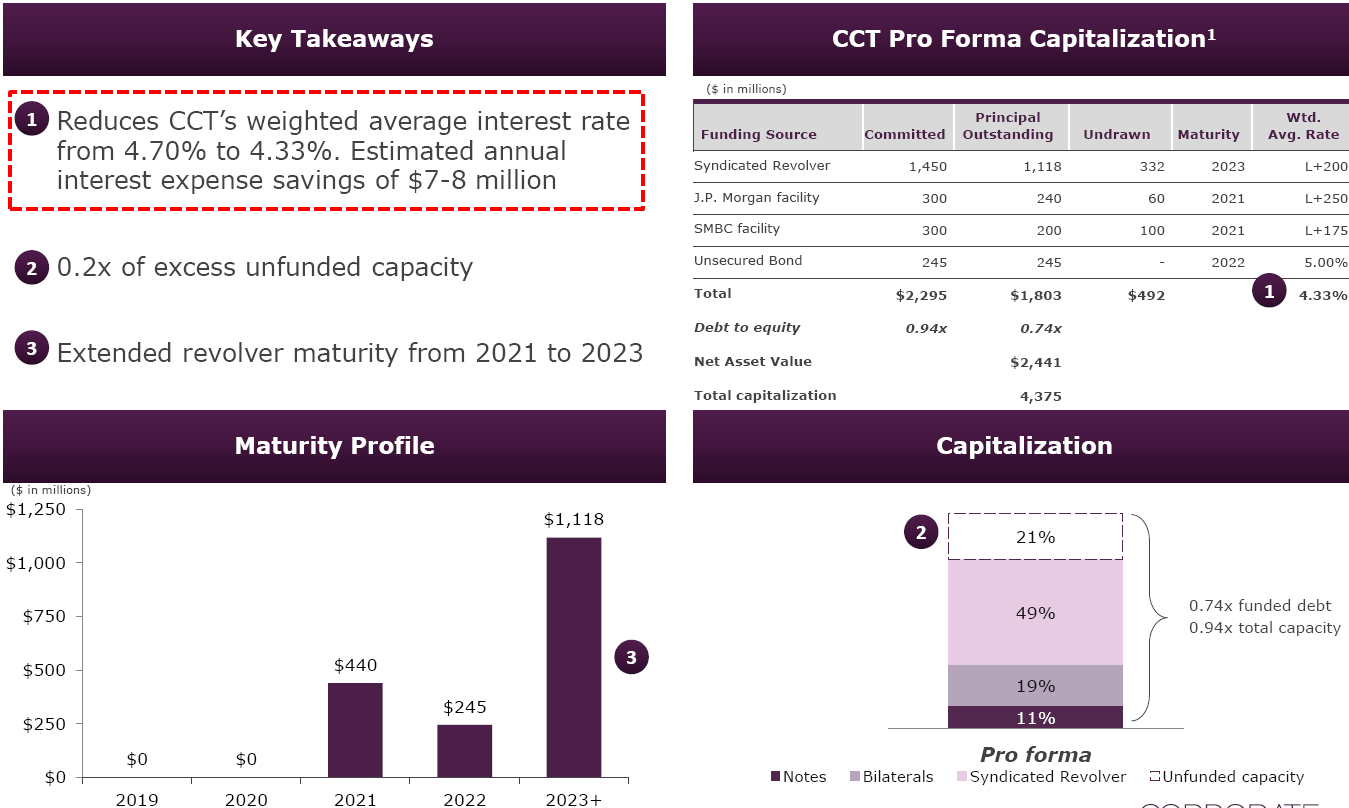
Upon the effectiveness of the lower minimum asset coverage ratio requirement, the company’s revised financial policy is to increase its target debt to equity range from 0.75x-0.85x to 0.90x-1.25x.

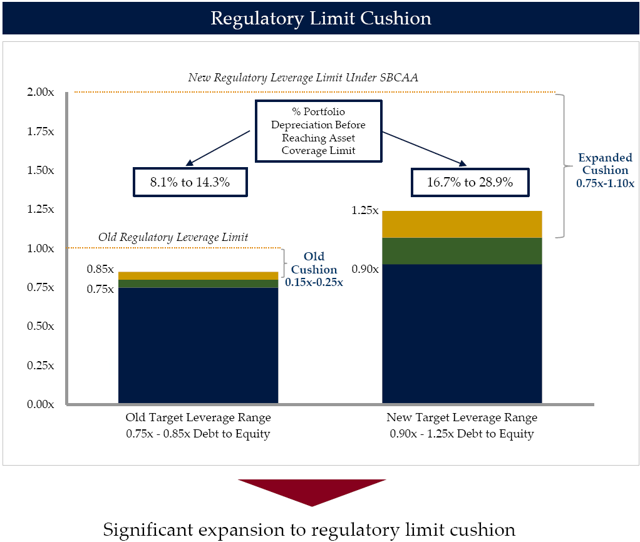
Obtaining regulatory relief in conjunction with a revised financial policy of 0.90x-1.25x debt-to-equity will allow TSLX to drive incremental ROEs while maintaining an investment grade ratings profile.

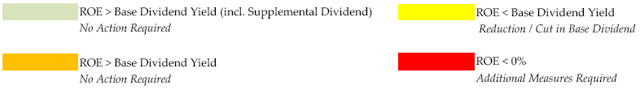
The table below illustrates the impact on ROEs at differing levels of leverage (debt-to-equity) and levels of credit losses, and highlights scenarios at which ROEs exceed book dividend yield (including and excluding the supplemental dividend), and scenarios at which ROEs are below the current base book dividend yield.

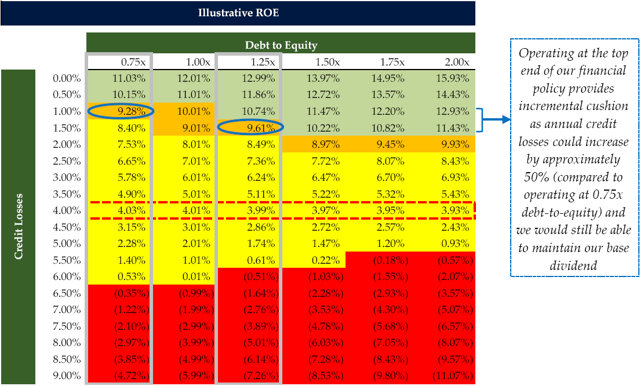
Changes to TSLX Investment Grade Ratings

The following are the investment grade ratings from Fitch, S&P and Kroll under new target leverage range of 0.90x-1.25x debt-to-equity.


Continued And Upcoming TSLX Special Dividends

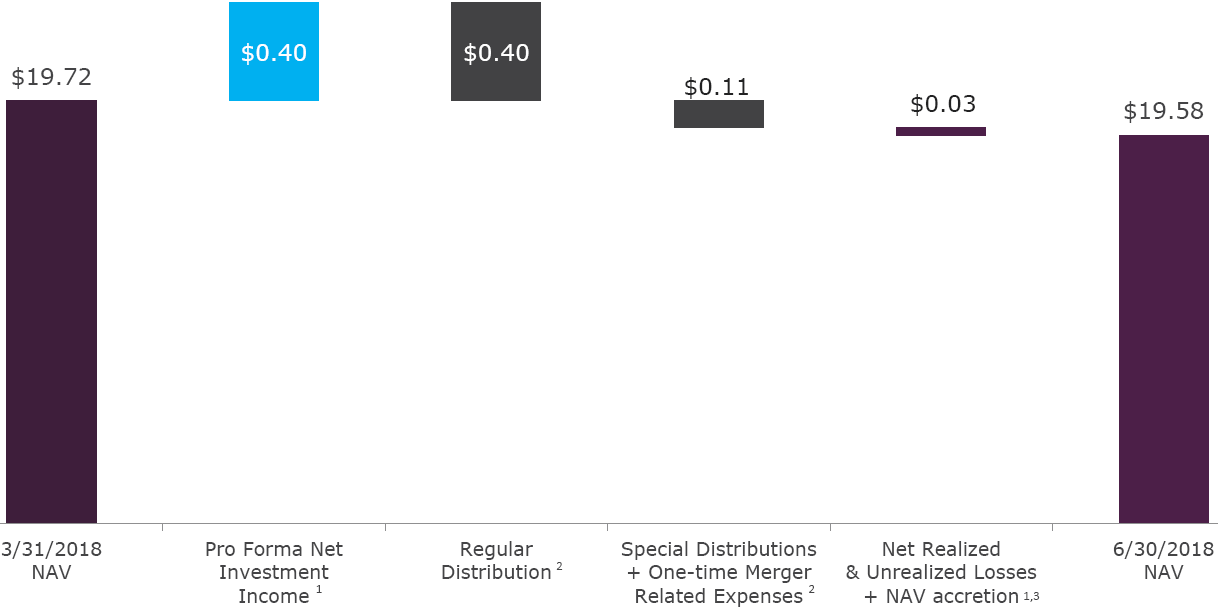
As predicted in the article linked above, TSLX recently paid a special/supplemental dividend of $0.08 per share payable in September which was above my ‘best case’ projected special dividend of $0.07 per share.

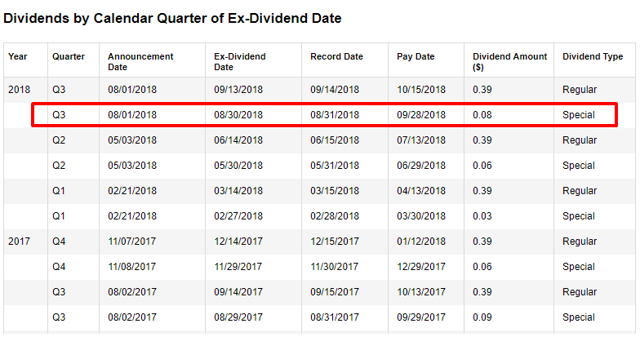
“Our Board also declared a Q2 supplemental dividend of $0.08 per share to shareholders of record as of August 31st payable on September 28. Since introducing our variable supplemental dividend framework in Q1 of 2017, we’ve declared a total of $0.36 per share as an incremental dividend as net investment income per share exceeded based dividends per share in each of the past six quarters.”

The company has covered its regular dividend by an average of 133% over the last four quarters, with undistributed taxable income and capital gains of around $70 million or $1.06 per share after taking into account supplemental dividends. I am now expecting at least $0.20 per share (previously $0.10) of supplemental dividends paid in 2018 that will most likely be higher, especially given the likelihood of “other fees” associated with the upcoming repayments. Management increased its 2018 net investment income (“NII”) guidance to $1.85 and $2.00 which is likely conservative, similar to 2017 guidance.

“Year-to-date we have generated strong annualized ROEs based on both net investment income and net income of 13.3%. We believe this reflects our strong originations platform, our ability to embed economics into our portfolio, as well as our continued focus on optimizing our capital structure through the lowest funding costs we can obtain. Given our strong year-to-date ROEs and our outlook for the remainder of 2018, we are updating the upper end of our full year 2018 NII guidance from a $1.85 per share to $2 per share.”

TSLX management continues to produce higher returns by investing in distressed companies through excellent underwriting standards that protect shareholders during worst case scenarios including call protection, prepayment fees and amendment fees backed by first-lien collateral of the assets. As predicted in the previous report, there was another meaningful increase in “other fees” income which includes prepayment fees and accelerated amortization of upfront fees associated with the bankruptcy and planned reorganization/repayment of its $117.5 million asset-based loan (“ABL”) with iHeart Communications at LIBOR+4.75.

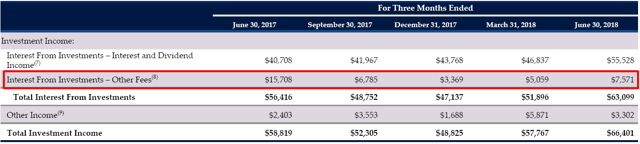
My ‘base case’ projections do not include large amounts of fee and other income related to early repayments. However, management mentioned around $0.05 to $0.06 per share of fee income reserves that will likely be recognized in Q3 2018 related to iHeart and Rex Energy that I have included in the updated projections:

“Note that our fee income this quarter reflects reserves totaling $0.05 per share or $0.06 per share on a post incentive fee basis related to two investments that Josh referenced in his opening remarks. Again we expect these reserves will be recognized into income in our Q3 results as we reach resolution on these two investments.”

iHeart Communications Update:

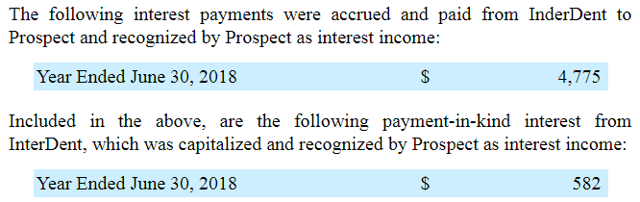
“As shared on the last call iHeart follows the Chapter 11 in late April and in June we refinance our asset based loan upon the funding of the company’s new debt in possession financing. Along with the repayment of our loan principal, we received cash payment on post-petition interest and prepayment fees totaling 3.6 million which included 592,000 of certain interest income that we reserve against. In July unsecured credit committee of iHeart had objection of certain portions of income received, which we believe to be meritless. A hearing on that objection is currently scheduled for the fall and we’re optimistic that we will be able to recognize our reserve portion of interest income of approximately $0.01 per share upon resolution of the issue pertaining to the committee’s objection.

Rex Energy Update:

On August 30, 2018, PennEnergy Resources, LLC agreed to acquire substantially all the assets of Rex Energy Corporation for a cash purchase price of $600.5 million driving “approximately $0.05 per share to next quarters income.”

“On May 18th Rex Energy filed a voluntary petition for relief under Chapter 11 of the bankruptcy code with the restructuring and support agreement between the company’s first lien inventory to the second lien. The agreement stipulates among other things that proceeds from the sale of substantially all of the company’s assets would benefit the entirety of the pre-petition firstly and obligations including ABL. Since we do not have any visibility on financial proceeds of asset sale of process during Q2, our income reflects a reserve of $3.1 million related to a portion of the Rex prepayment fee. The final bit of the sale process were due likely with an auction scheduled for August 16th. We’re optimistic that we have what it take our fee reserve off during Q3 which will contribute approximately $0.05 per share to next quarters income.”

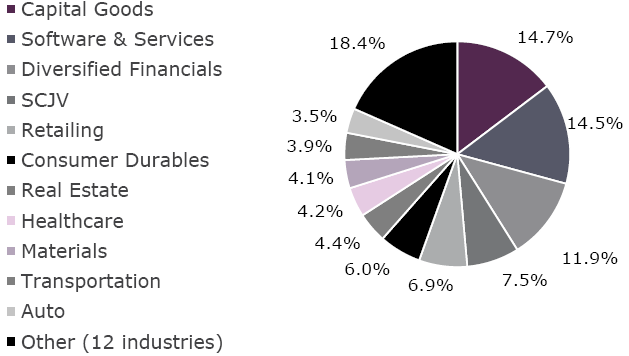
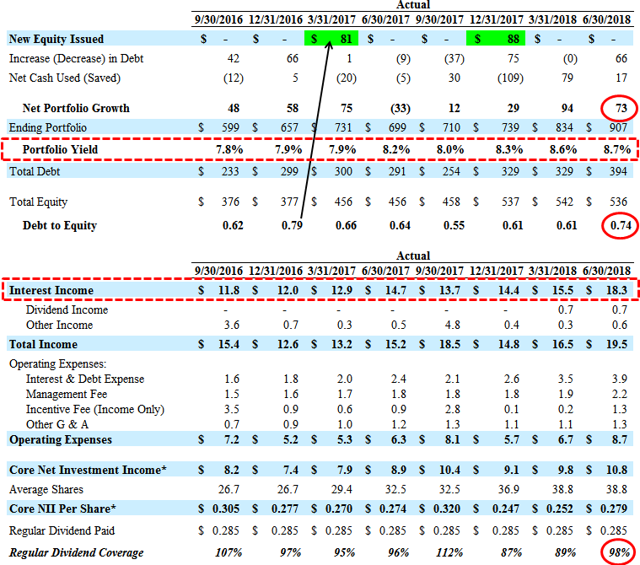
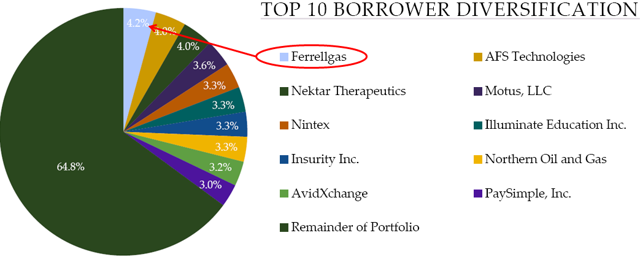
Also predicted in the previous article, TSLX made a sizable investment in Ferrellgas Partners, L.P. (NYSE:FGP) of $82.5 million during Q2 2018 which is now its largest investment and will likely drive another large special dividend.

“We continue to be thematic in our approach to originations, focus on opportunities that correspond to our platform sector expertise and relationships, as well as opportunities arising from market dislocations where our competitive advantage of size and scale given our SEC exempted release allows us to underwrite attractive risk rewards. A good example of this is the $575 million senior secured credit facility that we completed for Ferrellgas during the quarter which Josh referenced on our last call. Ferrellgas is a publicly traded distributor of propane with an enterprise value of $2.3 billion. The company has a defensive core business with high return on invested capital and a strong management team but faced refinancing difficulties given the challenging regulatory environment for banks. Due to our ability to provide a fully underwritten financing solution through co-investments from affiliated funds we were able to structure a first lien last out position at a low attach point of 0.2X at a low net leverage of 1.7X with highly attractive adjusted returns. Further as we size down our originations amount to the target hold of our portfolio we are able to drive additional economics for our shareholders through syndication income. At quarter-end our investment in Ferrellgas represented our largest position at 4.2% of the portfolio fair value.”

On May 4, 2018, FGP executed a new $575 million senior secured credit facility to replace its credit facility that was scheduled to mature in October 2018. This new facility consists of a $300 million revolving line of credit supported by commitments from TPG Specialty Lending, Inc. and PNC Bank, National Association, as well as a $275 million term loan, both priced at LIBOR + 5.75% and maturing May 4, 2023. This new senior secured credit facility is secured with substantially all of the operating partnership and its subsidiaries’ asset and FGP and the general partner’s partnership interests in the operating partnership and contains various covenants and default provisions, as well as requirements with respect to the maintenance of specified financial ratios and limitations on the making of loans and investments. It is important to note that this was another complex transaction that required TSLX’s excellent underwriting skills likely with appropriate call protection, prepayment fees and amendment fees backed by first-lien collateral of the assets and covenants some of which were detailed in the related 8-K filed by FGP.

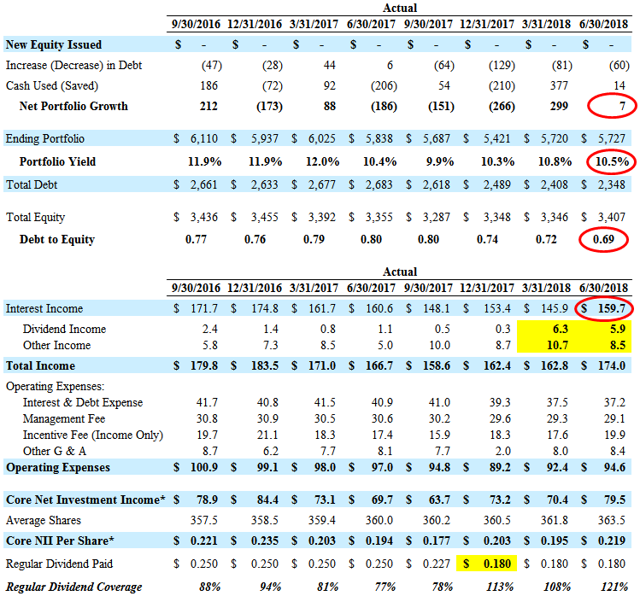
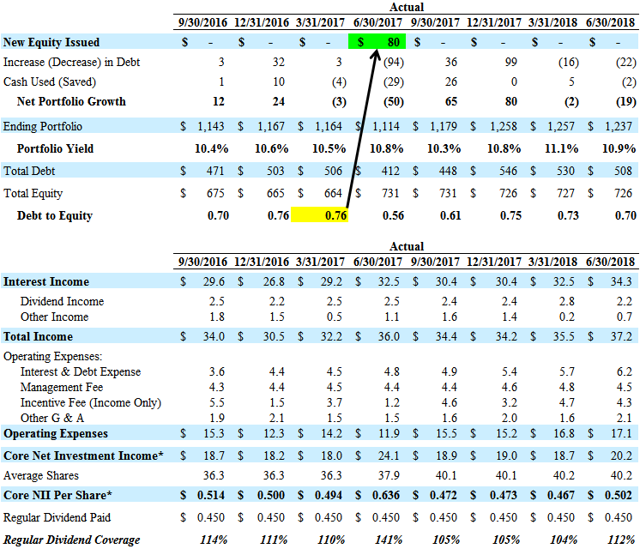
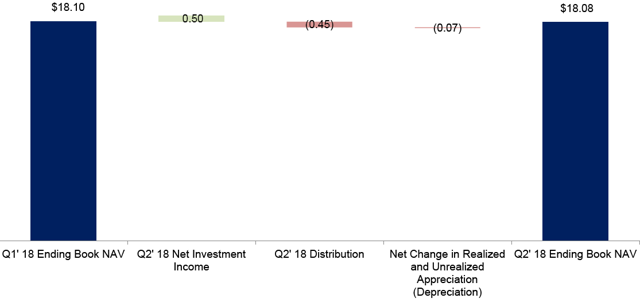
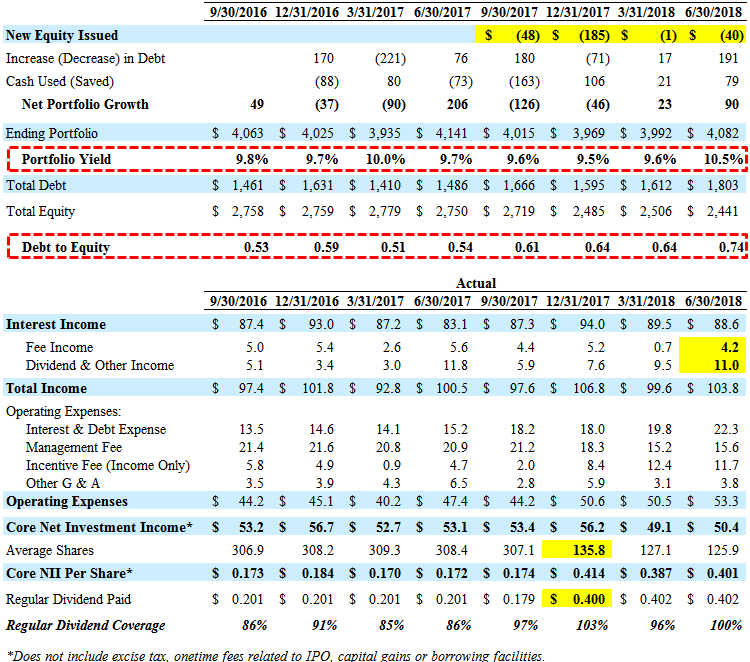
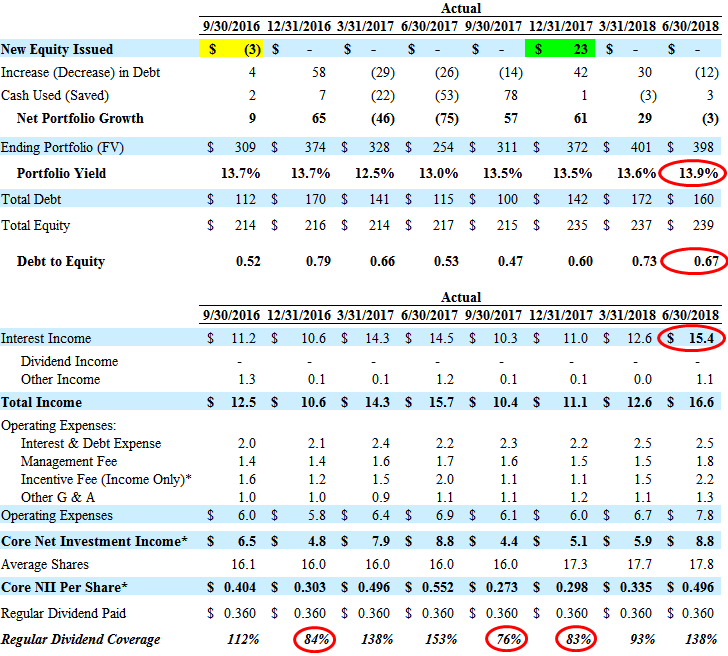
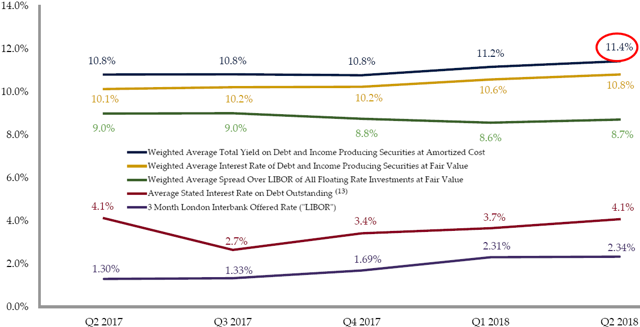
For the quarter ended June 30, 2018, beat my best case projections covering its dividend by 147% due to increased portfolio yield from 11.2% to 11.4% and higher fee and “other income” as discussed earlier.

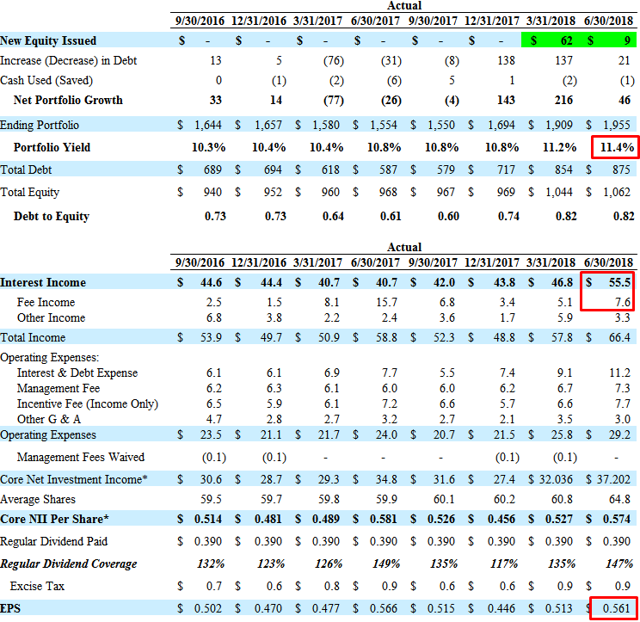
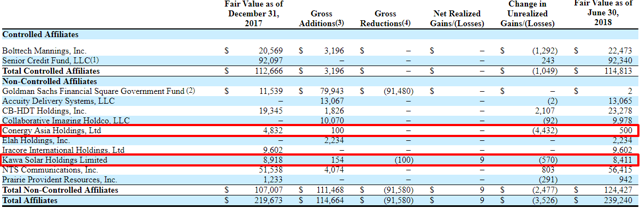
TSLX’s credit platform continues to outperform on many levels including much higher-than-expected portfolio growth during Q2 2018 driving higher earnings. As shown in the table below, the company experienced lower amounts of sales/repays.

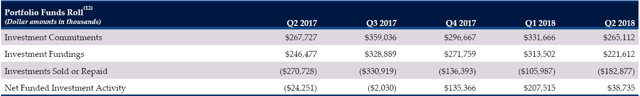
Some of the primary reasons for historically higher returns include strong financial covenants and call protections that protect shareholders during higher amounts of prepayments and worst case scenarios.

“Despite recent competitive dynamics we remain committed to high documentation standards and meaningful terms that provide robust downside protection. At quarter-end we maintained effective voting control on 84% of our debt investments, an average of 2.3 financial covenants per debt investment consistent with historical levels. As for managing prepayment risk, the fair value of our portfolio as a percent of call protection is 95.6% which means that we have protection in the form of additional economics so our portfolio get repaid in the near term.”

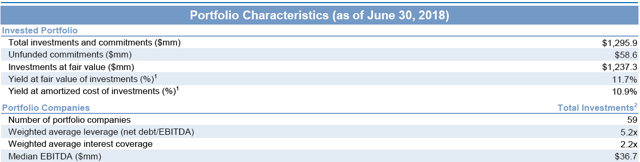
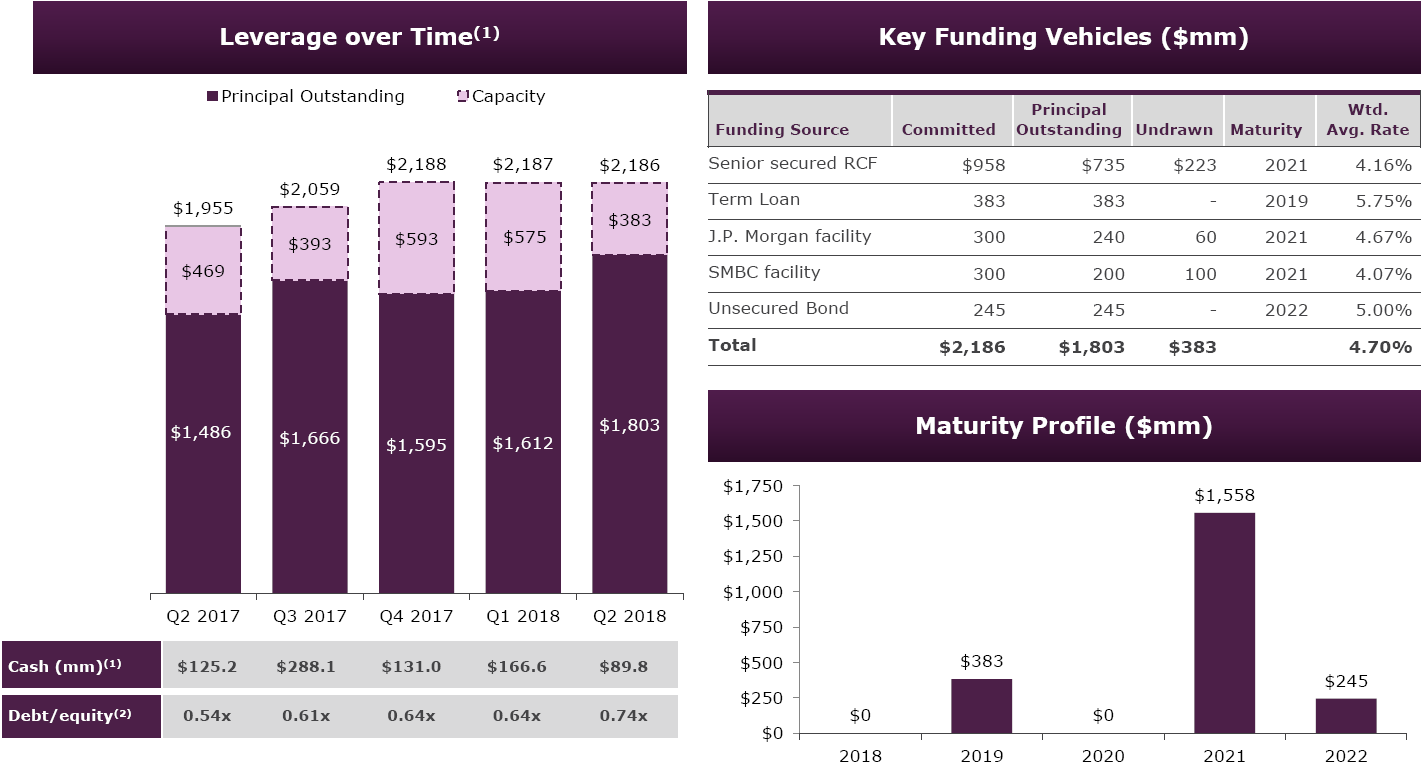
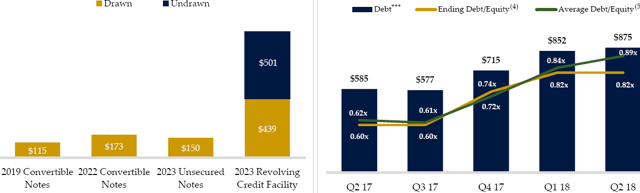
However, it also important to point out that the company is able to cover dividends with recurring sources as discussed by management on previous calls. The company is currently near the higher end of its targeted leverage (debt-to-equity of 0.75 to 0.85) with $501 million available on its credit facility for portfolio growth in the coming quarters.

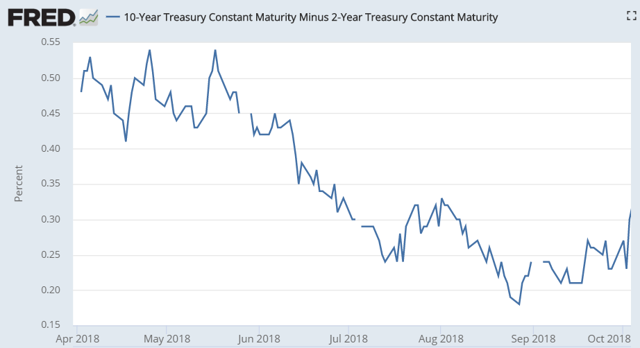
Interest Rate Sensitivity Analysis

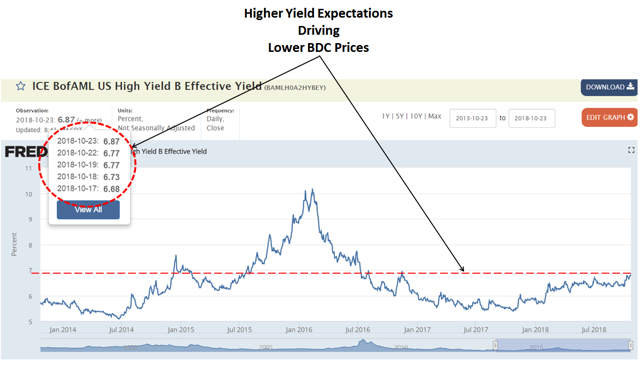
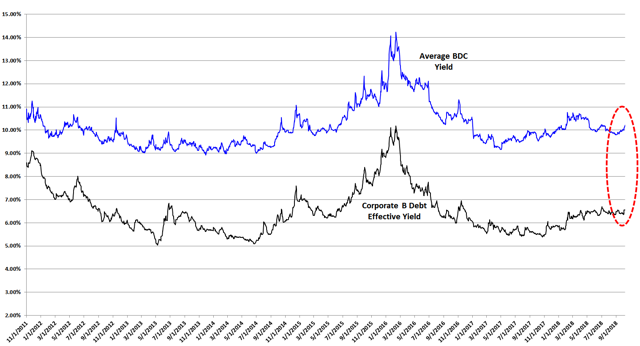
Interest rate sensitivity refers to the change in earnings that may result from changes in interest rates. Most BDCs continue to experience higher portfolio yields mostly due to the rising LIBOR that should improve (or at least maintain) net interest margins and dividend coverage for the sector in the coming quarters.
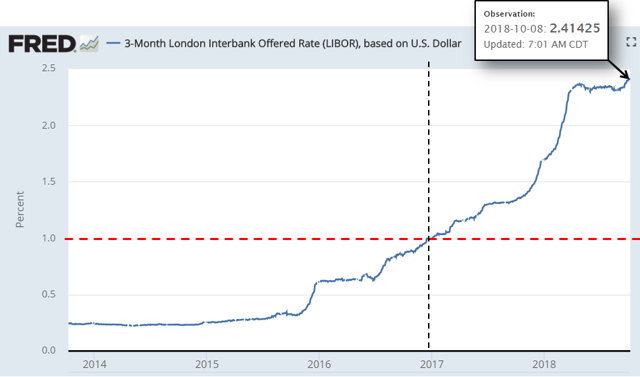
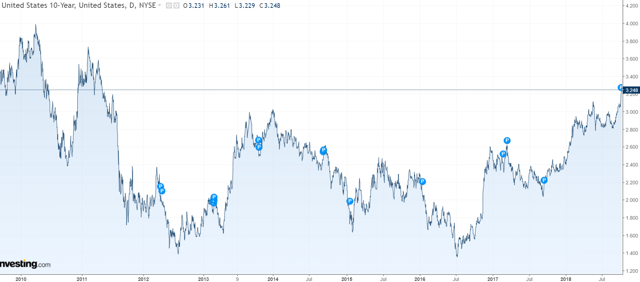
Source: FRED

The Fed is still expected to hike rates again on December 19, 2018, and it is important to note that there is lag/delay between the rise in the underlying interest rate of a loan and higher interest income received by the BDC as discussed on the previous Apollo Investment (AINV) call:

The weighted average yield on our portfolio at cost increased by 20 basis points to 10.7%, primarily due to increases in LIBOR, partially offset by the repayment of higher yielding assets. During the quarter, one-month LIBOR increased approximately 30 basis points and ended the quarter at 1.9%. Since we’ve more floating rate assets than floating rate liability, an increase in LIBOR generally is positive for us. However, as LIBOR increases, there is usually a lag effect before we see the full impact of the interest than we received from our borrowers as borrowing rates generally reset monthly or quarterly.
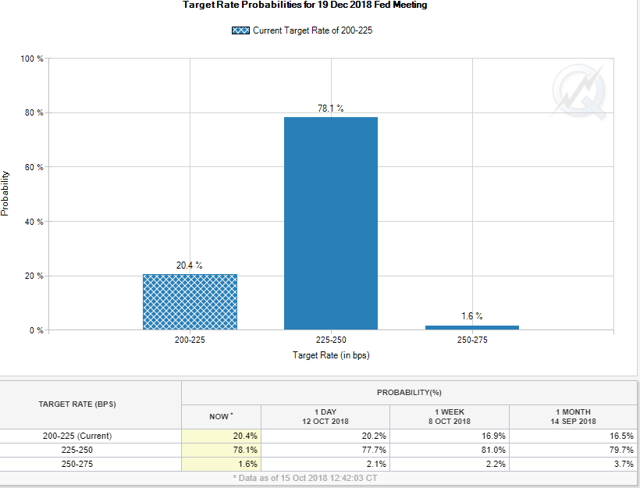
Source: CME Group

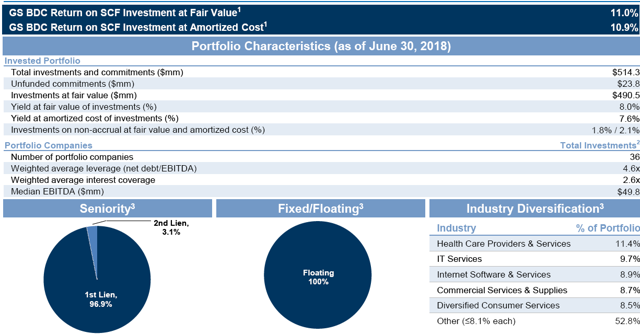
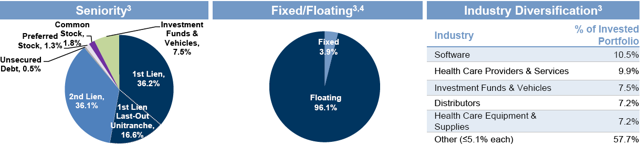
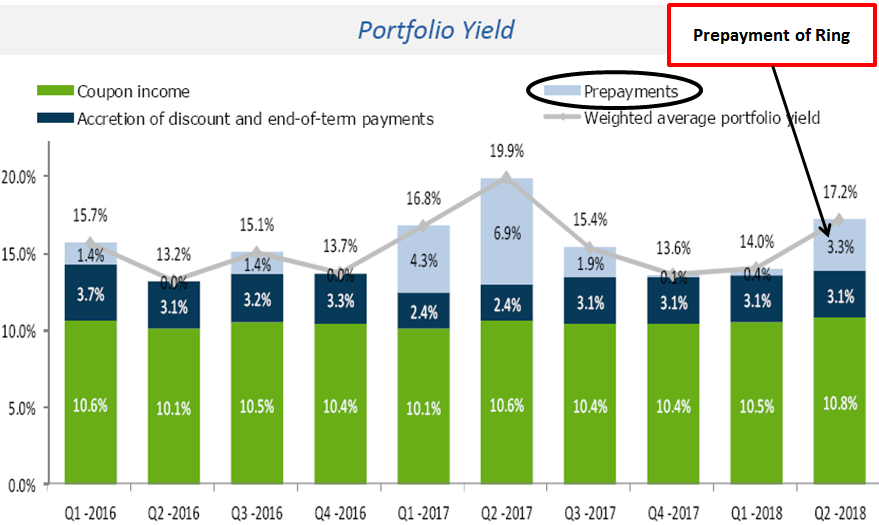
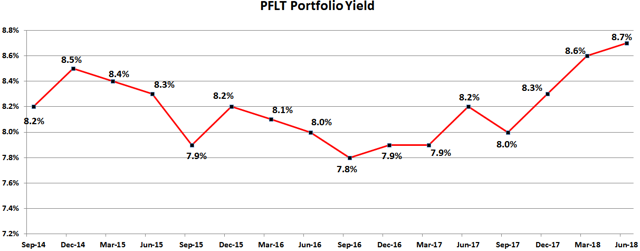
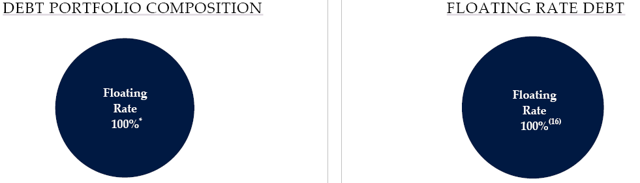
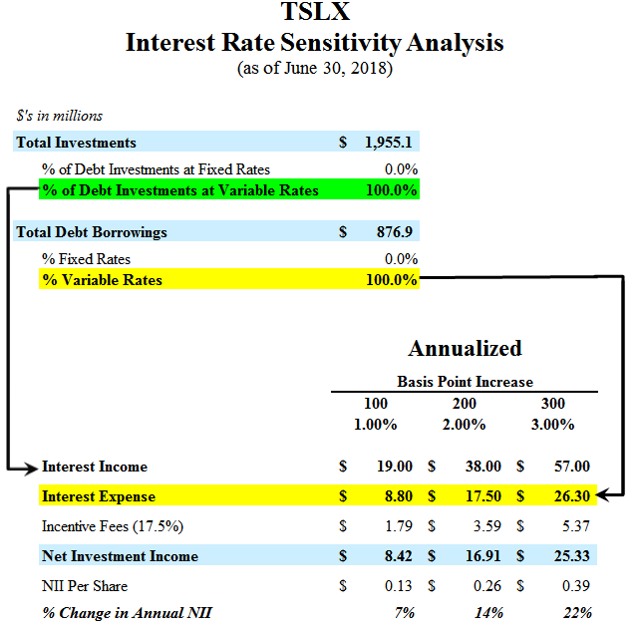
As of June 30, 2018, 100% of TSLX’s portfolio debt investments bore interest at variable rates, most of which are subject to interest-rate floors. During Q2 2018, there was another increase in portfolio yield (from 11.2% to 11.4%) due to increased LIBOR and higher yields on new investments compared to sales and repayments:

At June 30th the weighted average total yield on our debt and income producing securities at amortized cost was 11.4% compared to 11.2% at March 31st. This increase was due to the upward movement and the effective LIBOR on our portfolio — debt portfolio as well as the impact on high yields on new versus exited debt investments. The weighted average yield that amortize cost on new and exited debt investments during the second quarter were 11.2% and 10.5% respectively.

However, 100% of borrowings were also at variable rates. During Q2 2018, the company increased the amounts of its unsecured 2022 notes to $172.5 million likely in preparation of reducing its asset coverage ratio. In February 2018, the company reduced the pricing on its revolving credit facility (from LIBOR + 2.00% to LIBOR + 1.875 and in January 2018, the company issued $150 million of 4.50% five-year senior unsecured notes. It should be noted that 100% of TSLX’s borrowings are at variable rates (based on LIBOR) but the company is adequately positioned for rising interest rates due to ‘match funding’ with 100% of debt investments at variable rates.

This quarter on the debt side opportunistically reopening our 2022 convertible notes and increasing the total principal amount outstanding from $115 million to $172.5 million. The transaction price to the slight premium to par resulting in a swap adjusted pricing on the upsized portion of LIBOR of approximately 160 basis points which is well inside the swap adjusted spread on both the original notes and the spread on our secured revolver. We executed this transaction because it allowed us to improve our unsecured funding mix with no material impact on our weighted average cost of debt and therefore minimal drag on our pro forma ROEs.

I consider TSLX to have averagepositioning for rising interest rates.

TSLX Summary

I will continue to purchase additional shares of TSLX (especially during general market pull backs) for many reasons, including excellent credit quality and dividend coverage driving higher total returns and additional special dividends to shareholders over the coming quarters due to:

  • October 8, shareholder approval for increased leverage.
  • Increased portfolio yield and growing net interest margins.
  • $0.05/$0.06 per share of fee income reserves that will be recognized in Q3 2018 related to iHeart Communications and Rex Energy.
  • Continued higher-than-expected portfolio growth.
  • Its “opportunistic” investment in Ferrellgas Partners that will likely drive another large special dividend.

For target prices, dividend coverage and risk profile rankings, credit issues, earnings/dividend projections, quality of management, fee agreements, and my personal positions on all BDCs  (including this one) please see Premium Reports.

Recent Volatility for BDCs


Readers may have noticed the recent volatility in pricing for business development companies (“BDCs”). Please see “BDC Market Update: October 9, 2018” that briefly discussed current yield spreads, sector oversold/overbought measures, and recently improved BDC fundamentals including higher portfolio yields, improved net interest margins, improvements in underlying general economic fundamentals including unemployment rate, labor force participation, consumer consumption and corporate earnings.

However, I am expecting temporarily lower BDC prices for the reasons discussed in the update including the widening of rate spreads and general market volatility driving ‘flight to safety’.

As mentioned in 14.5% Yielding ETN: Time To Buy Or Take Profits?:

“The UBS ETRACS Business Development Company ETN (BDCS) and UBS ETRACS 2X Leveraged Business Development Company ETN (BDCL) are exchange traded notes that continue to under-perform the average BDC for a few reasons but mostly related to index allocations and “tracking fees.”

BDCL has declined by over 12% since the article as shown below:

However, BDC pricing has been pulling back and likely for the reasons discussed in the update linked above.

It should be noted that many of the BDCs that I consider to be ‘higher quality’ have outperformed the others during this pullback including TriplePoint Venture Growth (TPVG) discussed last month in “Stable 11% Yield With Pre-IPO VC Tech Exposure For Higher Returns“.

Many of the BDCs that I have warned investors about have been under-performing such as Oaktree Specialty Lending (OCSL) in “High-Yield BDC Sector Return And Expense Ratios” that discussed why the company was overpriced, THL Credit (TCRD) in “13.2% Yield At Risk Of Upcoming Dividend Cut” and FS Investment Corp. (FSIC) discussed last week in “Why I Sold This 11.1% Yielding BDC“.

Q3 2018 BDC Reporting

Obviously, timing is important when investing, but especially with BDCs for many reasons, including opaque reporting standards, general sector volatility, and being largely retailed owned. The opaque and inconsistent reporting for BDCs often results in retail investors making poor decisions. Focusing on simple coverage of the dividend with the previous quarter net investment income (“NII”) or changes in net asset value (“NAV”) are not enough.

BDCs will begin reporting calendar Q3 2018 results later this month. Please sign up for Premium Report to receive real-time notifications of changes in risk profile and dividend coverage potential for each company as they report results.

PSEC: Improved Dividend Coverage With Increased Risk

Summary

  • The following is a quick update that was previously provided to subscribers of Premium Reports on August  28, 2018.
  • The good news is that I have upgraded PSEC and increased its ST target price. However, portfolio mix and credit quality continue to decline.
  • As predicted, there were large markdowns in Pacific World and InterDent offset by larger markups in the riskier portions of the portfolio including “real estate, CLO, consumer finance”.
  • During calendar Q2 2018, PSEC’s NAV per share increased by $0.12 primarily due to over ever-earning the dividend by $0.04 and continued markups in NPRC and First Tower. NPRC is marked $312 million over cost.
  • Dividend coverage improved mostly due to the expected increase in yields from its CLOs related to the resets/refinancings, driving higher net interest margins. Also, CLOs now account for almost 17% of the portfolio.
  • Non-accruals increased to 5.4% of the portfolio cost (2.5% at FV) mostly due to adding a portion of Pacific World which needs to be watched along with InterDent as these account for $1.00 or 11% of NAV per share.

The following is a quick update that was previously provided to subscribers of Premium Reports on August  28, 2018. For target prices, dividend coverage and risk profile rankings, credit issues, earnings/dividend projections, quality of management, fee agreements, and my personal positions on all BDCs  (including this one) please see Deep Dive Reports.

For Q2 2018, PSEC reported between my base and best case projections with quarterly NII of $0.219 covering 121% of its monthly dividends for the quarter. There was lower-than-expected net portfolio growth of only $7 million with an expected decline in its portfolio yield from 10.8% to 10.5%. However, there was a meaningful increase in interest income mostly due to higher yields from its CLOs:

As shown in the following table and discussed below, there was an increase in the yields from its collateralized loan obligation (“CLO”) residual interests mostly due to the expected resets/refinancings driving higher net interest margins:

“Since June 30, 2017 through today, one of our structured credit investments [CLOs] has completed a refinancing to reduce liability spreads, and 19 additional structured credit investments have completed multi-year extensions of their reinvestment periods (with most resulting in reduced liability spreads as well as higher asset spread possibilities from longer weighted average life tests). We believe further upside exists in our structured credit portfolio through additional refinancings and reinvestment period extensions, and are actively working on such transactions.”

It should be noted that the rate of defaults for PSEC’s CLO investments continue to increase but are still below the average:

Net asset value (“NAV”) per share increased by 1.3% or $0.12 per share (from $9.23 to $9.35) due to over-earning the dividend by $0.04 and net unrealized gains of almost $41 million. A majority of the markups (over $37 million) during the quarter were related to the riskier portions of the portfolio including “real estate, CLO, consumer finance” offset by expected markdowns in Pacific World Corporation and InterDent, Inc. as discussed later:

“For the June 2018 quarter, our net increase in net assets resulting from operations was $114.3 million, or $0.31 per share, an increase of $0.17 from the March 2018 quarter as a result of an increased NII and a net increase in the fair value of our portfolio, including investments in the real estate, CLO, consumer finance, and other sectors.”


As mentioned in the recently updated BDC Risk Profiles report, changes in NAV per share are not always a clear indicator of credit issues because there are many items that impact NAV. Also, it is important to recognize the difference between “realized” and “unrealized” gains and losses. PSEC continues to have net realized losses each year offset by unrealized gains, historically from control investments as shown below:


As shown in the following table, control investments on average are marked well above cost compared to the rest of the portfolio:


As predicted in the previous report, PSEC had meaningful markdowns in its investments of Pacific World Corporation and InterDent, Inc. during the recent quarter and were among the few control investments were meaningful unrealized losses for the year. However, these investments still account for around $363 million or $1.00 of the current NAV per share.


Also predicted, PSEC marked down its Term Loan B with Pacific World Corporation by another $21 million and added it to non-accrual status. However, the revolving credit line and Term A loan are still accruing and contributing to dividend coverage and need to be watched. Previously, PSEC marked down its Term A and B loans to Pacific World and on June 15, 2018, made a $15 million convertible preferred equity investment (marked to zero fair value) in the company which is now considered a “controlled investment”.

“As of June 30, 2018, Prospect’s investment in Pacific World is classified as a control investment. As a result, the valuation methodology for the TLA changed to remove the income method approach and incorporate the waterfall approach. The fair value of our investment in Pacific World decreased to $165,020 as of June 30, 2018, a discount of $63,555 to its amortized cost, compared to a discount of $30,216 to its amortized cost as of June 30, 2017. Our investment in Pacific World declined in value due to a decrease in revenues and profitability, as well as a decrease in comparable company trading multiples.”

It should be noted that PSEC recognized $4.8 million of interest income through June 30, 2018, and on August 1, 2018, purchased from a third party $14 million of “First Lien Senior Secured Term Loan A and Term Loan B Notes issued by InterDent, Inc.” at par.

“Following our assumption of assuming control, Prospect exercised its rights and remedies under its loan documents to exercise the shareholder voting rights in respect of the stock of InterDent, Inc. and to appoint a new Board of Directors of InterDent, all the members of which are our Investment Adviser’s professionals. As a result, as of June 30, 2018, Prospect’s investment in InterDent is classified as a control investment.”

As mentioned in the previous report, PSEC recently extended its loans to InterDent which were past due as well as being marked down during the previous quarter “but still marked near cost and likely overvalued”. During calendar Q2 2018, PSEC assumed control of Interdent and marked it down an additional $11 million.

“As of June 30, 2018, Prospect’s investment in InterDent is classified as a control investment. As a result, the valuation methodology changed to remove the income method approach and incorporate the waterfall approach. The fair value of our investment in InterDent decreased to $197,621 as of June 30, 2018, a discount of $15,080 to its amortized cost, compared to a discount of $1,268 to its amortized cost as of June 30, 2017. The decline in fair value was due to lower projected future earnings as a result of customer attrition.”

Non-accruals increased to 5.4% of the portfolio at cost and 2.5% at fair value mostly due to adding a portion of its investment in Pacific World as discussed earlier as well as recent markups in United Sporting Companies, Edmentum Ultimate Holdings and USES Corp. as shown below.

PSEC has portfolio concentration issues including its top 10 investments accounting for around 42% of the portfolio. However, this is an improvement from the recent quarter due to the sale of $180 million of its senior notes with Broder Bros., Co. during the recent quarter but still accounts for 4.7% of the portfolio:

One of my primary concerns is the amount of equity investments that continues to increase accounting for almost 17% of the portfolio:


PSEC continues to grow its REIT portfolio, National Property REIT Corp.(“NPRC”), and currently has a fair value of $312 million or 162% over cost basis which has helped to offset previous losses from other portfolio investments.


I consider PSEC to have a higher risk portfolio due to the previous rotation into higher yield assets during a period of potentially higher defaults and later stage credit cycle concerns, CLO exposure to 16.8% combined with real-estate 14.2%, online consumer loans of 4.2%, consumer finance of 10.2% and energy, oil & gas exposure of 3.0%. As mentioned in previous reports, S&P Ratings also considers the CLO, real-estate and online lending to be riskier allocations that currently account for over 35% of the portfolio.


On August 1, 2018, PSEC extended its secured credit facility and slightly reduced the pricing from LIBOR+2.25% to LIBOR+2.20%. However, the company does not typically use its lower cost facility with only $37 million outstanding as of June 30, 2018.


“On August 1, 2018, we completed an extension of the Revolving Credit Facility (the “New Facility”) for PCF, extending the term 5.7 years from such date and reducing the interest rate on drawn amounts to one-month Libor plus 2.20%. The New Facility, for which $770 million of commitments have been closed to date, includes an accordion feature that allows the Facility, at Prospect’s discretion, to accept up to a total of $1.5 billion of commitments. The New Facility matures on March 27, 2024. It includes a revolving period that extends through March 27, 2022, followed by an additional two-year amortization period, with distributions allowed to Prospect after the completion of the revolving period. Pricing for amounts drawn under the Facility is one-month Libor plus 2.20%, which achieves a 5 basis point reduction in the interest rate from the previous facility rate of Libor plus 2.25%. Additionally, the lenders charge a fee on the unused portion of the credit facility equal to either 50 basis points if more than 60% of the credit facility is drawn, or 100 basis points if more than 35% and an amount less than or equal to 60% of the credit facility is drawn, or 150 basis points if an amount less than or equal to 35% of the credit facility is drawn.”

Other Subsequent Events:

“During the period from July 13, 2018 to July 16, 2018, we made follow-on first lien term loan investments of $105,000 in Town & Country Holdings, Inc., to support acquisitions.”

BDC Market Update: October 9, 2018

Summary

  • BDC fundamentals continue to improve including higher portfolio yields, improved net interest margins, improvements in underlying general economic fundamentals including unemployment rate, labor force participation, consumer consumption and corporate earnings.
  • However, I am expecting temporarily lower BDC prices for the reasons discussed in this update including widening of rate spreads and general market volatility driving ‘flight to safety’.
  • The current yield spread with Corp B is around 3.7% and could go higher, similar to Q1 2018 closer to 4.5%. I will likely be waiting to make BDC purchases.
  • I have recently updated the Deep Dive reports for most of the BDCs considered a ‘Strong Buy’. I suggest reading these reports and being ready to make purchases of BDCs that fit your risk profile.
  • As shown in the BDC Google Sheets, the average RSI for BDC’s is almost 32 implying BDCs are oversold.

Interest Rate Spreads:

Please read Investopedia discussion of net interest rate spreads:

“In simple terms, the net interest spread is like a profit margin. The greater the spread, the more profitable the financial institution is likely to be; the lower the spread, the less profitable the institution is likely to be. While the federal funds rate plays a large role in determining the rate at which an institution lends immediate funds, open market activities ultimately shape the rate spread.”

BDC pricing is often volatile which can be a good thing for investors that know what and when to buy. We are finally starting to experience wider interest rate spreads which drives counter-intuitive pricing for BDCs. Management for most BDCs have been patiently waiting for higher yields on new investments which is often driven by wider interest rate spreads. However, the market is now expecting higher yields from investments such as BDCs during a period when the fundamentals are improving.

We have previously experienced windows of wider spreads and higher quality BDCs typically have much higher portfolio growth during these periods as they take advantage of higher market yields. The counter-intuitive pricing refers to: this is usually the time when investors are discounting pricing for BDC stocks. Higher quality BDCs only invest in lower leveraged companies that are able to support debt payments and have strong covenants to protect shareholders during worst-case scenarios.

Also, there have been continued improvements in the underlying economic fundamentals including unemployment rate, labor force participation, consumer consumption and corporate earnings.

Are BDCs Overbought or Oversold?

I closely watch the yield spreads between BDCs and other investments including the ‘BofA Merrill Lynch US Corporate B Index’ (Corp B). Yield spreads are important to monitor as they can indicate when a basket of investments is overbought or oversold compared to other yield-related investments. However, general market yields can change at any time. Also, spreads change depending on perception of risk and these are only averages that then need to be assigned a range for assessing individual investments/BDCs. BDCs can be volatile and timing is everything for investors that want to get the “biggest bang for their buck” but still have a higher quality portfolio that will deliver consistent returns over the long-term.

As you can see, the average BDC yield is currently trending higher:


The following chart uses the information from the previous chart showing the average yield spread between BDCs and Corp B. I consider BDCs oversold when the yield spread approaches 4.5% higher and overbought when it is closer to 2.5%.

The average BDC is currently yielding around 10.2% compared to Corp B closer to 6.5% for a current yield spread of 3.7%. However, there is a chance that this spread could increase over the coming weeks implying lower prices for the average BDC.


As shown below, the yield spread between junk bonds and safer investment grade corporate bonds is currently lower than previous months but currently headed higher.

“While this spread is historically high, it is low compared to recent history and suggests that investors are pursuing higher risk strategies.”

Improved economic conditions have meant that junk bonds are being perceived as less risky.


U.S. Treasury Yields:

As shown below, the 10-year U.S. treasury yield is now above 3.2% and headed higher in pre-market:

The spread between 10 and 2-year treasuries has finally started to increase:

Fear & Greed Index:

The market seems to be headed into ‘fear’ territory:


The S&P Volatility Index (“VIX”) futures are headed higher in pre-market:


GSBD: Q2 2018 Results – Beats Best Case & Reduced Management Fees

Summary

  • For Q2 2018, GSBD beat best case projections covering its dividend by 112% (average coverage of 113% over the last 8 quarters).
  • Its $9 million first-lien position in Kawa Solar Holdings was added to non-accrual and marked down by $0.7 million during Q2 2018 and is the only investment with ‘Rating 4’.
  • Conergy Asia Holdings was also marked down by around $5.3 million in Q2 2018 “due to its capital condition” contributing to the slight decline in NAV per share.
  • On June 15, 2018, shareholders approved the reduced asset coverage ratio of at least 150% potentially allowing a debt-to-equity of 2.00.
  • Management has agreed to reduce its base management fee from 1.50% to 1.00% which would be among the lowest in the sector and I will include in the updated projections.

The following is a quick update that was previously provided to subscribers of Premium Reports on August  2, 2018. For target prices, dividend coverage and risk profile rankings, credit issues, earnings/dividend projections, quality of management, fee agreements, and my personal positions on all BDCs  (including this one) please see Deep Dive Reports.

For Q2 2018, Goldman Sachs BDC (GSBD) beat my best case projections covering its dividend by 112% with a slight decline in portfolio investments and yield (from 11.1% to 10.9%). GSBD has covered its dividend by an average of 113% over the last 8 quarters and is now below its previous target leverage of 0.75. On June 15, 2018, shareholders approved the reduced asset coverage ratio of at least 150% potentially allowing a debt-to-equity of 2.00.

Management has agreed to reduce its base management fee from 1.50% to 1.00% which would be among the lowest in the sector to help offset potentially lower yielding assets and I will include in the updated projections.

Is Senior Credit Fund (“SCF”) return on investment declined to 11% (previously 12%) and the overall size of the SCF portfolio remained mostly stable and continues to be the company’s largest investment at 7.5% of total investments at fair value.

Credit quality remained stable and non-accruals remain low at 0.7% and 0.8% of the portfolio fair value and cost, respectively. Its $9 million first-lien position in Kawa Solar Holdings was added to non-accrual and marked down by $0.7 million during Q2 2018 and is the only investment with a ‘Rating 4’ in the following table:

Conergy Asia Holdings was also marked down by around $5.3 million in Q2 2018 “due to its capital condition” contributing to the slight decline in net asset value (“NAV”) per share from $18.10 to $18.08. However, this investment has now been mostly written off with a current fair value of $0.5 million as shown in the table below.

From 10-Q: “Net change in unrealized appreciation (depreciation) in our investments for the three and six months ended June 30, 2018 was primarily driven by the unrealized depreciation in Conergy Asia Holdings, Ltd. due to its capital condition.”

The portfolio remains heavily invested in first-lien debt including its SCF as shown below:

For target prices, dividend coverage and risk profile rankings, credit issues, earnings/dividend projections, quality of management, fee agreements, and my personal positions on all BDCs  (including this one) please see Deep Dive Reports.

TCPC: This Stable 10.1% Yielding BDC Is A Strong Buy At These Levels

Summary

  • TCPC is a higher quality BDC and is currently trading lower (below book value) for the reasons discussed in this article.
  • There is a very good chance that the stock price for TCPC will rally especially after the company reports Q3 2018 results 5 weeks from now.
  • Lower stock prices will likely drive additional share repurchases limiting downside for investors.

You can read the full article at the following link:

Please read the full article at the link provided above or sign up for Premium Reports that includes updated Deep Dive Reports on each BDC including this one.

I consider to BlackRock TCP Capital (TCPC) to be one of the most undervalued business development companies (“BDCs”) given its history and potential dividend coverage, supported by a higher quality portfolio and management as discussed in this article.

TCPC Article Follow-Up:

As mentioned in “I Recently Purchased This 10% Yielding BDC“:

“I recently purchased additional shares of TCPC at a price of $14.22 before the March 2018 ex-dividend date and have already earned $0.72 per share in dividends (including $0.36 paid tomorrow). The Relative Strength Index or RSI is an indicator that I use after selecting a BDC that I would like to purchase, but waiting for a good entry point. Currently, TCPC has an RSI of 38 as shown below and in my BDC Google Sheets indicating that the stock is becoming ‘oversold’ or ‘undervalued’ as discussed below. However, it should be noted that there are currently quite a few BDCs with RSI’s below 40.”

The following is the chart from the previous TCPC article linked above:

After the article, TCPC’s share price increased closer to $15 as shown below:

However, the stock price has fallen back to $14.25 with an RSI of 38:

What Happened?

As shown above, TCPC reported Q2 2018 results on August 8, 2018, with its net asset value (“NAV”) per share declining by $0.29 per share or 1.9% (from $14.90 to $14.61) due to net unrealized losses of $20.5 million (or $0.35 per share) from:

  • $7.3 million on its investment in Kawa Solar Holdings
  • $4.5 million on its investment in Real Mex
  • $3.3 million on its investment in AGY Holdings
  • $3.0 million on its investment in Green Biologics

It should be noted that the recent NAV decline from was from unrealizedlosses and these investments have been discussed in my previous TCPC articles and on the recent earnings call…….

Please read the full article at the link provided above or sign up for Premium Reports that includes updated Deep Dive Reports on each BDC including this one.


CCT: June 2018 Results – Lowered Borrowing Rates

Summary

  • For Q2 2018, CCT hit my base case projections with dividend and fee income of $15 million (compared to projected $11 million) and covered its dividend and repurchased almost 2.5 million shares.
  • FS/KKR Advisor announced a new $3.435 billion credit facility L+1.75% to 2.00% that should add $0.02 per share of quarterly NII for CCT.
  • NAV per share declined by $0.14 or 0.7% (from $19.72 to $19.58) mostly due to the special dividend of $0.10125 per share and of “one-time listing/merger expenses”.
  • Non-accruals have been mostly retail/energy and recently decreased to 1.5% of portfolio FV due to exits/restructuring. ZGallerie, LLC was added to non-accrual status during the quarter.
  • Portfolio credit metrics continue to decline from the previous quarters, including cash flow leverage and coverage ratios,and need to be watched.


The following is a quick update that was previously provided to subscribers of Premium Reports on August  9, 2018. For target prices, dividend coverage and risk profile rankings, credit issues, earnings/dividend projections, quality of management, fee agreements, and my personal positions on all BDCs  (including this one) please see Deep Dive Reports.

For the quarter ended June 30, 2018, Corporate Capital Trust (CCT) hit my base case projections with dividend and fee income of $15 million (compared to projected $11 million) and covered its dividend by 100% after excluding $1 million of “one-time listing/merger expenses”. Its portfolio yield increased from 9.6% to 10.5% partially due to increased “annual amortization of the purchase or original issue discount” as calculated by the company. Portfolio growth was lower-than-expected but its debt-to-equity is now 0.74 and closer to its targeted leverage not taking into account almost $90 million in cash.

The board of directors declared a regular quarterly cash distribution in the amount of $0.402 per share, which will be paid on October 9, 2018, to shareholders of record as of September 28, 2018. Previously, the board declared a special cash dividend of $0.10125 per share payable on May 21, 2018, to stockholders of record as of the close of business on May 14, 2018.

On August 9, 2018, FS/KKR Advisor announced the closing of a new $3.435 billion, five-year senior secured omnibus revolving credit facility priced at LIBOR plus an applicable spread of 1.75% or 2.00%, depending on collateral levels. CCT has been allocated $1.45 billion of the new facility that will be used to payoff its current credit facilities at higher rates and improve CCT’s net interest margins over the coming quarters. The company has estimated a total annual saving of $7 million to $8 million or around $0.02 per share per quarter.

As of June 30, 2018, CCT had around $383 million of borrowing capacity plus $90 million cash:

Net asset value (“NAV”) per share declined by $0.14 or 0.7% (from $19.72 to $19.58) mostly due to the previously discussed special dividend of $0.10125 per share and of “one-time listing/merger expenses”. Markdowns for the quarter included the Home Partners of America, Inc,. Z Gallerie, LLC and Hilding Anders as well as restructuring of its investment in Proserv Acquisition, LLC.

Non-accruals decreased from 2.4% to 1.5% of the portfolio fair value due to exiting its investment in Willbros Group and converting its investment in Proserv Acquisition, LLC to equity. Z Gallerie, LLC was added to non-accrual status during the quarter, which is another retail-related investments. Hilding Anders, Rockport (Relay), Petroplex Acidizing, Inc., and AltEn, LLC also remain on non-accrual. It should be noted that most of the previous and current investments on non-accrual are related to exposure to the energy and retail sectors that I have taken into account when assessing its risk ranking and pricing.

Also, CCT’s portfolio credit metrics continue to decline from the previous quarters, including cash flow leverage and coverage ratios, and need to be watched:

CCT has around 39% of its portfolio is first-lien debt and another 31% in second-lien and ‘other senior secured’ debt for a total of almost 70% in senior secured debt.

In May 2016, Strategic Credit Opportunities Partners (“SCJV”), a joint venture with Conway Capital, was formed to invest in middle market companies. As of June 30, 2018, the SCJV accounted for around $307 million or 7.5% of CCT’s total portfolio and paid a dividend of $8.7 million during the quarter (up from $6.8 million the previous quarter). It should be noted that the SCJV had one holding on non-accrual status representing 8.0% and 7.8% of total investments on an amortized cost basis and fair value basis, respectively.

In March 2018, CCT’s board of directors authorized a $50 million stock repurchase program and through June 30, 2018, CCT repurchased 2,467,458 shares for $41.07 million and an average price per share of $16.64 (16% discount to previous NAV of $19.72).

As mentioned in previous posts, the base management fee was reduced from 2.0% to 1.5% of assets and the incentive fee of 20% includes a lookback feature.

TPVG: Stable 11% Yield With Pre-IPO VC Tech Exposure For Higher Returns

Summary

  • TPVG has rallied 13% since my previous article “11.7% Yield Positioned For Rising Rates And Ready To Rally” partially due to the expected earnings beat for Q2.
  • TPVG recently completed an equity offering, and this article discusses some of the pros and cons as well as reasons to purchase the stock depending on pricing.
  • Also predicted, TPVG recently obtained shareholder approval to reduce its asset coverage requirement from 200% to 150%, effective June 22, 2018.
  • This article also discusses the potential impact from rising interest rates and the recent total returns from my previously announced purchases of higher quality BDC stocks, including TPVG.

You can read the full article at the following link:

Please read the full article at the link provided above or sign up for Premium Reports that includes updated Deep Dive Reports on each BDC including this one.

TPVG Article Follow-Up:

This article is a followup to “11.7% Yield Positioned For Rising Rates And Ready To Rally“:

As predicted in the article linked above, the stock price for TriplePoint Venture Growth (TPVG) rallied 13% shortly after the article and the company easily beat analyst expected EPS by $0.10 per share. As mentioned in the previous article, TPVG was expected to easily cover its dividend due to prepayment-related income from its $50 million loan to Ring, Inc. driving an effective yield of 17.2% as shown below.

PFLT: PSSL Growth & Higher Leverage

Summary

  • PFLT reported between my base/best cases covering 98% of its dividend. Portfolio growth was higher-than-expected and there was another increase in portfolio yield driving interest income to its highest level.
  • The portfolio remains predominantly invested in first-lien debt at around 81% portfolio and the PSSL now accounts for 13% (previously 9%) and is 100% invested in first-lien debt.
  • There were no investments on non-accrual as Sunshine Oilsands was exited and responsible for most of the realized losses. NAV per share declined by 1.1% due to various markdowns.
  • I am expecting improved dividend coverage through growth of its PSSL and slowly increasing leverage and eventually utilizing its Board approved reduced asset coverage ratio, effective as of April 5, 2019.

The following is a quick update that was previously provided to subscribers of Premium Reports on August  8, 2018. For target prices, dividend coverage and risk profile rankings, credit issues, earnings/dividend projections, quality of management, fee agreements, and my personal positions on all BDCs  (including this one) please see Deep Dive Reports.

PennantPark Floating Rate Capital (PFLT) reported between my base and best case projections covering 98% of its dividend and was not expected to fully cover due to being underleveraged. However, there was higher-than-expected portfolio growth and an increase in its portfolio yield (as predicted in the previous report) driving interest income to its highest level as shown below and likely adequate dividend coverage over the coming quarters. I am expecting the company to slowly increase its leverage and eventually utilize its Board approved reduced asset coverage ratio, effective as of April 5, 2019.

“Due to the activity level year to date as well as this quarter, the increase in LIBOR and the growth of PSSL, we are pleased that our current run rate net investment income covers our dividend,” said Arthur H. Penn, Chairman and CEO. “Our earnings stream should have a nice tailwind based on a continuation of these factors. Adding people to our platform has resulted in a significantly enhanced deal flow which puts us in a position to be both more active and selective.”

Please note that ‘Core NII’ excludes “$1.0 million on unrealized gains accrued but not payable”.

Also, there was previously around $0.45 per share of spillover to cover dividend shortfalls:

“We have significant spillover income that we can use as cushion to protect our dividend while we ramp the portfolio. As of September 30, our spillover was $0.45 per share.

There was another increase in its overall portfolio yield (from 8.6% to 8.7%).

As discussed in my previous reports, PFLT’s portfolio yield has started to increase partially due to additional returns from the PennantPark Senior Secured Loan Fund (“PSSL”) and I am expecting higher portfolio yield and dividend coverage in the upcoming quarters. In May 2018, the company doubled the capacity of the PSSL to a total of $630 million.

“As of June 30, 2018, PSSL’s portfolio totaled $346.9 million, consisted of 38 companies with an average investment size of $9.1 million and had a weighted average yield on debt investments of 7.7%. For the three months ended June 30, 2018, PSSL invested $142.7 million (of which $27.1 million was purchased from the Company) in 10 new and three existing portfolio companies with a weighted average yield on debt investments of 7.4%. PSSL’s sales and repayments of investments for the three months ended June 30, 2018 totaled $16.1 million.”

As of June 30, 2018, there were no investments on non-accrual status as Sunshine Oilsands Ltd. (previously on non-accrual) was exited and primarily responsible for realized losses of around $1.8 million during the quarter. Net asset value (“NAV”) per share decreased by 1.1% (from $13.98 to $13.82) due to markdowns in various investments including LifeCare Holdings, Quick Weight Loss Centers, Affinion Group Holdings, Chicken Soup for the Soul Publishing, and GCOM as well as restructuring its investment in New Trident HoldCorp, Inc.

The portfolio remains predominantly invested in first-lien debt at around 81% portfolio and the PSSL now accounts for 13% compared to 9% the previous quarter. It is important to note that PSSL is 100% invested in first-lien debt.