BDC PRICING
The following information is to help BDC investors properly assess relative risk and value investments in a sector that is notoriously opaque. BDC stock prices can be volatile providing opportunities for investors that have identified proper values based on risk and potential dividend returns. Assessing relative risk and dividend coverage are primarily responsible for driving a wide range of values for BDCs. It is important to realize that BDCs do not report consistently, so investors need to look beyond changes to book value/net asset value (“NAV”) per share and dividend coverage from reported net investment income (“NII”).
Are BDCs Overbought or Oversold?
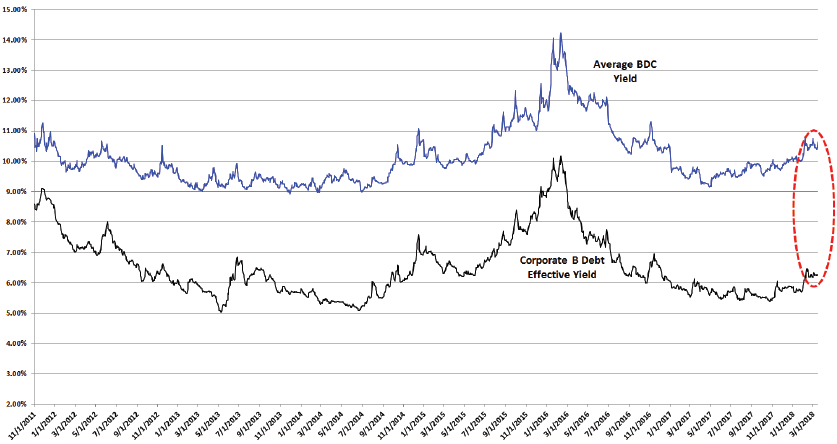
I closely watch the yield spreads between BDCs and other investments including the ‘BofA Merrill Lynch US Corporate B Index’ (Corp B). Yield spreads are important to monitor as they can indicate when a basket of investments is overbought or oversold compared to other yield-related investments. However, it is also important to point that general market yields can change at any time. Also, spreads change over time depending on the perception of risk and these are only averages that then need to be assigned a range when assessing individual companies. BDCs can be volatile and timing is everything for investors that want to get the “biggest bang for their buck” but still have a higher-quality portfolio that will deliver consistent returns over the long-term.
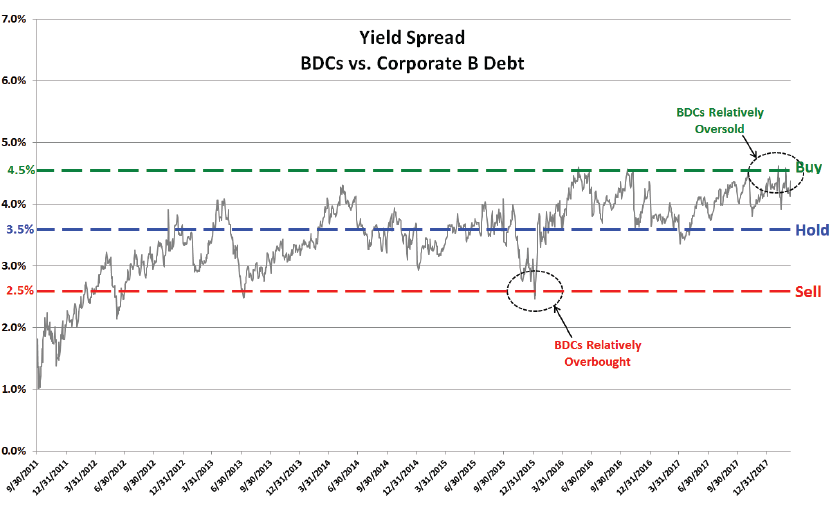
The following chart uses the information from the previous chart showing the average yield spread between BDCs and Corp B. I consider BDCs oversold when yields approach 4.5% higher and overbought when yields are closer to 2.5% higher.
Establishing a Range of Yields for BDCs:
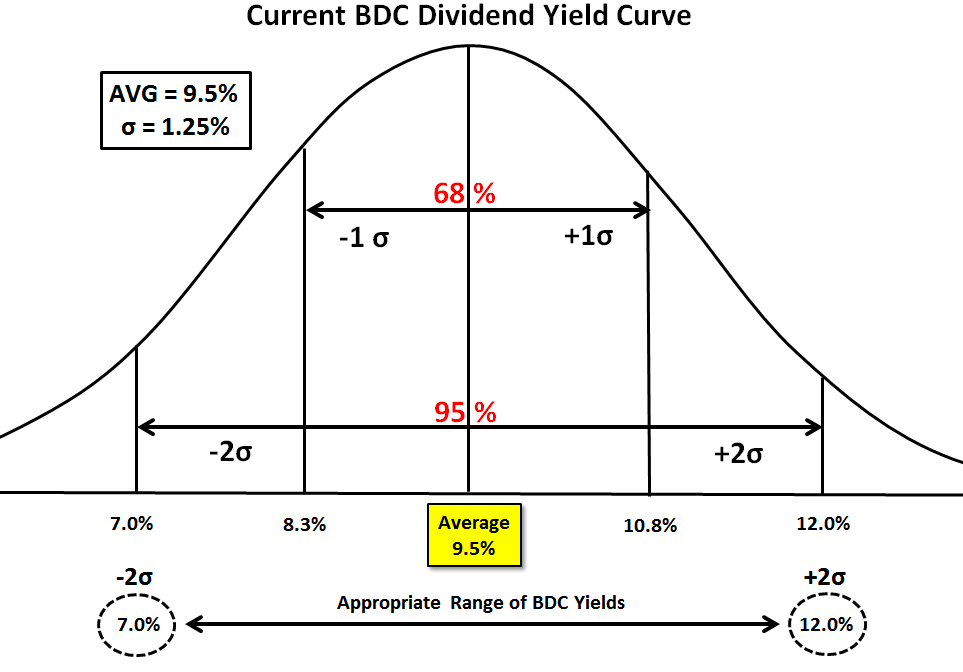
Initially, I start with a baseline average yield that is driven by various comparable investment spreads and currently, I am comfortable using an expected average yield of 9.5% as a baseline.
Then I use a spreadsheet to calculate the “standard deviation” or [σ] of the current yields to develop an appropriate range. The following diagram shows a typical “bell curve” or normal distribution of results, with 95% represented within 2 standard deviations of the mean. The current standard deviation [σ] is around 1.25%. I use 2.0 σ to come up with a range that should accommodate around 95% of all BDCs which calculates to yields between 7.0% and 12.0% as shown in the diagram below.
CURRENT BDC DIVIDEND YIELD CURVE
Assigning a Range of Yields for BDCs:
Once I have established an appropriate yield range for BDCs, I assign a corresponding yield to each BDC using rankings of risk and dividend coverage potential. However, as discussed in BDC Risk Profiles, risk and dividend coverage are interrelated on many levels. BDCs with lower dividend coverage are more likely to “reach for yield” and/or grow the portfolio during frothy lending periods, taking on increased risk. It is important for subscribers to understand that much more analysis goes into the pricing for each company and is discussed in the Deep Dive Reports for each.
Riskier portfolios eventually have higher credit issues that drive lower earnings and dividend cuts. Credit issues also drive lower net asset value per share, which is critical for BDCs that use higher amounts leverage due to the requirements for BDCs to have a 200% asset coverage ratio (recently reduced for some companies) as defined in the 1940 Act. This roughly equates to a 1:1 debt-to-equity ratio for most BDCs. Keep in mind that “net asset value” is the same as the book value or equity of the company. After assessing risk rankings and dividend coverage potential, I assign an appropriate yield to each BDC relative to its peers, which correlates to an appropriate price.
Risk (portfolio credit quality and vintage, quality of management, historical and projected credit and NAV performance, effective leverage ratios, portfolio diversification, rate sensitivity, and the need to reach for yield to sustain dividends)
Dividend Coverage (historical and projected dividend coverage, yield compression sustainability, repayment exposure, recurring vs. onetime dividend and fee income, PIK vs. cash, EPS growth/decline, operational cost efficiency)
Explanation of Pricing:
Yield-Based Pricing
This method of pricing BDCs is based on the combination of two key measures: risk and dividend coverage potential. I use my risk ranking as a measure of capital preservation and my profit ranking that includes the information from the Dividend Coverage Levels report.
Total Return Pricing
Total return accounts for income and capital appreciation. Income includes regular and special dividends and capital appreciation represents the change in the value of the investment. I use NAV per share growth to measure the ability to create value for shareholders. BDCs with higher expected NAV per share growth, have historically provided higher returns to shareholders. To calculate pricing using this method I compare projected vs. expected returns. My expected returns are based on the BDC’s risk ranking as higher risk
BDCs should offer higher returns.
Multiples-Based Pricing
This is the typical method of pricing using NAV per share and last 12 months net investment income (“NII”). However, I use different multiples for each BDC based on rankings of risk (capital preservation) and profitability (dividend coverage potential). Lower quality BDCs are typically priced using this method.