DIVIDEND COVERAGE LEVELS
DIVIDEND COVERAGE
LEVELS REPORT
- Updated monthly
- Rankings of projected coverage
- Projected changes to dividends over the coming quarters
The Dividend Coverage Levels reflect potential dividend coverage mostly ranked by using the ‘worst-case’ financial projections and the lower yield Leverage Analysis discussed in the Deep Dive Projection reports for each BDC. Worst-case scenarios for each BDC include increased portfolio credit issues, lower NAV per share, declining portfolio yields (potentially from lower interest rates, as discussed later), higher borrowing rates and operating expenses, slower portfolio growth (or portfolio declines/repayments), and lower amounts of non-interest income (from fees and dividends). Basically, the worst case is assuming a deeper and extended recessionary environment coupled with declining interest rates.
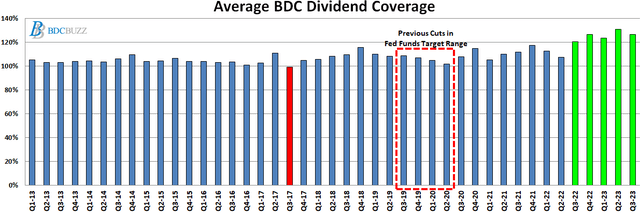
Even if the underlying rates eventually go lower, there is a good chance that most BDCs will continue to over-earn their regular dividends. The following chart shows the average dividend coverage over the last 10 years with the last 5 quarters averaging over 120% even after taking into account the previous dividend increases. Many BDCs have opted to take a conservative approach when setting their regular dividends (just in case rates head lower) and are using supplemental/special dividends to pay out excess earnings. This means that if portfolio yields decline, we will see lower amounts of supplemental/special dividends but the regular dividends will be maintained especially ‘Level 1’ dividend coverage BDCs. The Fed funds target range declined by 2.25% (225 basis points) starting in Q3 2019 through Q1 2020 resulting in a decline in average dividend coverage from 109% to 102%. The only BDCs to cut their regular dividends were ‘Level 2’.
The following are the three categories of methods that I use for comparing dividend coverage:
- Historical dividend coverage: using adjusted earnings (excludes certain one-time expenses) taking into account recurring vs. one-time revenues, cash vs. PIK interest income, etc.
- Projected dividend coverage: using best, base, and worst case scenarios taking into account potential credit issues, portfolio growth/decline, changes to portfolio yield, various amounts of non-recurring income from dividends and fees, and changes to borrowing and operational expenses.
- Optimal Leverage Analysis: assessing future dividend coverage based on portfolio growth using available cash and borrowings (leverage) as well as changes in portfolio yield, apples-to-apples comparison of BDC dividend coverage using similar amounts of leverage.
Historical Dividend Coverage
Most investors rely on historical dividend coverage for assessing potential dividend coverage. However, when it comes to weighting the previously mentioned three categories of dividend coverage, historical is typically the least reliable indicator for future coverage. There are many reasons for this including constantly changing income and expense trends as well as portfolio credit issues. Many of the BDCs that have recently cut dividends, announced that the primary drivers of the reduced distributions were related to potentially lower yields on investments either due to yield compression, rotating into safer investments and/or recent portfolio credit issues. Most of these BDCs had “spillover” or excess distributable income and gains that could have been used to cover shortfalls, but management decided to align the dividends with projected earnings.
Projected Dividend Coverage
Projecting dividend coverage is mostly about reading the trends for income and expenses. This includes general sector and specific company trends, watching for portfolio credit issues, changes to capital structure, and borrowing costs as well as estimating a range of performance for portfolio growth and non-recurring income.
Optimal Leverage Analysis
This is a longer-term run rate analysis of dividend coverage that takes into account the potential for portfolio growth with available capital (excluding equity offerings). I use stable and lower portfolio yields with minimal amounts of non-recurring income to project dividend coverage with a fully ramped portfolio using “optimal leverage”.
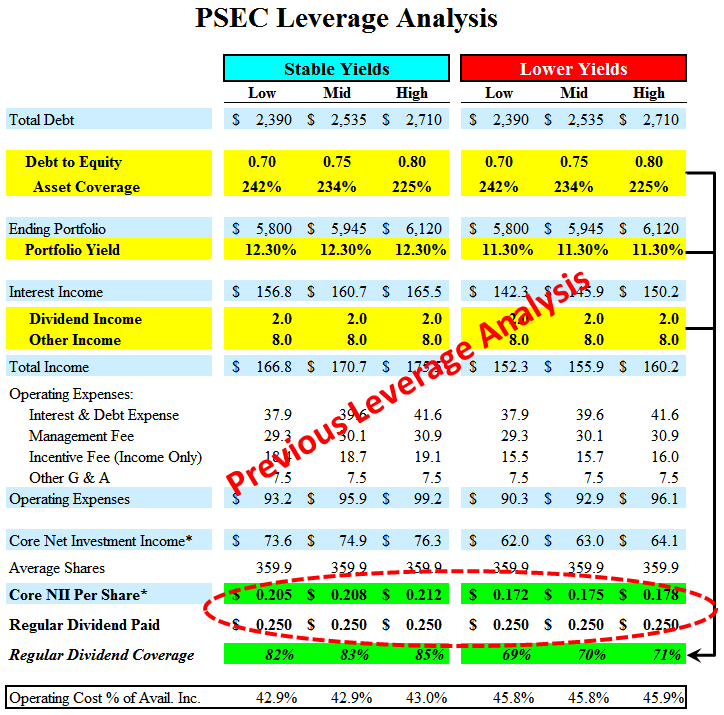
For an example, please see the table below from the article, “Prospect Capital: Expected Dividend Cut Of 20% To 30%“, which correctly predicted a previous dividend cut for PSEC (from $0.25/quarter to the current $0.18/quarter). Ultimately, PSEC reduced its monthly dividend from $0.0833 to $0.06 which was exactly the projected earnings during a “worst case scenario” of reduced portfolio yield and lower amounts of non-recurring income as shown in the table below.