![]()
google sheets &
premium reports:
BDC GOOGLE SHEETS

There are currently 26 BDCs included:
ARCC, BXSL, CGBD, CSWC, FDUS, FSK, GAIN, GBDC, GLAD, GSBD, HTGC, MAIN, MFIC, MSDL, MRCC, NCDL, NMFC, OCSL, OBDC, PFLT, PNNT, PSEC, TCPC, TPVG, TRIN, and TSLX
Also included are the Investment Grade (“IG”) Bonds/Notes, Preferred Stocks, and Baby Bonds for:
ARCC, BXSL, CSWC, FCRD, FDUS, FSK, GAIN, GBDC, GECC, GSBD, HTGC, MAIN, MFIC, MSDL, NCDL, NMFC, OCSL, OBDC, OXSQ, PFLT, PFX, PNNT, PSEC, SAR, TCPC, TRIN, TSLX
The BDC Google Sheets include real-time pricing and recommendations to identify actionable opportunities during market volatility using the following tabs, as discussed below:
- All BDC Stocks (includes BDC Buzz ‘Buy & Hold’ allocations)
- Volatility (important for building current positions)
- BDC Charts
- Dividend Detail & Expectations (for each BDC)
- Ranking Tiers & Leverage
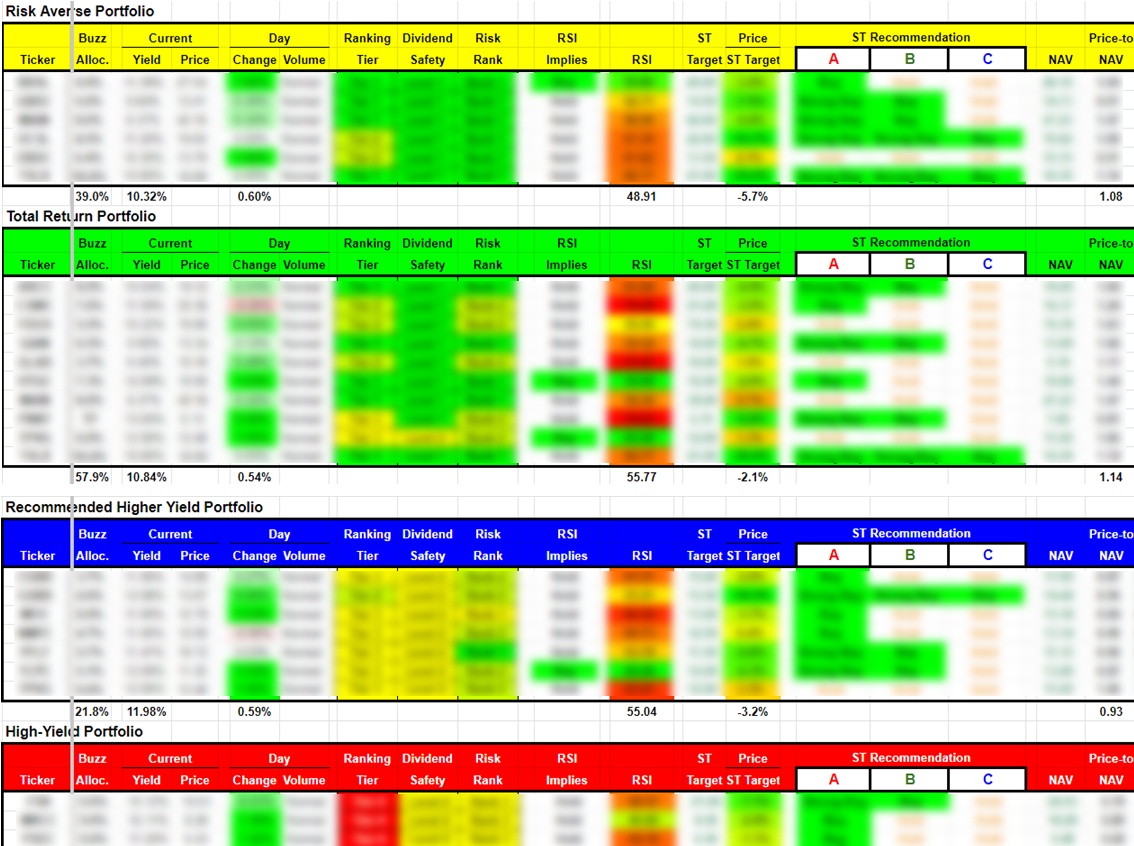
- Suggested BDC Portfolios (Risk Averse, Total Return, Recommended Higher-Yield, & High Yield)
- BDC Buzz Total Returns (all trades over the last 9 years)
- BDC Invest-Grade Bonds/Notes (with continually updated coverage ratios)
- Baby Bonds/Preferreds
- Risk Rankings for Baby Bonds/Preferreds
Please allow up to 24 hours (on weekends and holidays) to receive
information to access all reports or links. E-mail us directly if
you have questions: bdcbuzz@gmail.com
SAMPLE VIEWS:
- There are various worksheets as shown below including Suggested BDC Portfolios,
BDC Ranking Tiers and Baby Bonds. BDC pricing can be volatile and Google Sheets
tracks real-time changes to pricing compared to price targets so that investors can
make quick decisions.
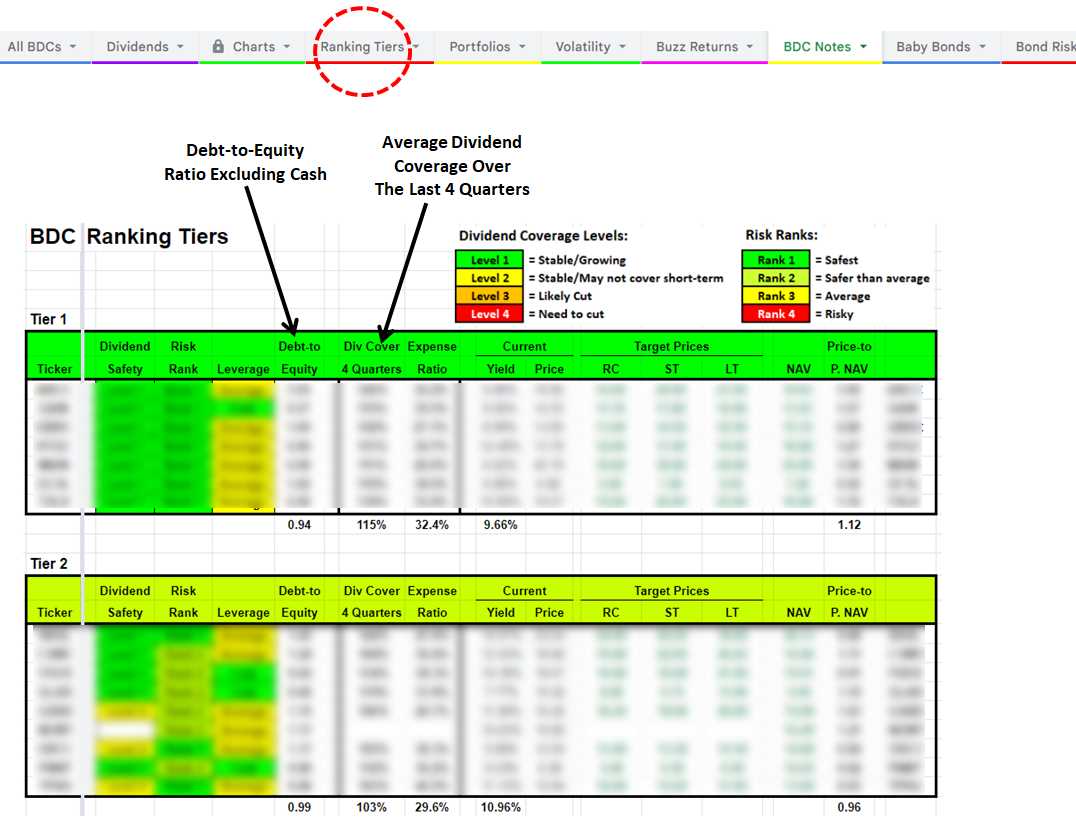
BDC Ranking Tiers
It is important to understand the Ranking Tiers are based on a relative basis, meaning that just because a company is ranked as ‘Tier 2’ or ‘Tier 3’ does not imply that it is a ‘bad’ stock. I own many Tier 3 companies, some of which might be upgraded over the coming weeks. The Ranking Tiers combine the results from many of the reports available at the link provided earlier and are primarily responsible for driving the target pricing assigned to each BDC focused on capital preservation, including NAV per share stability and portfolio strength, to sustain dividend coverage.
This includes the ability of the portfolio to retain value during an economic downturn. One of the best approaches to assessing risk in a BDC portfolio is using a “vintage analysis” that takes into account many aspects including the time frame that each loan was originated as well as asset class, maturity, directly originated vs. syndicated, industry sector, PIK vs. cash yields. BDCs that were lending during times of less protective covenants and higher leverage multiples while maintaining higher-than-average yields will likely have upcoming credit issues regardless of the overall economy
Assessing which vintages are potentially riskier than others is an evolving art and there are a few key indicators that I use, including historical market liquidity levels, default rates, leverage multiples, and covenant light trends. More importantly, I compare the cash/PIK yields of each loan by the time frame that they were originated, but also taking into account the asset class and company sector. Specifically, I am looking for “above market” yields that could imply higher risk. Another important indicator is loans that should have been refinanced at lower rates and are past their “prepayment penalty” windows. This would include loans that have much higher than current market yields and could easily be refinanced unless the portfolio company has potential credit issues.
The “Debt-to-Equity” ratio excludes cash, which is important for BDCs with meaningful amounts of cash relative to their borrowings.
The “Expense Ratio” is the average “Operating Cost as a Percentage of Available Income” measuring operating, management, and incentive fees compared to available income over the last four quarters. “Available Income” is total income less interest expense from borrowings and is the amount of income that is available to pay expenses, including shareholder distributions. BDCs with lower operating expenses can pay higher amounts to shareholders without investing in riskier assets.
Also, the quality of the credit platform and management is critical when determining which Tier is assigned to each BDC. These are ‘qualitative’ measures that do NOT fit into boxes in the table below.
- Recommendation Categories: After investors have identified BDCs that fit their risk profile,
I categorize investors’ needs for each BDC holding using the following:
DESCRIPTIONS:
- Investors looking to start a position. Dipping your toe in.
- Investors looking to grow a position to a full/appropriate allocation.
- Investors looking to opportunistically add to a position beyond a full/appropriate allocation.
GOALS:
- Mostly for dividend income.
- Dividend income + 5% capital gains within 12 months.
- Dividend income + 10% capital gains within 12 months.
- This is for investors that do not currently have a meaningful position in a certain BDC and would like to “dip their toe in” with a starter position and then continue to buy more on the dips. We suggest buying a small number of shares closer to its target price and then purchasing more at lower prices if/when available.
- This is for current positions that you want to grow into a full/proper allocation for a diversified portfolio. We suggest adding to these positions using the suggested ‘High’ and ‘Low’ limit order prices which provide subscribers an idea of how low a stock can go during market volatility.
- This is for investors that already have larger positions and would likely only add at opportunistic prices near the suggested ‘Low’ limit order prices, potentially during market volatility/pullbacks. Active traders might choose to sell these shares for capital gains at a later date to re-balance the portfolio.
Trading Volume:
The sheets measure the average volume being traded for all BDCs to see if it is an active or slow trading day for the sector (considering the time of day) and then identify BDCs that are trading above or below that average (also given the time of day). This is important because investors should know when volumes might indicate something meaningful is occurring with the stock (positive or negative).
Relative Strength Index (RSI):
“The relative strength index (RSI) is a momentum indicator developed by noted technical analyst Welles Wilder, that compares the magnitude of recent gains and losses over a specified time period to measure speed and change of price movements of a security. It is primarily used to attempt to identify overbought or oversold conditions in the trading of an asset. Traditional interpretation and usage of the RSI is that RSI values of 70 or above indicate that a security is becoming overbought or overvalued, and therefore may be primed for a trend reversal or corrective pullback in price. On the other side of RSI values, an RSI reading of 30 or below is commonly interpreted as indicating an oversold or undervalued condition that may signal a trend change or corrective price reversal to the upside.”
This is a complicated formula because it takes into account changes in daily pricing over a rolling 365 days which takes time to process (as the price changes). I have not found this indicator available in table format with other online services.
I have color coded the RSI values with green showing closer to 30 (indicating oversold), yellow showing near 50, and red showing closer to 70 (indicating overbought). I include a chart with stock pricing and RSI in my “Deep Dive” reports for each BDC showing that I have made many purchases when its RSI is closer to 30.

![]()
PREMIUM
BDC REPORTS
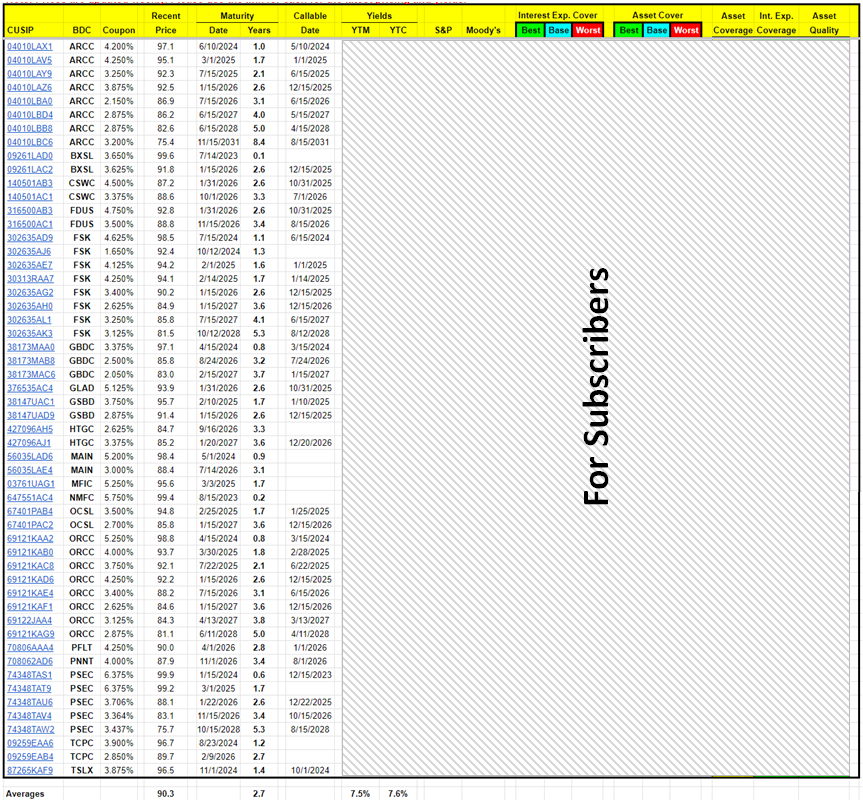
Tradeable BDC Notes:
Many BDCs have investment grade (“IG”) bonds/notes for lower-risk investors building a balanced 60/40 portfolio (composed of 60% to 70% stocks/equities and 30% to 40% bonds or other fixed-income offerings). Stock market volatility will likely remain elevated, and these bonds/notes allow investors to lock in 6% to 9% annualized returns with maturities ranging from 1 to 8 years.
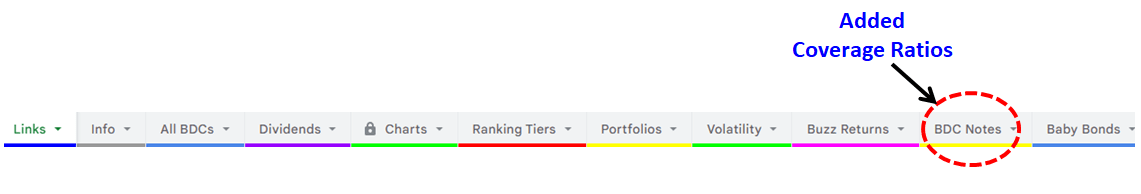
Each of the updated Deep Dive Projection reports includes the projected interest expense coverage and asset coverage ratios with best, base, and worst case. Please see the following links from Investopedia for more information:
The following sheet includes links so that subscribers can pull up the most recent trades, pricing, and yield information for each. As you can see, we have added quite a few and will continue to add for each BDC.