The following information was previously provided to subscribers of Premium BDC Reports along with:
- ORCC target prices/buying points
- ORCC risk profile, potential credit issues, and overall rankings
- ORCC dividend coverage projections (base, best, worst-case scenarios)
![]()
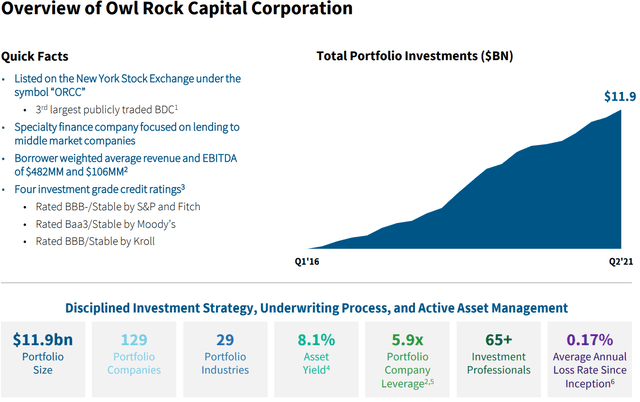
This update discusses Owl Rock Capital Corporation (ORCC) which remains one of the best-priced BDCs especially for lower-risk investors that do not mind lower yields. ORCC is for risk-averse investors as the portfolio is mostly larger middle market companies that would likely outperform in an extended recession environment. Also, the company has ample growth capital available for increased earnings over the coming quarters.
“We generally favor bigger companies for our portfolio. This year, we have already evaluated more than 20 opportunities over $1 billion in size, and invested in or committed to eight of these and continue to evaluate others. This trend continues to accelerate and is creating exciting opportunities for large direct lenders like Owl Rock. We believe we are especially well-positioned for this due to our scale platform with a full suite of financing solutions, large, deeply experienced team with strong relationships in the financial sponsor community.”
ORCC is the third-largest publicly traded BDC (much larger than MAIN, PSEC, GBDC, GSBD, NMFC, and AINV) with investments in 129 portfolio companies valued at almost $12 billion that are mostly first-lien secured debt positions. ORCC is one of the few BDCs rated by all of the major credit agencies.
ORCC Dividend Coverage Update
ORCC’s longer-term (“LT”) target price takes into account improved dividend coverage over the coming quarters mostly due to:
- Increased use of leverage to grow the overall portfolio
- Additional prepayments fees and accelerated OID
- Higher portfolio yield from rotating into higher yield assets
- Continued lower cost of borrowings
- Increased dividend income from its Senior Loan Fund
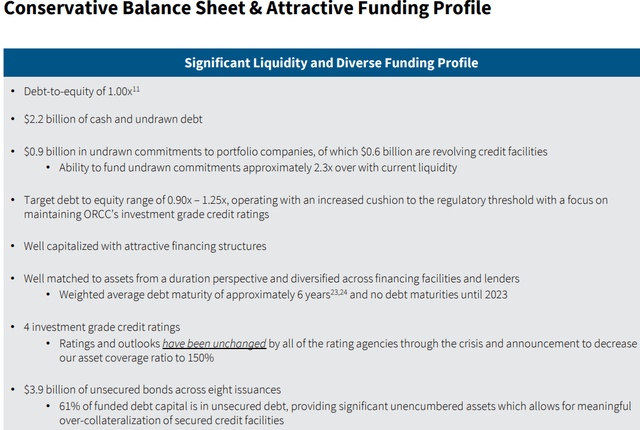
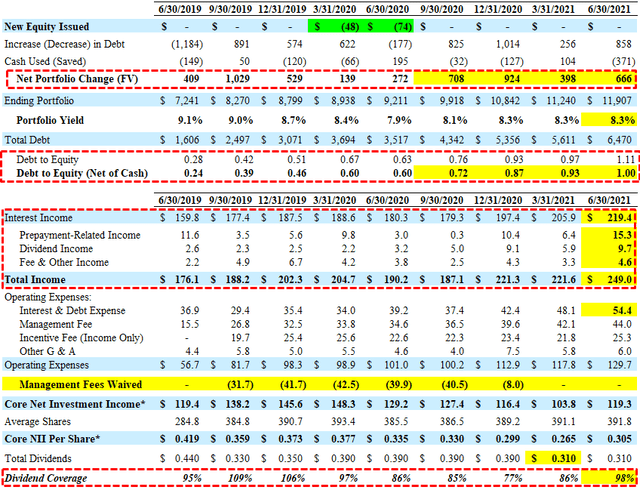
ORCC continues to increase leverage and is now approaching the midpoint of its target debt-to-ratio between 0.90 and 1.25 (currently 1.00 excluding $627 million of available cash) giving the company plenty of growth capital.
“We are now well within our target leverage range and continue to grow the portfolio, which has allowed us to make substantial progress towards covering our dividend. Despite a competitive market backdrop, we’re able to deploy capital into attractive investments and drive incremental yield in the portfolio. The pace of repayments also picked up resulting in a meaningful increase of prepayment related income. And opportunistic financings and improving financing spreads have allowed us to continue to lower our overall cost of funding.”
“As a result of this activity our net leverage increased to 1.00 times approaching the midpoint of our target ranges of 0.90 to 1.25 times. I would expect that we would operate somewhere between there and 1.10 in sort of center of gravity. We look around the portfolios can certainly support that. We’re very focused on keeping really strong ratings for the rating agencies. We’re in constant communication with the agencies and believe that will continue to have good investment grade ratings in that that range. It’s obviously very dependent upon flows in any one quarter. So could dip a little higher, dip a little lower, depending upon one deal plan within a quarter. But 1.00 to 1.10 is probably the right range for folks to be modeling in again be could be a bit higher or lower.”
Management is expecting another strong quarter partially due to higher prepayment-related income which has been taken into account with the updated financial projections and was discussed on the recent earnings call:
“We are encouraged by our visibility on the third quarter and expect another very solid quarter of originations. In terms of repayments, we also expect another strong quarter which should again generate meaningful prepayment income in Q3. Given our strong origination activity, we are confident we will be able to offset repayments by deploying the capital into new originations at attractive spreads. We have visibility on our third quarter. It’s going to be a very active one from an origination standpoint I would say. Again it depends on when everything winds up closing and you just even when you have high visibility until it closes, you’re not sure, but I would expect it to be in line with the second quarter possible possibly exceed it.”
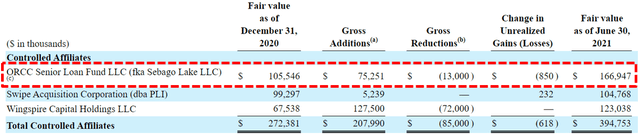
Also taken into account with the updated projections is additional dividend income from its ORCC Senior Loan Fund (previously Sebago Lake LLC) which now accounts for 1.4% of the total portfolio. Management is expecting this joint venture with Nationwide Life Insurance to provide quarterly dividend income of $7 million:
“A few weeks ago we announced an increase in capital commitments towards joint venture loan funds. The fund has generated an attractive average quarterly ROI over the past three years of approximately 10%. ORCC increased its commitment to $325 million, and in addition increased its economic ownership to 87.5% from 50%. We’re also excited to bring a nationwide life insurance as a new partner in the JV. Nationwide, it’s been a meaningful ORCC shareholders since inception, and purchase the remaining 12.5% economic interest from UC Regents effective June 30. In conjunction with these changes, the joint venture will be referred to as ORCC Senior Loan Fund going forward in our disclosures. And so we’ll just be able to increase over time the amount of money ORCC has working and grow that. I think in the most recent quarter, we had about $4 million of dividends that number, when we get all that working it’s going to take some time should be we $7 million a quarter, which is I think terrific.”
Similar to other BDCs, ORCC has been improving or at least maintaining its net interest margin which is the difference between the yield on investments in the portfolio and the rate of borrowings. During the most recently reported quarter, ORCC maintained its portfolio yield but will likely trend higher over the coming quarters as the company rotates into higher yield assets “without sacrificing credit quality”:
“We’ve talked about our desire to rotate a bit and get a little more spread [higher yields] in the portfolio without sacrificing credit quality. And I think what you’re seeing tangible evidence that we’re succeeding on that. Our average spread on new commitments was approximately 670 basis points, up from 640 basis points last quarter. Our overall spread increased as a result of our ability to originate some higher spread unit tranches particularly in the software sector, as well as an increase in second lien investments and a new preferred investment. We’re pleased with our success at increasing the average spread on our investments over the last year which is now roughly 20 basis points higher than it was a year ago. We believe this reflects the strength of our origination capabilities and relationships and the continued attractiveness of our direct lending solutions. ”
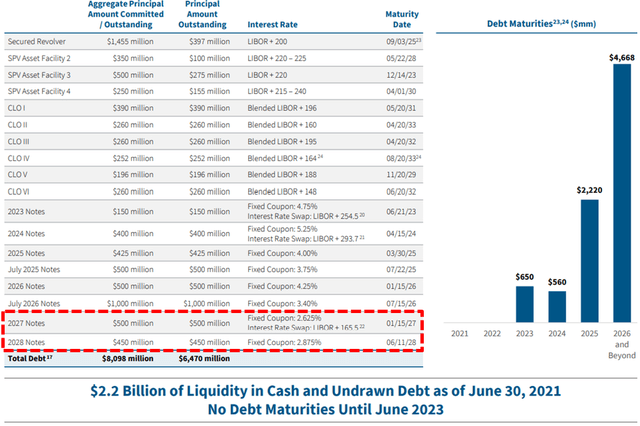
ORCC’s average borrowing rate has declined from 4.6% to 3.0% over the last six quarters due to continued issuances of notes and CLOs at lower rates including another $400 million of its 2.875% notes due 2028 issued on August 17, 2021.
“Given ORCC’s scale since inception, we knew it was critical to have a diversified financing landscape and we embarked on building a balance sheet that would provide financial flexibility and ample liquidity from multiple financing sources. In addition to developing a large diverse bank group that provides us with a billion and a half of revolving credit capacity we have also issued almost $4 billion across eight unsecured bond deals, and over $1.5 billion across six CLOs to efficiently finance our balance sheet. We have been able to meaningfully improve pricing since our first issuances in both cases. We’re pleased with the continued growth of our unsecured financing while we continue our efforts to reduce our borrowing costs. We capitalized on strong conditions in the unsecured bond market during the quarter, raising $950 million across two deals of attractive spreads. In addition to the long five year that we issued in April, we raised an additional $450 million in a seven year bond which priced at a fixed coupon of 2.78%. This is our first seven year bond and should help us to enhance the laddering of our debt maturity profile. As of June 30, more than 60% of our outstanding borrowings were from unsecured debt. Our unsecured bond pricing levels have improved over 100 basis points since we’ve been accessing the unsecured market and we believe there is additional improvement we can capture on future issuances.”

As of June 30, 2021, ORCC had around $2.2 billion of liquidity consisting of $627 million of cash and almost $1.6 billion of undrawn debt capacity (including upsizes).
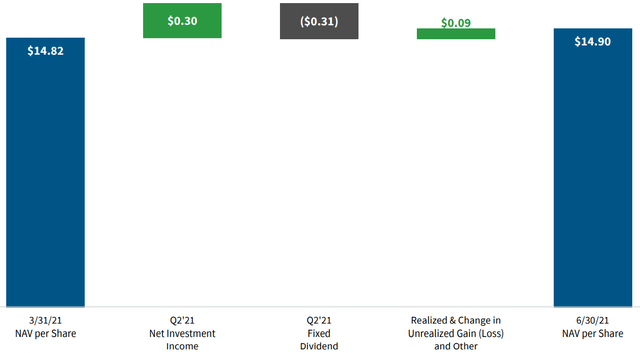
For Q2 2021, ORCC hit its best-case projected earnings due to higher-than-expected prepayment-related, dividend, and fee income as well as higher portfolio growth growing total income to the highest level of $249 million. ORCC was not expected to cover its quarterly dividend but Core NII of $0.305 (excluding excise tax) covered 98% of its regular dividend of $0.310. The Board reaffirmed its third-quarter 2021 dividend of $0.31 per share for stockholders of record as of September 30, 2021, payable on or before November 15, 2021.
“Net investment income for the quarter was $0.30 up from $0.26 per share in the first quarter. We made substantial progress towards covering our $0.31 quarterly dividend and remain on track to cover it in the second half of the year. This was driven by a significant increase in both originations and repayments and continued strong credit performance.”
It should be noted that there was $1.8 million of non-recurring interest expense that negatively impacted earnings during the quarter:
“I would highlight that we had $1.8 million of non-recurring interest expense related to the acceleration of upfront deferred financing fees as we continue to optimize our financing costs through the restructuring of one of our CLOs.”
ORCC Quick Risk Profile Update
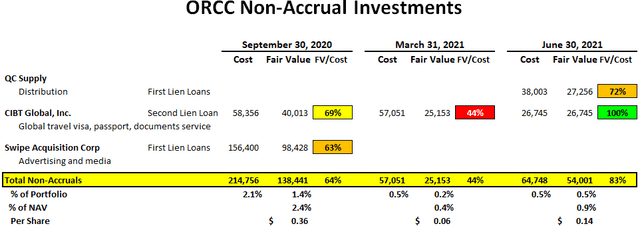
Two of its smaller first-lien loans to QC Supply were added to non-accrual status during Q2 2021. CIBT Global, Inc. remains on non-accrual but was restructured during the quarter driving realized losses of $0.07 per share but will likely be back on accrual in Q3 2021. Please keep in mind that ORCC has 129 portfolio companies so there will always be a certain amount on non-accrual which currently account for 0.5% of the total portfolio fair value as shown below.
“While we continue to have a small number of challenge credits, our non-accruals remain extremely low with only two investments on nonaccrual status at the end of the quarter representing less than point 0.5% of the portfolio based on fair value, one of the lowest levels in the BDC sector.”
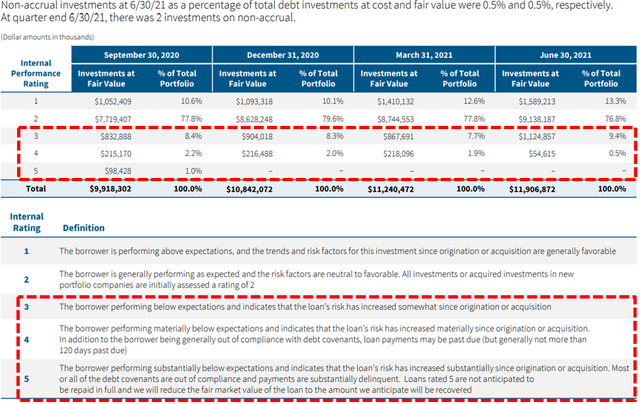
Investments Rating 3 or 4 which are borrowers performing “below” or “materially below” expectations indicating that the loan’s risk had increased “somewhat” or “materially” are now below 10% of the portfolio. Swipe Acquisition Corporation was previously the only investment with ‘Rating 5’ and was upgraded in Q4 2020.
“We continue to see sequential improvement in the engine our lowest rating category, those names rated four or five. These have decreased from 1.9% to 0.5% of the portfolio quarter-over-quarter.”
As mentioned earlier, ORCC’s portfolio is mostly larger middle market companies that would likely outperform in an extended recessionary environment.
“We generally favor bigger companies for our portfolio. This year, we have already evaluated more than 20 opportunities over $1 billion in size, and invested in or committed to eight of these and continue to evaluate others. This trend continues to accelerate and is creating exciting opportunities for large direct lenders like Owl Rock. We believe we are especially well-positioned for this due to our scale platform with a full suite of financing solutions, large, deeply experienced team with strong relationships in the financial sponsor community.”
“We ended the second quarter with NAV per share of $14.90 up $0.08 from the first quarter. Credit quality remains strong with an average fair value of 98 consistent with prior quarters. The overwhelming majority of the portfolio continues to perform very well with 93% of debt investments marked above 95% of par. Most of our borrowers have returned to normalize operating levels and many experienced strong performance in Q2. While we are closely monitoring COVID developments, we have a positive outlook for the overall economy in the second half of the year as consumer demand further rebounds. We believe this will continue to drive good results for our borrowers.”
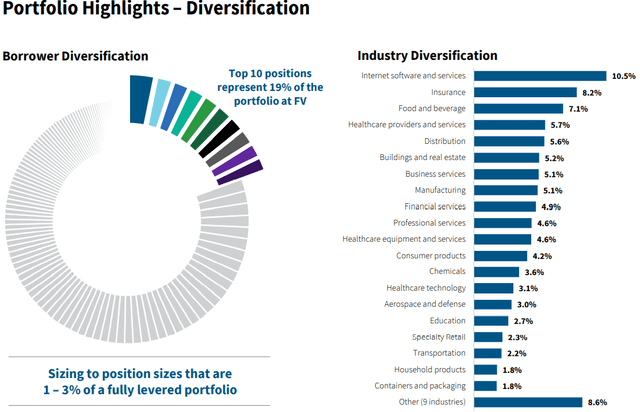
The portfolio is highly diversified with the top 10 positions accounting for around 19% of the portfolio with low cyclical exposure including retail, oil, energy, and gas.
“Today the portfolio is well diversified across 29 industries and the top 10 positions make up only about 19% of the total portfolio.”
What Can I Expect Each Week With a Paid Subscription?
Each week we provide a balance between easy to digest general information to make timely trading decisions supported by the detail in the Deep Dive Projection reports (for each BDC) for subscribers that are building larger BDC portfolios.
- Monday Morning Update – Before the markets open each Monday morning we provide quick updates for the sector including significant events for each BDC along with upcoming earnings, reporting, and ex-dividend dates. Also, we provide a list of the best-priced opportunities along with oversold/overbought conditions, and what to look for in the coming week.
- Deep Dive Projection Reports – Detailed reports on at least two BDCs each week prioritized by focusing on ‘buying opportunities’ as well as potential issues such as changes in portfolio credit quality and/or dividend coverage (usually related). This should help subscribers put together a shopping list ready for the next general market pullback.
- Friday Comparison or Baby Bond Reports – A series of updates comparing expense/return ratios, leverage, Baby Bonds, portfolio mix, with discussions of impacts to dividend coverage and risk.
![]()
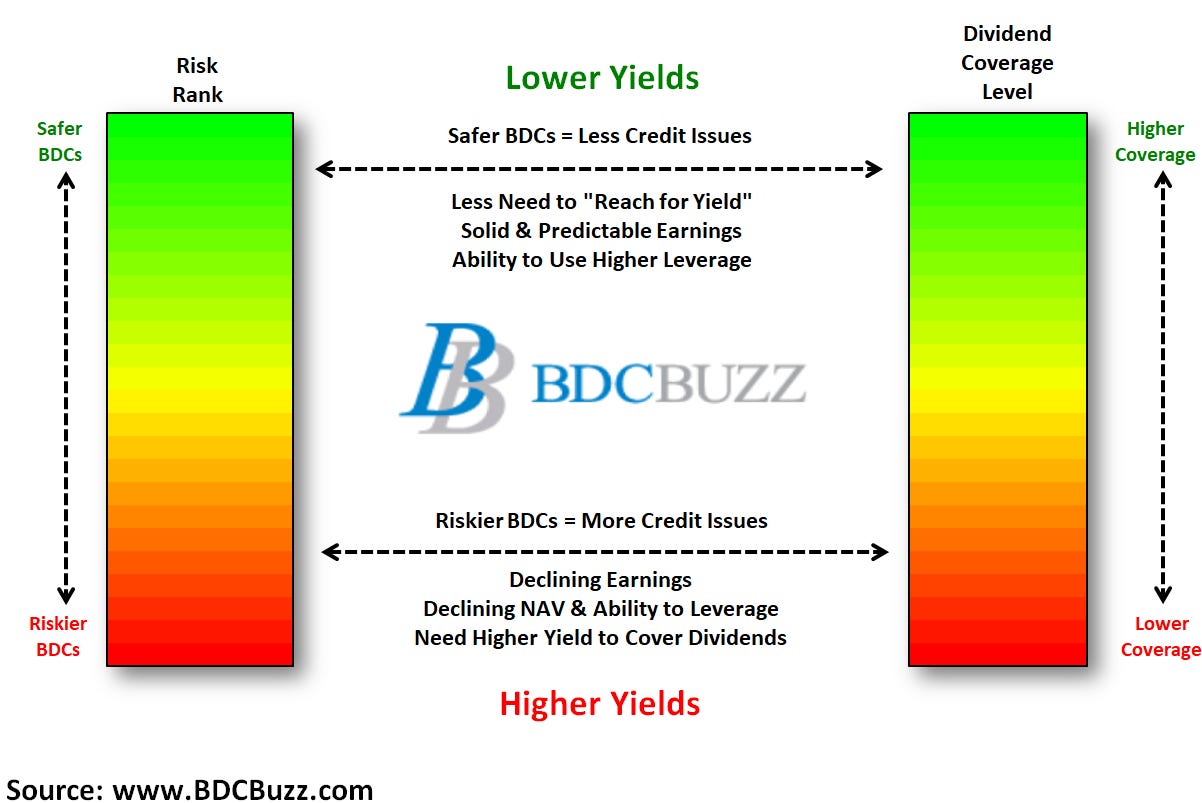
This information was previously made available to subscribers of Premium BDC Reports. BDCs trade within a wide range of multiples driving higher and lower yields mostly related to portfolio credit quality and dividend coverage potential (not necessarily historical coverage). This means investors need to do their due diligence before buying.