The following information was previously provided to subscribers of BDC Buzz Premium Reports along with:
- TPVG target prices, buying points, and suggested limit orders (used during market volatility).
- TPVG risk profile, potential credit issues, changes in NAV, and overall rankings. Please see BDC Risk Profiles for additional details.
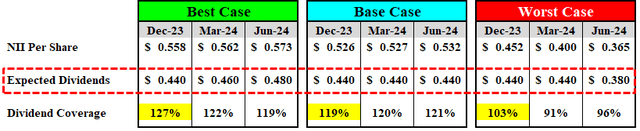
- TPVG dividend coverage projections (base, best, worst-case scenarios). Please see BDC Dividend Coverage Levels for additional details.


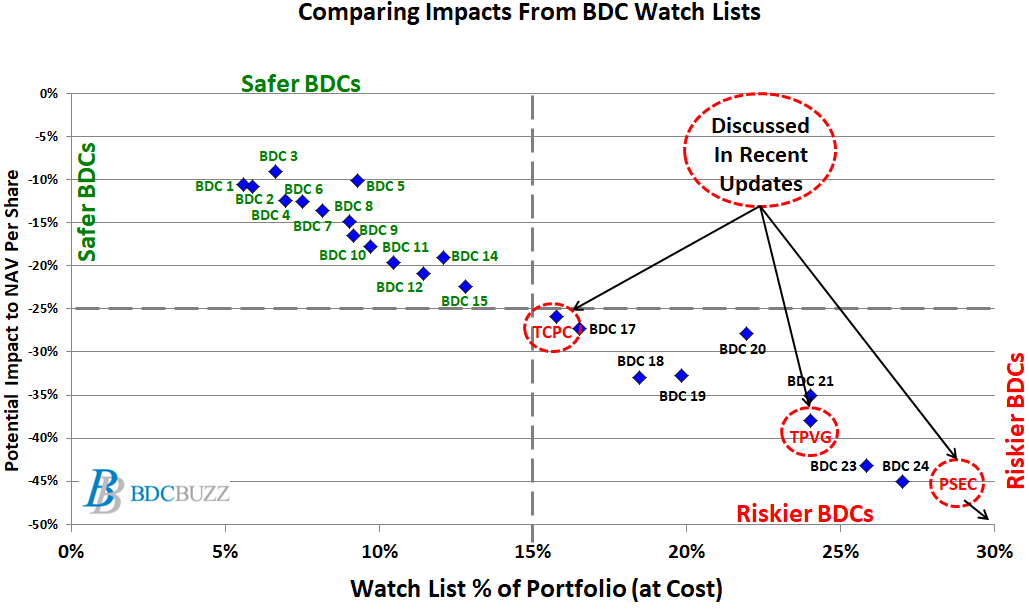
As discussed in previous updates, I sold my position in TriplePoint Venture Growth (TPVG) in December 2022 at $12.70, mostly related to having a higher amount of investments considered ‘watch list’. After taking into account the recent and previous markdowns, the amount of watch list investments remains higher than most BDCs (as shown below).
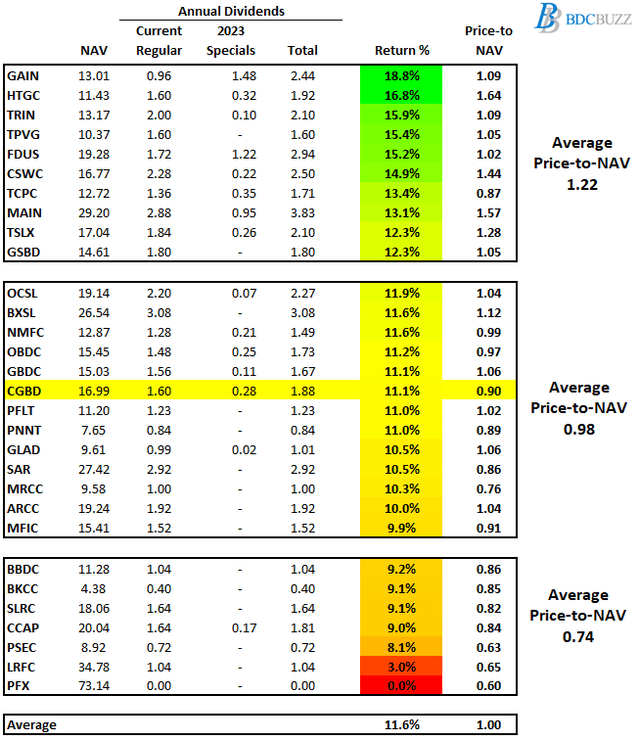
The following chart shows the potential impact on NAV per share for each BDC, assuming that 100% of watch list investments (including non-accruals) defaulted with 0% recovery. This is the worst-case scenario for this group of investments. It is important to note that the chart only takes into account watch list investments and any changes to other positions will also have an impact (positive or negative), especially equity positions which are not included in the watch lists. The largest NAV declines have mostly been BDCs with larger amounts of watch list investments including PSEC, MRCC, TPVG, TCPC, and PNNT. Also, many of the BDCs not covered by this service including OXSQ, PTMN, and HRZN had declines of 14% to 17% over the last four quarters.
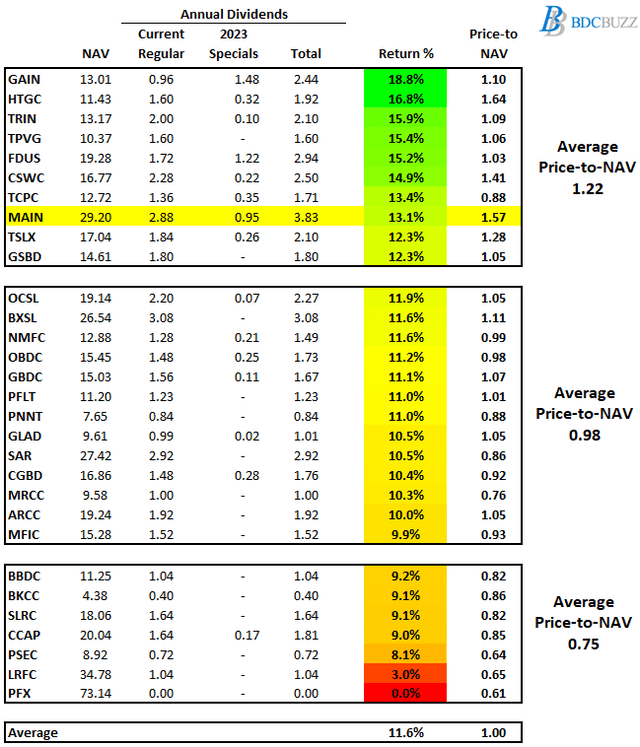
So far, TPVG, PSEC, FSK, HRZN, SAR, OCSL, WHF, and TCPC have had the largest NAV declines for Q4 2023 (between 2% and 11%). Please note that the NAV decline for GAIN was mostly due to paying a very large amount of special dividends during the quarter.
TPVG Quick Quarterly Update (December 31, 2023)
- This information will be discussed in the updated TPVG Deep Dive Projection report.
- Target Prices: Its previous ST target price accounted for continued credit issues but also assumed that the dividend was stable (Level 2 dividend coverage). However, dividend coverage would have been 95% if the company paid the full incentive fee (as shown later) and management mentioned reducing leverage which could put downward pressure on dividend coverage especially if there are continued credit issues so we have reduced the target prices to take into account. I will reassess after updating the projections and risk profile using guidance from management including from the recent earnings call (see call notes at the end).
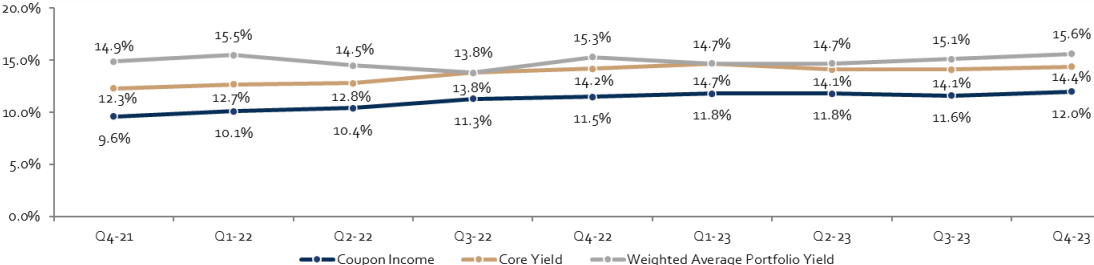
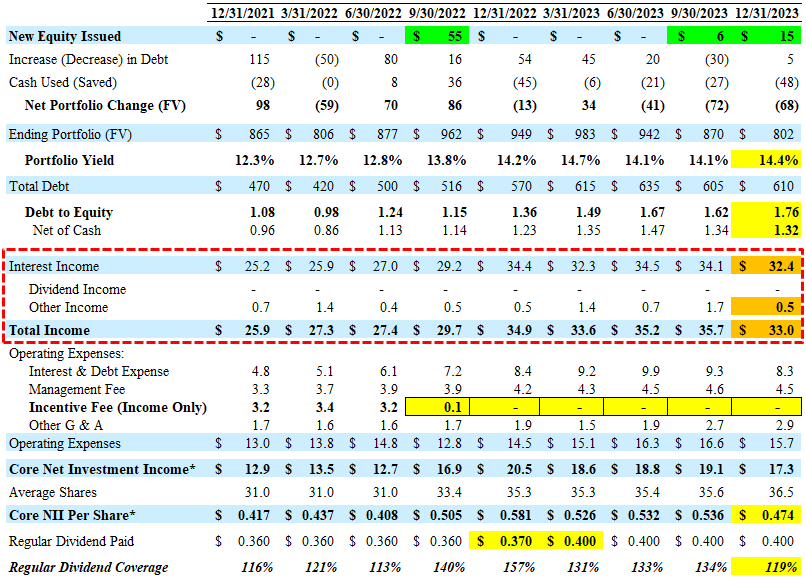
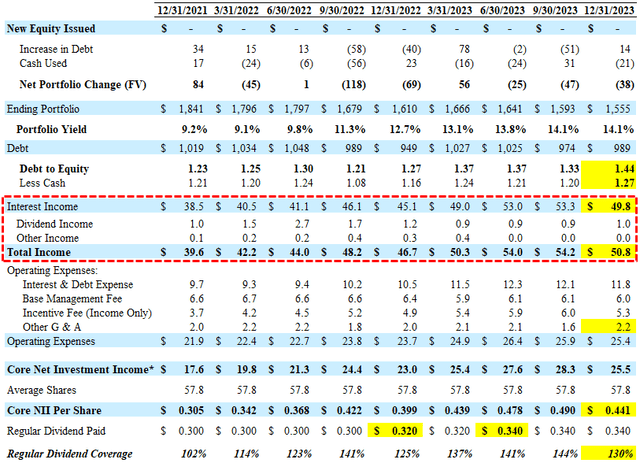
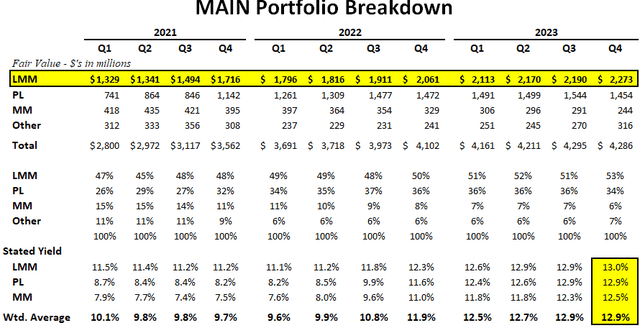
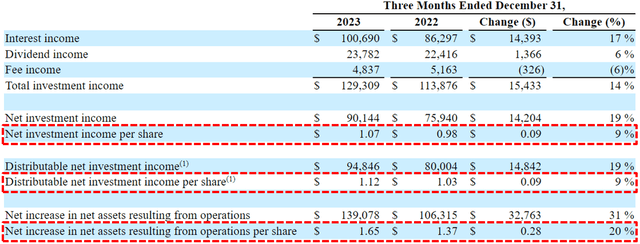
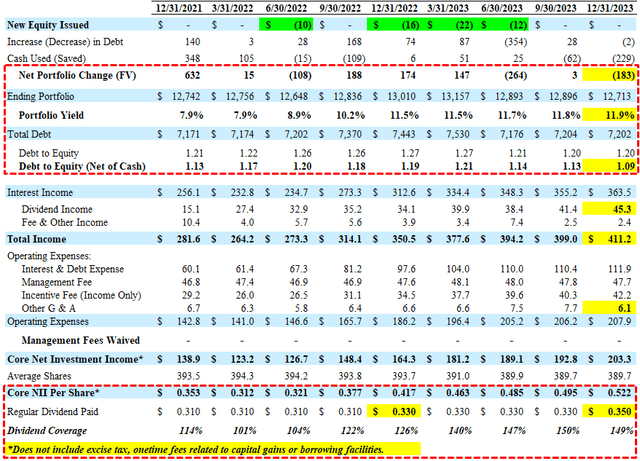
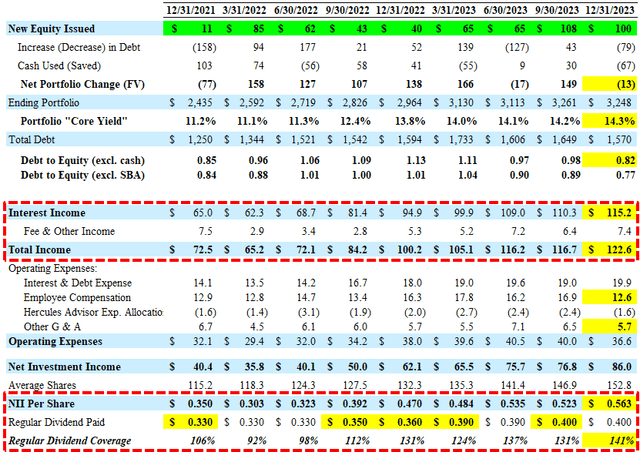
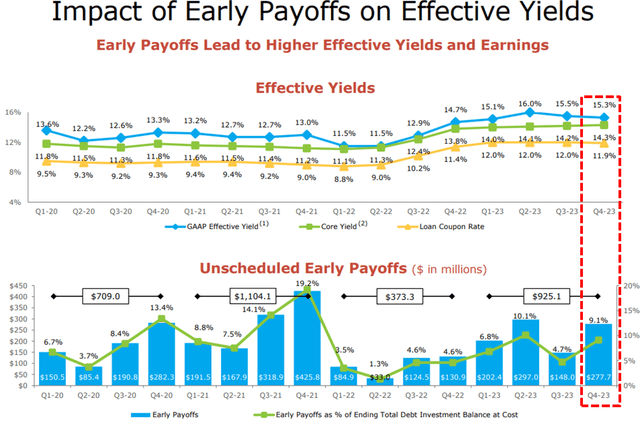
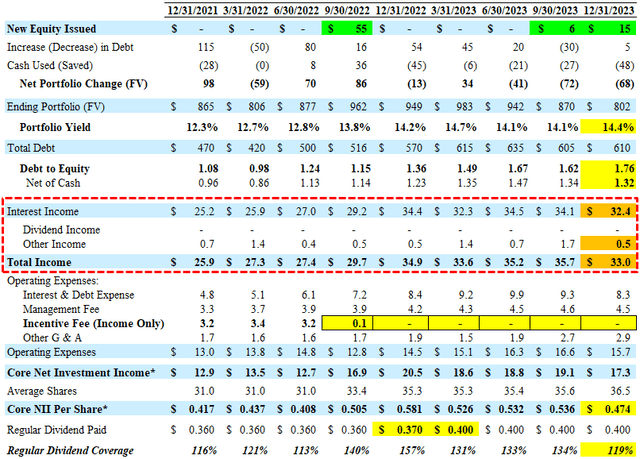
- Earnings: Reported just above its base case projections due to prepayment-related income combined with the ‘Core yield’ increasing to 14.4% and no incentive fees paid (due to continued portfolio credit issues) mostly offset by increased non-accrual investments. If the company paid the full incentive fee, dividend coverage would have been closer to 95% (NII of $0.379 per share).
- Realized Losses: Another $50 million or $1.43 per share mostly due to mostly due to writing off its non-accrual investments in Demain (Luko) which contributed around $0.46 per share, VanMoof Global Holding which contributed around $0.45 per share, Untitled Labs, Mystery Tackle Box (Catch Co.), and Roli (restructured).
- Non-Cash/PIK Income: Increased from 9.1% to 11.2% of total income (among the highest in the BDC sector) partially due to converting Nakdcom One World.
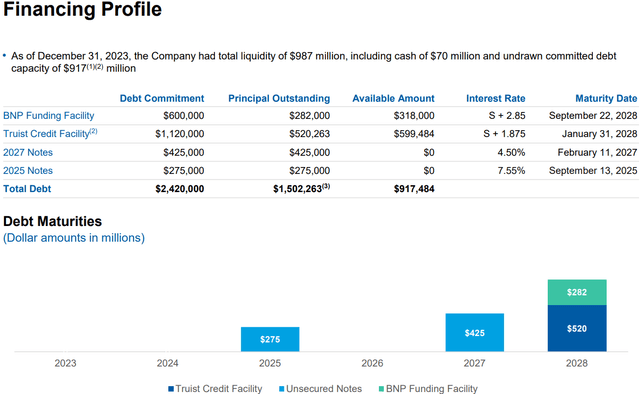
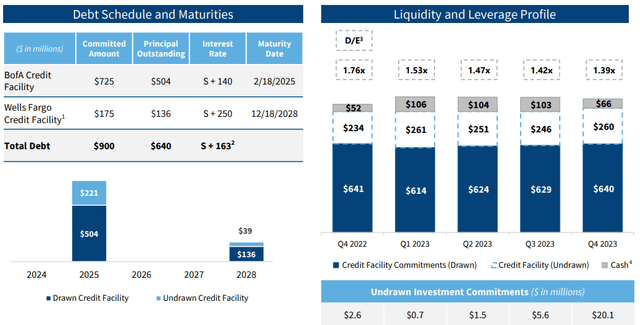
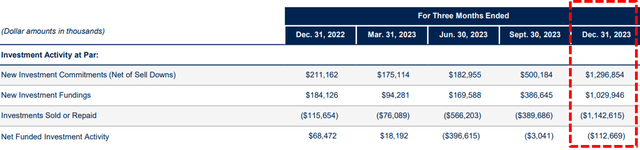
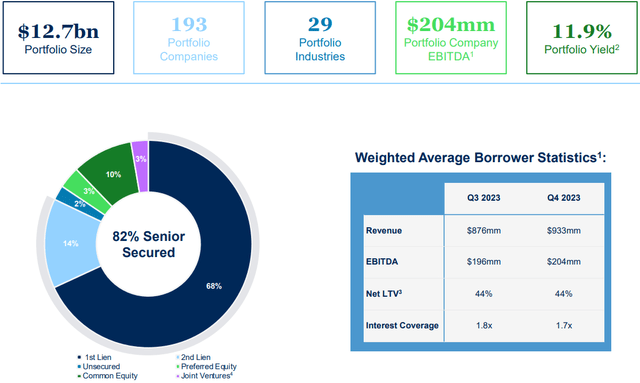
- Leverage: Debt-to-equity ratio of 1.32 (after excluding $153 million of cash) which exceeds its targeted range between 1.00 to 1.25. Please note that the company “drew down on our credit facility to enhance our investment flexibility pursuant to the certain 1940 Act requirements” but subsequently used excess cash to pay down its facility.
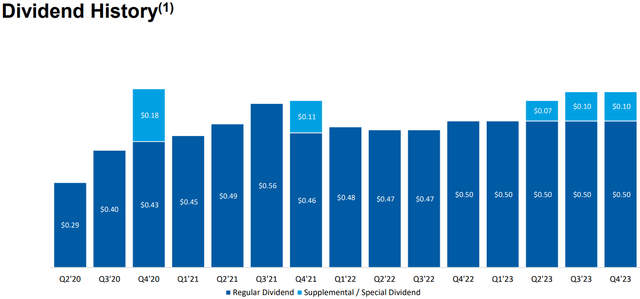
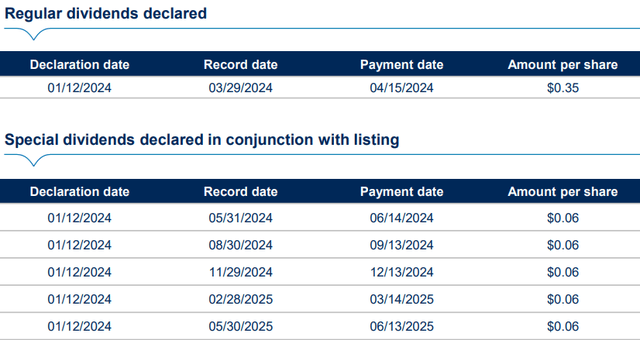
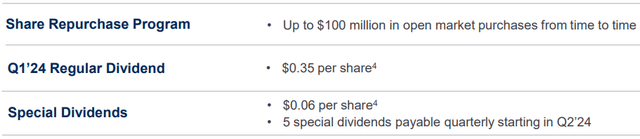
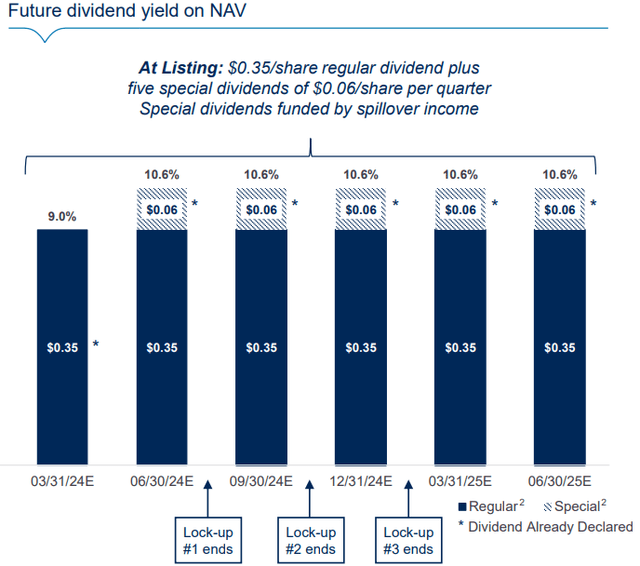
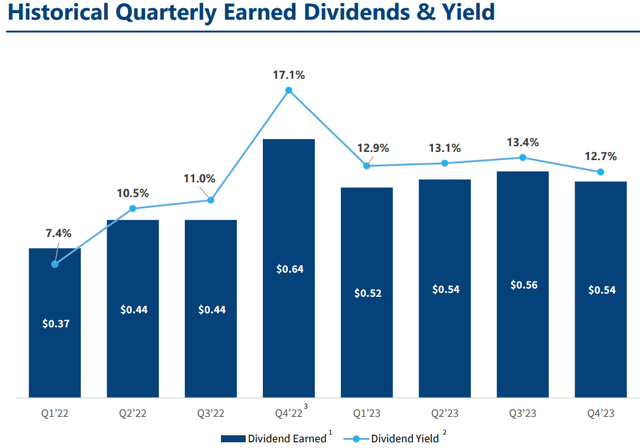
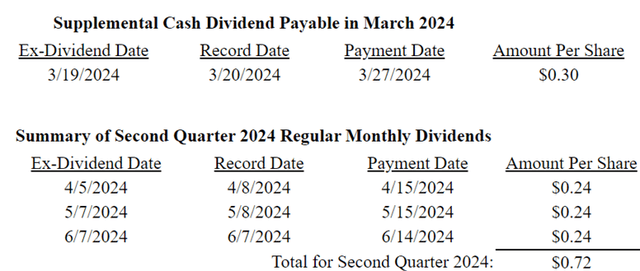
- Dividends: Maintained its regular quarterly distribution of $0.40 per share for Q1 2024 (as expected in the base case projections) with estimated undistributed taxable income (“UTI”) of $42 million or $1.10 per share (previously $1.03 per share). Please note that many of the BDCs that previously reduced their regular dividends had plenty of UTI which is only used for ‘temporary’ dividend coverage issues. Please do not rely on UTI as an indicator of a ‘safe’ dividend.
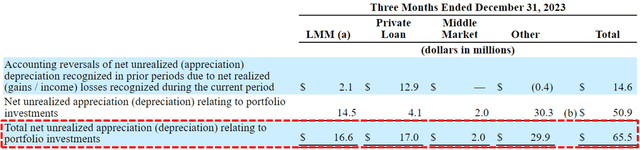
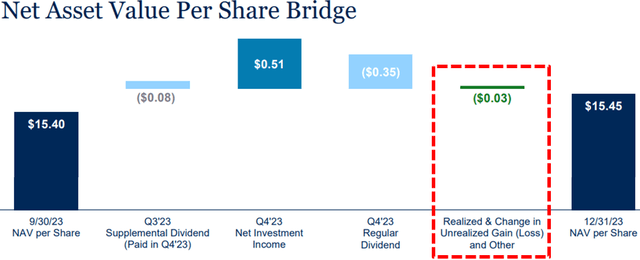
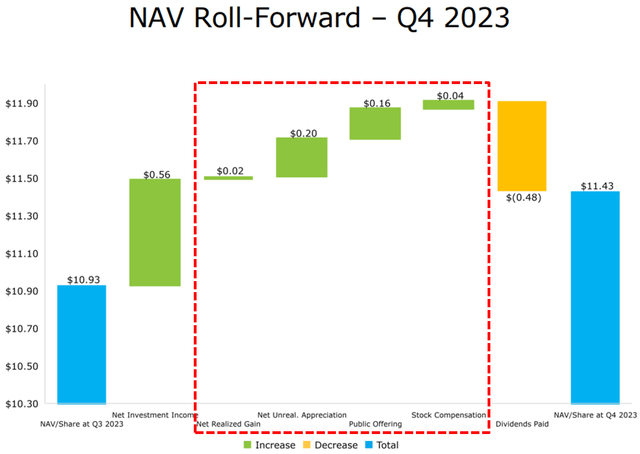
- NAV Per Share: Declined by $1.16 or 11.2% (from $10.37 to $9.21) mostly due to its watch list investments and equity positions including Demain (Luko) which contributed $0.30 per share, Untitled Labs, Mystery Tackle Box (Catch Co.), VanMoof Global Holding, and $0.66 per share related to equity/warrant positions. NAV has declined by over 22% over the last four quarters.
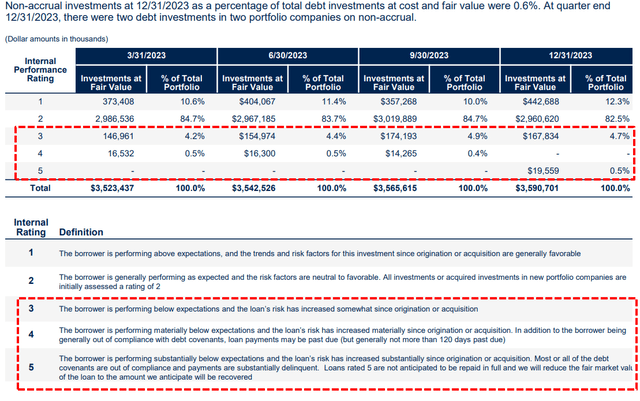
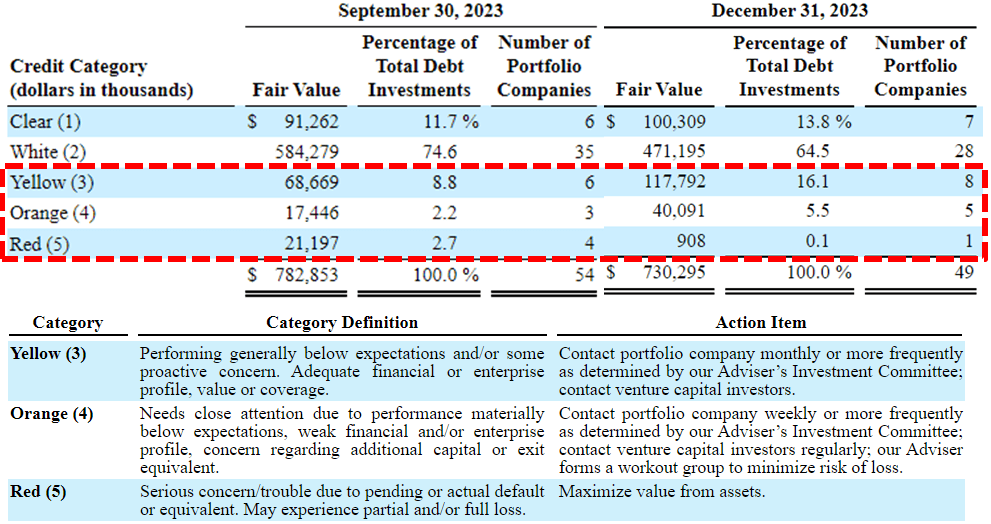
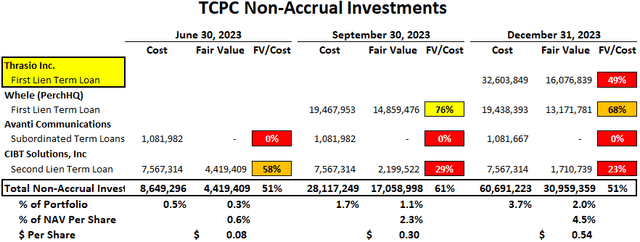
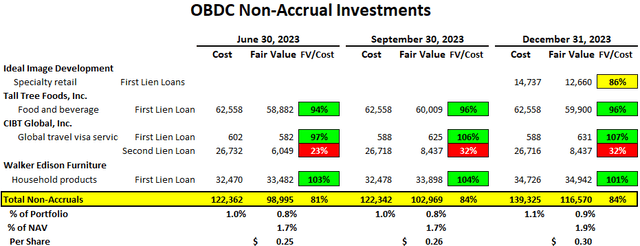
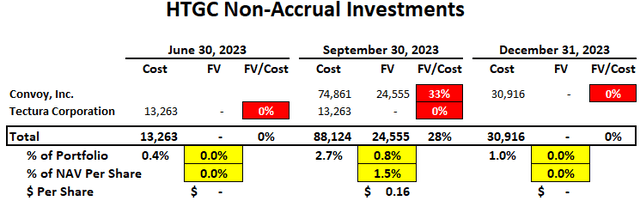
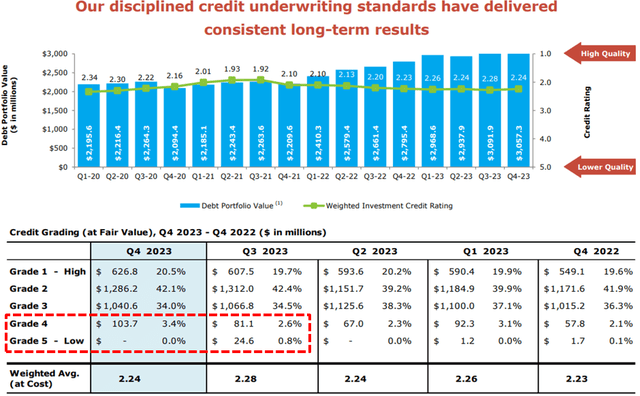
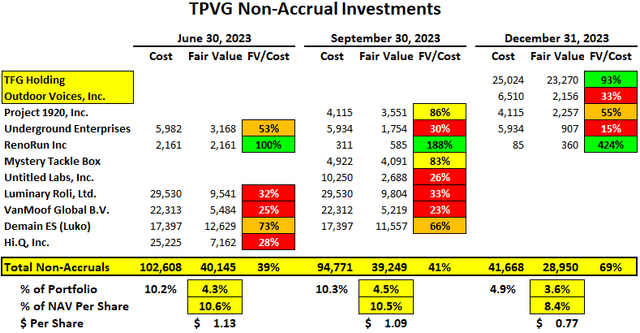
- Credit Quality: Non-accruals decreased from 4.5% to 3.6% of the portfolio fair value due to exiting/restructuring Demain (Luko), Untitled Labs, Mystery Tackle Box (Catch Co.), VanMoof Global Holding, and Luminary Roli Limited partially offset by adding TFG Holding and Outdoor Voices.
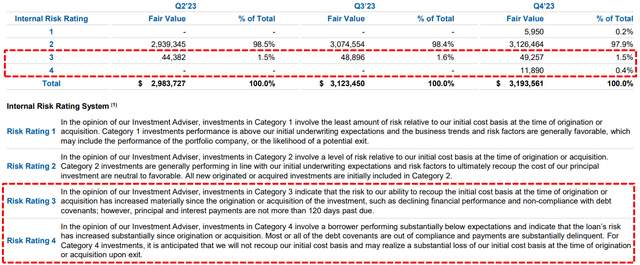
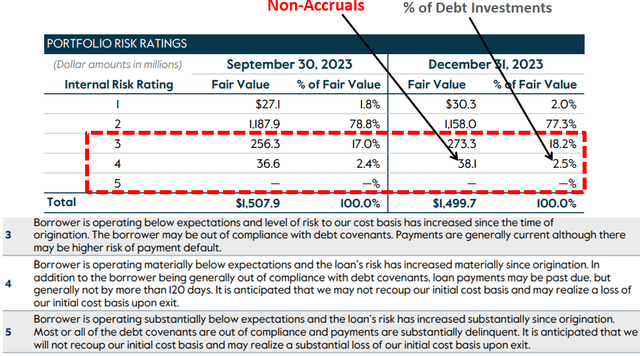
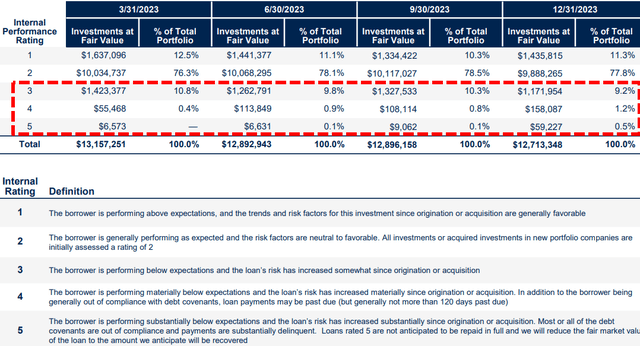
As shown below, the amount of investments that are considered performing “below expectations” increased from 13.7% to 21.7% as of Q4 2023. Please keep in mind that this information is provided by the company.

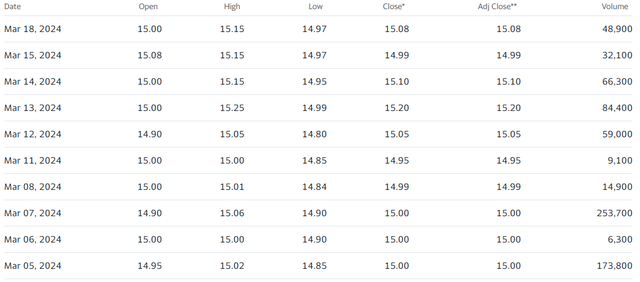
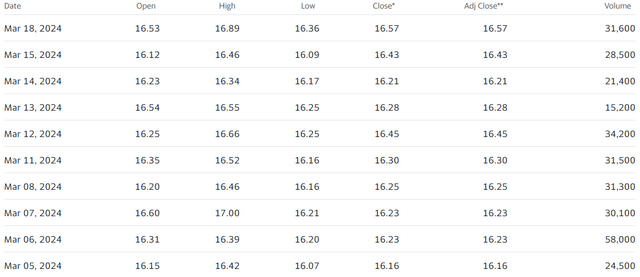
Since December 31, 2023, and through March 5, 2024:
- Entered into $93.6 million of additional non-binding signed term sheets
- Closed $10.0 million of additional debt commitments
- Funded $12.4 million in new investments

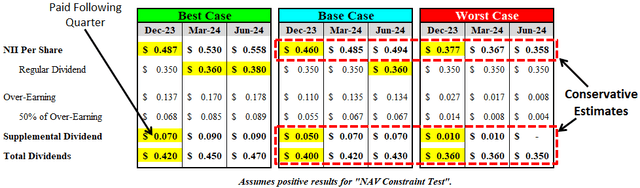
“Due to the shareholder-friendly total return requirement under the incentive fee structure, there were no incentive fees this quarter. Based on our success over earning the dividend, we have undistributed spillover income of $41.5 million or $1.10 per share as of year-end. Given the ongoing elevated yields and size of the income producing loan portfolio, dividend coverage remains strong throughout all of 2023. We believe that given the historically strong level of over-earned dividends and substantial level of spillover income, the current level of regular quarterly dividends are expected to be stable.”
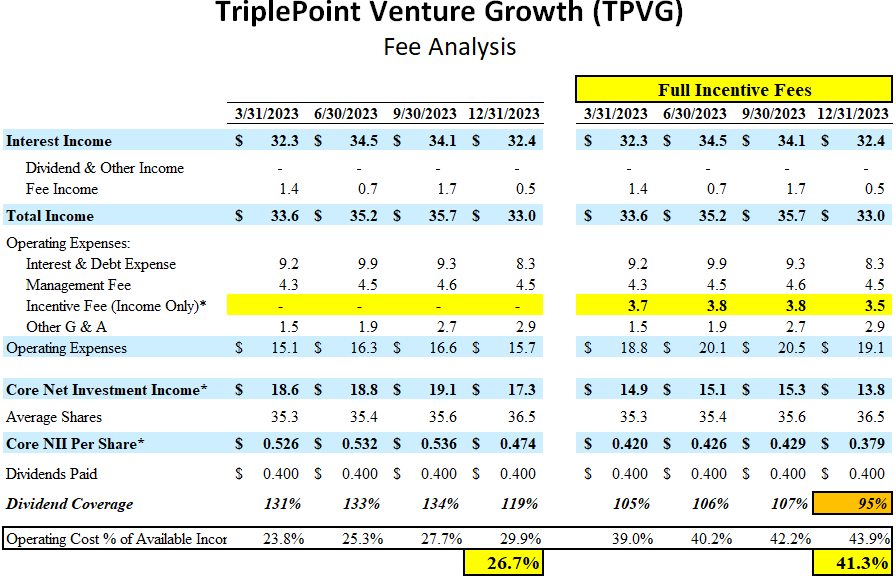
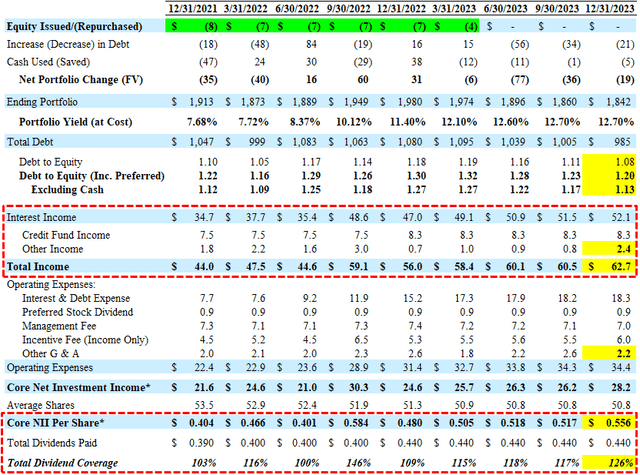
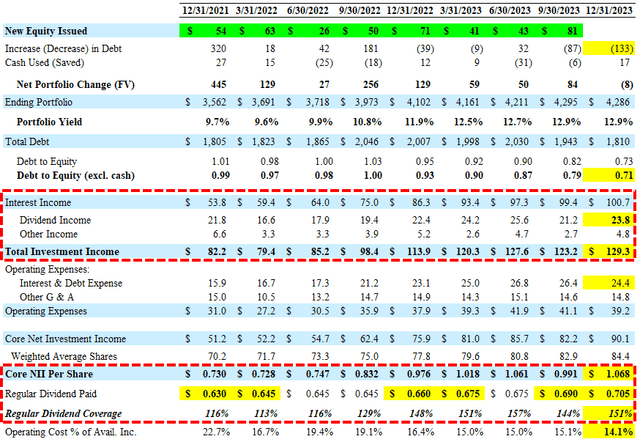
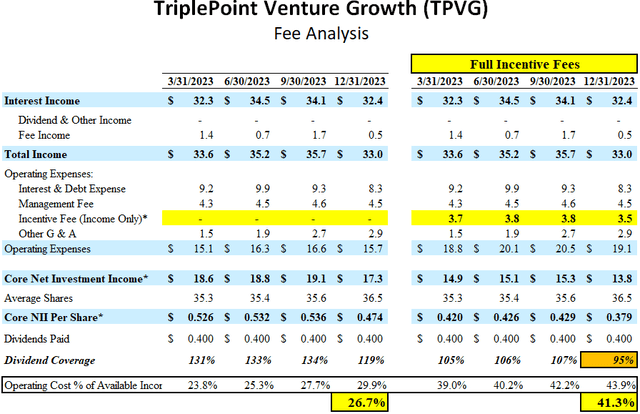
Please note that the historical dividend coverage and excess earnings over the last six quarters is partially from no incentive fees paid due to continued credit issues and its total return hurdle:

If the company paid the full incentive fee for Q4 2023, dividend coverage would have been closer to 95%, which is one of the reasons it remains a ‘Level 2’ dividend coverage BDC.
The following are some of the notes from the recent call which will be discussed in the updated TPVG Deep Dive Projection report later this month:
Q. “How can it be appropriate to sell 1.5 million shares into the market through the ATM program with the knowledge that significant material losses are on the way and a significantly lower NAV is going to be presented to shareholders when you report this quarter.”
A. “So again the ATM is a program that acts on its own, so it’s set and it operates on our……”
Q. “Do you have the ability to shut it down?”
A. “Yes, And then as we said, as developments are learned or known, then we adjust and act according.”
Q. “And then last question for me on dividend. At this point on this quarter’s NAV, it’s about a 17% yield on NAV where the current dividend rate is at. You can talk about you’re probably going to be deleveraging at least in the first half of this year. I guess what can you say kind of thoughts around that payout level and your confidence to generate that level of earnings?”
A. “Yes. So I would say two things. One is, when you think about the elevation of the yields in –60% of our portfolio is floating rate, 40% is fixed. There’s also a substantial portion of our leverage that is fixed rate. So the net interest margin is pretty well protected for at least some period of time in a declining rate environment, so we’re pretty comfortable with that. Also with the declining leverage, there is some room. So one of the things to think about is when –in 2022 2023, when yields were going up, the dividend was increased, but it was not excessively increased during those periods. And as a result, you’ve seen that the spillover income continue for almost two years to increase. So I think there’s substantial ordinary income that’s stored to maintain a stable dividend. But the ordinary income or NII is expected to be pretty stable as well, given the strength of the income-producing portfolio.”
Q. “So you had well over $1 per share of net realized and unrealized losses in the quarter. And that drove an 11% decline in NAV, bringing the year-over-year decline at 23%. So I guess, is there a way to think about future losses across the portfolio moving forward? Are we getting near the end of these write downs and losses? And I’m just trying to think through the trajectory of NAV from here and ultimately when you think it will start to inflect higher.”
A. “The reduction in NAV, if you look through it, there is also $0.66 of that is related to fair value marks on our warrant and equity position. So if you look right again, the cost basis and the fair value of our worn and equity investment portfolio are basically equal. And if you look over the years, historically, that’s –fair value is traded significantly higher. So we believe there is room for that to come back and for us to have gains in excess on an unrealized basis and realized basis on a fair value basis as market conditions improve. With regards to credit, again, I think our credit scores reflect our current view on our existing based on current market conditions. And so, again, we’re seeing some good data points with the increase in equity raising activity of our existing portfolio companies. We discussed some of the specifics for some of the companies in each of the credit ratings and signed term sheets and positive developments. And so again, the market is challenging. We continue to remain proactive and diligent and manage this environment. But again, as conditions improve, we expect both credit profile and fair values to improve as well.”
Q. “I look at it quarter-over-quarter, investments rated yellow or below. Last quarter with 13.7% this quarter was 21.7% of the total portfolio. So big jump there. It’s obviously on fair values accounting for the write downs as well. I guess given that change and the stuff that you’ve mentioned, I mean, how can get comfortable and get the market confident that you guys have stabilized the situations you identified as troubled and that there’s a plan forward here.”
A. “The way I think we look at it is it’s multifactored, right? So the first element is that, as Jim described in detail the market condition. So we are in the winter of all things venture capital. So I think a critical element is in particular, the technology subsector of venture capital and the venture growth stage in particular of these companies that raise large rounds at a high valuation during peak periods. So we’re seeing these companies are getting more impacted than companies at other stages of the venture capital lifespan. So I’d say a significant amount is related to the venture capital, the equity investment activity. And so if we see data points of promising activity of capital raises and increasing capital raises that gives us confidence in terms of the overall outlook for the industry, the sector, and the portfolio. I think the second element of what we talked about is, one of the reasons why we’ve seen a fair amount of challenge too has been this — the weak IPO and M&A markets, in particular the M&A markets, and we described a number of scenarios of transactions essentially collapsing because of the dynamics of these acquisitions where [indiscernible] more robust times, these transactions would have closed, it would have closed at higher values. I think the last piece as we look at the watch list itself. We look at it on a specific name basis and facts and circumstances from our perspective. So very much it’s hard to generalize for a category to say if it’s in a certain category it naturally implies where directly it’s going to end up. I would say very much we look at for each of our reds, oranges, and yellows is each specific name, what the outlook is for those companies market appropriately from a credit rating and from a fair value perspective, and then make sure our teams are as proactive as they can be to manage those situations. I think as I described during the call, I think the good news or some positive outlook is that some positive events are happening within those companies, in those ratings, term sheets and events happening, but until they happen and close, given this environment, we need to remain cautious and optimistic — proactive, and then when those events close, then move them up and upgrade them.”
“Given the challenging capital raising environment for venture growth companies, for some companies we believe we will see continued pressure on valuations and the potential for inside rounds. Some companies are further reducing burn and executing on a path to profitability.”
What Can I Expect Each Week With a Paid Subscription?
Each week we provide a balance between easy-to-digest general information to make timely trading decisions supported by the detail in the Deep Dive Projection reports (for each BDC) for subscribers that are building larger BDC portfolios.
- Monday Morning Update – Before the markets open each Monday morning, we provide quick updates for the sector, including significant events for each BDC along with upcoming earnings, reporting, and ex-dividend dates. Also, we provide a list of the best-priced opportunities along with oversold/overbought conditions, and what to look for in the coming week.
- Deep Dive Projection Reports – Detailed reports on individual BDCs each week prioritized by focusing on buying opportunities and potential issues such as changes in portfolio credit quality and/or dividend coverage (usually related). This should help subscribers put together a shopping list ready for the next general market pullback.
- Weekly General Updates or Comparison Reports – A series of updates discussing ‘Building a BDC Portfolio’, suggested pricing and limit orders, expense/return ratios, interest rates, leverage, BDC Investment Grade Notes/Baby Bonds, portfolio mix, and potential impacts on dividend coverage and risk.