The following information was previously provided to subscribers of Premium BDC Reports along with:
- FDUS target prices/buying points
- FDUS risk profile, potential credit issues, and overall rankings
- FDUS dividend coverage projections (base, best, worst-case scenarios)
![]()
Previous FDUS Article Follow-Up
This article is an update to “I Bought Fidus Investment: 12% Yield And 35% Below Book” that hopefully convinced investors to start a position or buy more of Fidus Investment (FDUS) that has easily outperformed the S&P 500:
As mentioned in the previous article:
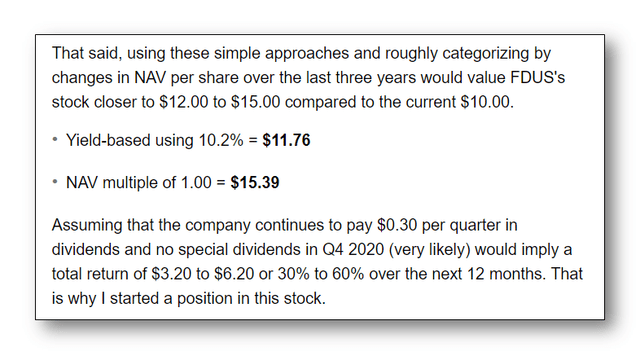
I believe that there’s a good chance for a total return potential of 30% or higher over the next 12 months.
The article provided the following rationale for expected returns including only the regular dividends paid plus price appreciation to $12.00 to $15.00 driving a total return between 30% to 60%.
Good News!
The stock is now $17.88 and the company has increased its regular dividend as well as paying special and supplemental dividends driving a total return approaching 90% after only 11 months. It should be noted that the article also discussed the reasons why I thought the company would increase and/or pay supplemental dividends which are discussed below as well.
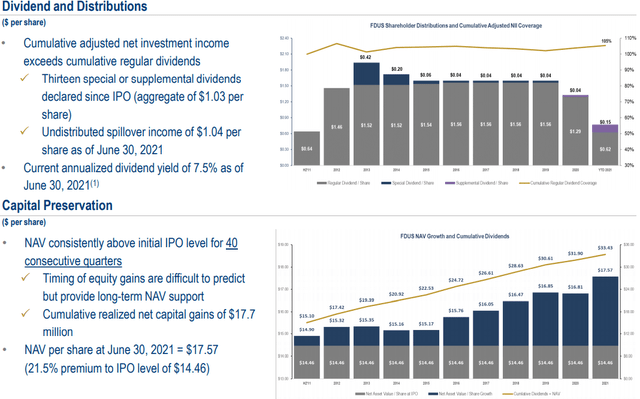
Source: FDUS Q2 2021 Investor Presentation
FDUS Q2 2021 Dividend Coverage Update
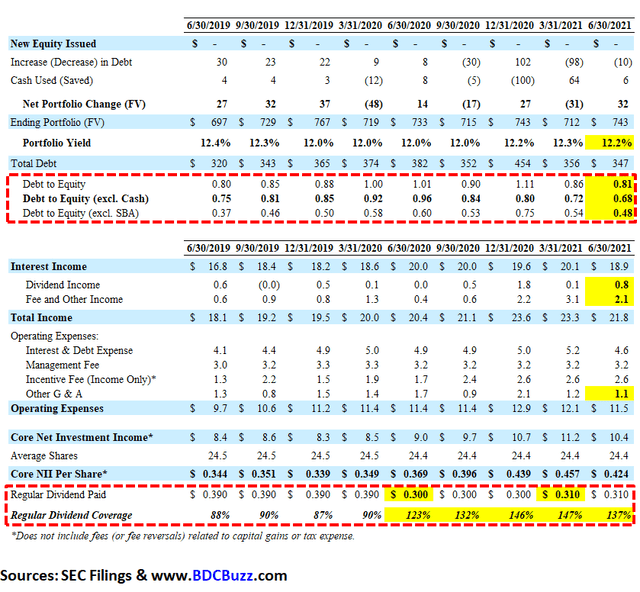
For Q2 2021, FDUS easily beat its best-case projections covering 137% of its quarterly regular dividend due to lower-than-expected ‘Other G & A’ as well as an increase in origination, prepayment, and amendment fees, and higher dividend income due to increased levels of distributions received from equity investments.
Edward Ross, Chairman/CEO: “Our portfolio performed well in the second quarter, generating a 15% increase in adjusted NII year over year. As a result of this solid operating performance along with portfolio fair value appreciation, NAV reached $17.57 per share. Looking ahead, our healthy liquidity places Fidus in a very strong position to carefully build our portfolio of debt investments in lower middle market companies with resilient business models and positive long-term outlooks. Consistent with our track record of managing the business for the long term and deliberate investment selection, we intend to continue to emphasize quality over quantity while remaining focused on capital preservation and generating attractive risk adjusted returns.
Source: FDUS Q2 2021 Earnings Announcement
FDUS Equity Positions & Realized Gains
Most dividend coverage measures for BDCs use net investment income (“NII”) which is basically a measure of earnings. However, some BDCs achieve incremental returns typically with equity investments that are sold for realized gains often used to pay supplemental/special dividends.
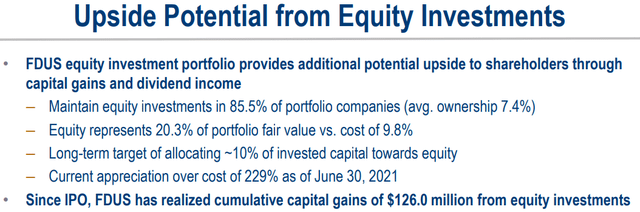
FDUS has equity investments in almost 86% of its portfolio companies which is primarily responsible for net asset value (“NAV” or book value) growth of over 14% in the last 4 quarters and continued realized gains and dividend income to support special/supplemental dividends paid over the last 8 years.
Source: FDUS Q2 2021 Investor Presentation
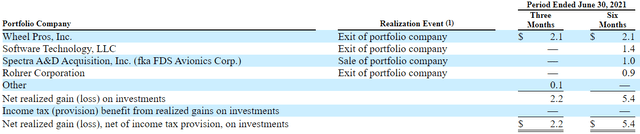
During Q2 2021, there was another $2.2 million or $0.09 per share of realized gains mostly due to Wheel Pros as discussed in the previous report. During the previous quarter, FDUS had net realized gains of $3.2 million or $0.13 per share due to exiting other equity positions including Software Technology, Rohrer, and FDS Avionics.
Source: SEC Filing
On July 26, 2021, FDUS exited its debt and equity investments in Worldwide Express Operations, which was acquired by Worldwide Express resulting in additional realized gains of approximately $3.0 million or $0.12 per share. However, these gains will be partially be offset by a $1.0 million realized loss related to the exit of its debt and equity investments in Hilco Technologies on July 16, 2021.
Subsequent to the quarter end, Hilco Technologies sold. We took control of Hilco in the second quarter and exchanged a $10.3 million debt investment for an equity investment in a new holding company. In conjunction with the sale subsequent to quarter end, we received payment in full on our residual debt and converted equity investment and realized a net loss of approximately $1.0 million of our original equity investment in the company. Due to the Hilco restructuring and exchange of debt for equity, approximately $0.6 million of interest income was converted into dividend income.”
Source: FDUS Q2 2021 Earnings Call
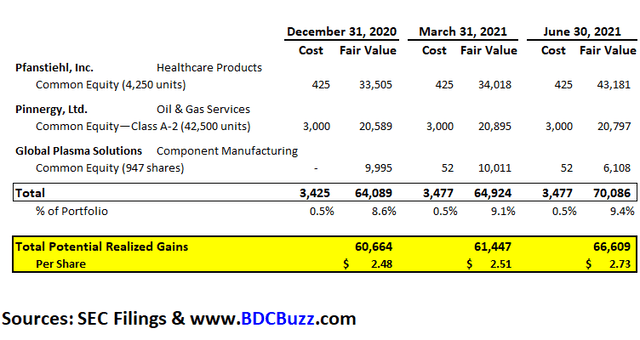
There is the potential for significant realized gains related to the exit of certain equity investments including Pfanstiehl, Inc., Pinnergy, Ltd., and Global Plasma Solutions which were among the largest markups in 2020. If these investments were sold at the fair value as of June 30, 2021, would imply potential realized gains of $66.6 million or $2.73 per share which would likely drive a significant increase in supplemental dividends over the coming quarters. Also, these investments currently account for 9.4% of the portfolio fair value and could be reinvested into income-producing assets driving higher earnings and a potential increase in the regular dividend.
We have equity investments in approximately 85.5% of our portfolio company with an average fully diluted equity ownership of 7.4%. So we do have an expectation for additional realizations and quite frankly, on both the debt and the equity side of things, primarily driven by M&A and so. I think the outlook for realizing some of the portfolio is very positive from that perspective and we would expect that to continue and we are a lot of companies that are pretty right if you will for M&A or some type of transaction. So I view the outlook from a natural perspective to be very good. When I look at the companies we control, we control a couple of companies today and so and then we have impact on some other investments where, maybe the sponsors not in total control of the situation or if it would be a negotiation, if you will, amongst ourselves and other shareholders. I wouldn’t say we’re looking to go, sell those investments right now because there’s a good outlook. But at the same time, so as I think about things, it’s for a little long in equity today, just on a percentage basis. So there’s a balance you got to strike there because I don’t want to sell too early.”
Source: FDUS Q2 2021 Earnings Call
Comparison of Changes in NAV Per Share
The following table is ranked by changes in NAV per share over the last five years with most of the BDCs ranked higher having a larger portion of the portfolio invested in equity positions. Please keep in mind that some of these BDCs could easily experience NAV declines during a recessionary period as equity positions are marked back down (deflated). BDCs with higher amounts of first-lien positions have a much more stable NAV but also do not participate in the higher returns during periods such as this. Hopefully, these BDCs will be selectively trimming their equity positions (also known as harvesting) and reinvesting into income-producing assets improving dividend coverage and stabilizing NAV in case of an economic downturn.
Please note that many of the higher quality BDCs have been paying large special and supplemental cash dividends which directly impacts NAV (negatively). These BDCs will be discussed in this series of articles.

FDUS Leverage & Portfolio Yield
Management is targeting a debt-to-equity ratio (leverage) of 1.00 which I have taken into account with the updated projections:
Q. “Just remind us where you plan to take the business from a regulatory leverage perspective.”
A. “I think we have said one-to-one especially given the complexion of our portfolio, which was weighted more towards junior debt. As you know that the portfolio is changing or the complexion of the portfolio is changing to more first lien originations and the exit of some of the second lien investments just from, just as an in natural course, should I say? So hopefully that’s helpful, but that’s how we’ve kind of thought about it as, very comfortable around the one-to-one, but we have increased flexibility today due to the complexion of the portfolio changing.”
Source: FDUS Q2 2021 Earnings Call
Also taken into account is slightly lower portfolio yield but continued fee income from portfolio activity including new originations and prepayments:
“Yields are 12% to 12.2% for us on the debt portfolio. If they were to move, I would say it probably moved down a little bit just due to yield environment and competition. I don’t expect any major swings there, but that’s kind of the, where we are today and from a competitive standpoint. So until still yields start to move forward, I would expect that there may be some very modest drifting down, that makes sense.”
Q. “On fee income note, can be rather volatile quarter to quarter, but maybe in 2022 is activity moderates, would you expect 2022 fee income to be below 2021 levels?”
A. “There’s no change in strategy from our perspective that we would expect originations to continue to be healthy in 2022 and thus there would be something income with that. We also think there’ll be some repayments, but as you heard today, think one of the six investments we had repayment penalties so not all of them have. I mean they all have them, but they expire usually after a couple of three years. So, but I would expect at least whether we match the same level of fees in 2022 versus 2021, I don’t know, but I don’t expect it to be dramatically lower at this point at all. I wouldn’t, I don’t foresee that.”
Source: FDUS Q2 2021 Earnings Call
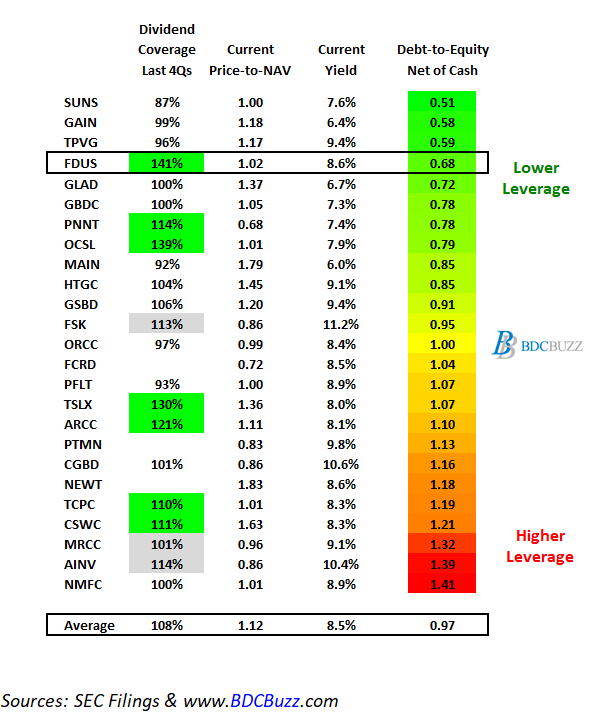
As shown in the following table, FDUS has lower leverage (debt-to-equity) combined with higher dividend coverage over the last four quarters. I have not included the dividend coverage averages for FCRD and PTMN because I do not cover these BDCs due to having higher risk portfolios and they are thinly traded. I cover NEWT but it has a very different business model as discussed in “Newtek Business Services: Initiating Coverage“.
AINV, MRCC, and FSK have recently had higher dividend coverage only due to not paying incentive fees related to previous capital losses. Dividend coverage will decline once these companies start paying incentive fees. Also, BDCs such as SUNS with lower leverage have access to growth capital to improve dividend coverage and are likely just taking a cautious approach to rebuild their portfolios during the economic recovery.
Summary
FDUS has adopted a dividend strategy that includes an easily sustainable regular dividend as well as a variable portion to pay out the excess earnings as needed (similar to other BDCs) and was discussed on the recent call:
As a reminder, the board has devised a formula to calculate the supplemental dividend each quarter, under which 50% of the surplus and adjusted NII over the base dividend from the prior quarter, distributed to shareholders. For the third quarter, I am pleased to report that we are increasing the base dividend at $0.32 per share, and the surplus is $0.06 per share. In addition, we will pay a special dividend in Q3 of $0.04 per share. Therefore on August 2, 2021, the board of directors declared a base quarterly dividend of $0.32 per share, a supplemental quarterly cash dividend of $0.06 per share, and especial dividend of $0.04 per share.”
Source: FDUS Q2 2021 Earnings Call
On August 2, 2021, the Board increased its regular quarterly dividend from $0.31 to $0.32 per share, plus a supplemental dividend of $0.06 per share, and a special dividend of $0.04 per share for Q3 2021. FDUS has around $1.04 (previously $0.98) per share of spillover income (or taxable income in excess of distributions) that can be used for additional supplemental dividends.
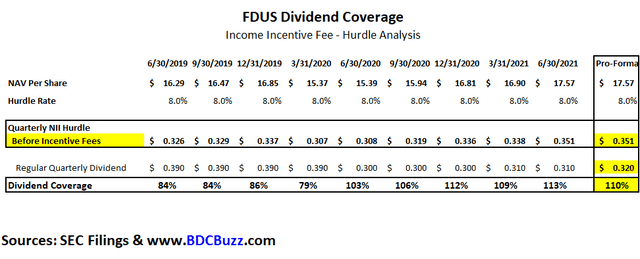
I am expecting additional increases in the regular dividend plus continued supplemental/special dividends through the use of higher leverage and additional realized gains from equity positions combined with its generous 8% hurdle rate which is applied to “net assets” to determine “pre-incentive fee net investment income” per share before management earns its income incentive fees. As shown in the following table, the company will likely earn around $0.351 per share each quarter before paying management incentive fees covering around 110% of the previously increased dividend which is ‘math’ driven by an annual hurdle rate of 8% on equity. It is important to keep in mind that FDUS could earn less than $0.351 per share but management would not earn an incentive fee for that quarter as shown in the ‘worst case’ financial projections.
What Can I Expect Each Week With a Paid Subscription?
Each week we provide a balance between easy to digest general information to make timely trading decisions supported by the detail in the Deep Dive Projection reports (for each BDC) for subscribers that are building larger BDC portfolios.
- Monday Morning Update – Before the markets open each Monday morning we provide quick updates for the sector including significant events for each BDC along with upcoming earnings, reporting, and ex-dividend dates. Also, we provide a list of the best-priced opportunities along with oversold/overbought conditions, and what to look for in the coming week.
- Deep Dive Projection Reports – Detailed reports on at least two BDCs each week prioritized by focusing on ‘buying opportunities’ as well as potential issues such as changes in portfolio credit quality and/or dividend coverage (usually related). This should help subscribers put together a shopping list ready for the next general market pullback.
- Friday Comparison or Baby Bond Reports – A series of updates comparing expense/return ratios, leverage, Baby Bonds, portfolio mix, with discussions of impacts to dividend coverage and risk.
![]()
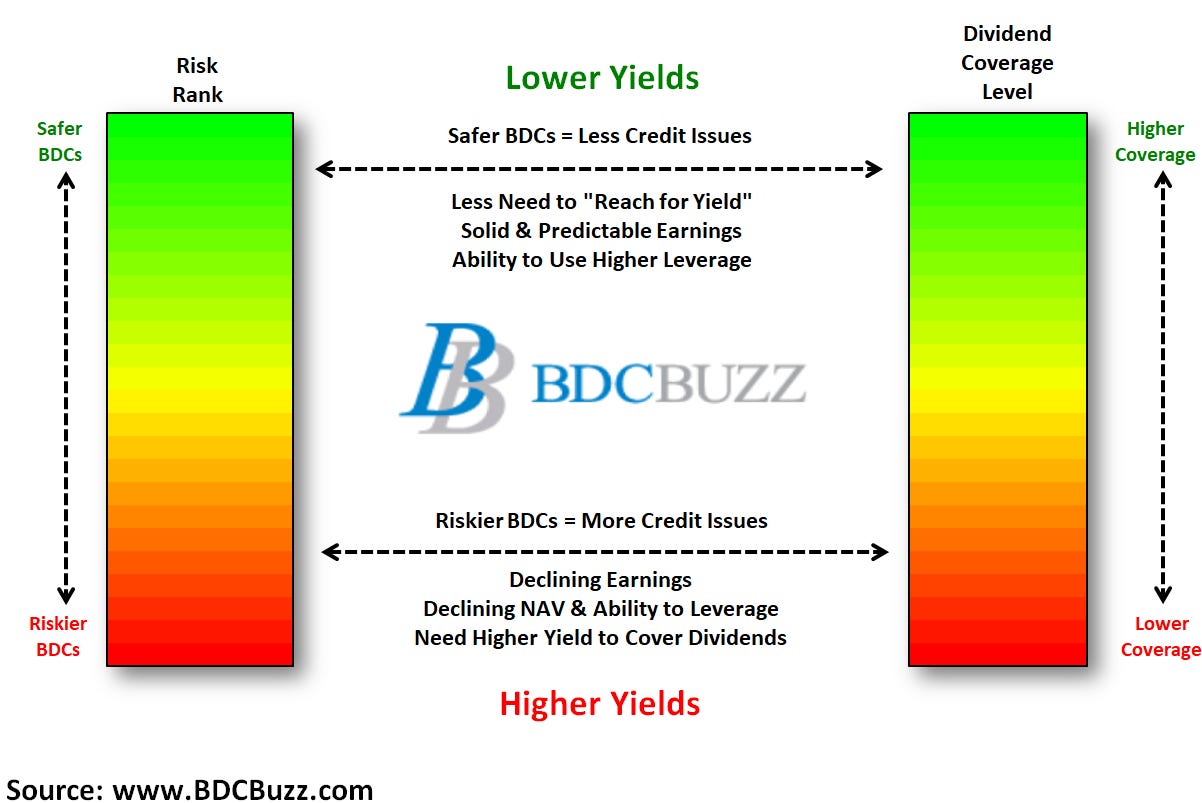
This information was previously made available to subscribers of Premium BDC Reports. BDCs trade within a wide range of multiples driving higher and lower yields mostly related to portfolio credit quality and dividend coverage potential (not necessarily historical coverage). This means investors need to do their due diligence before buying.