
The following is from the TSLX Deep Dive that was previously provided to subscribers of Premium BDC Reports along with revised target prices, dividend coverage and risk profile rankings, potential credit issues, earnings/dividend projections, quality of management, fee agreements, and my personal positions for all business development companies (“BDCs”).
————-
TSLX Dividend Coverage Update
TSLX has covered its regular dividend by an average of 134% over the last four quarters, growing undistributed taxable income and capital gains to over $1.25 per share.
“As we said before, if we believe there is sustainable increase in the earnings power of the business by operating in our target leverage range for an extended period of time, then we would look to resize our base dividend in context of the underlying earnings power of the business to ensure we’re optimizing cash distribution and satisfying risk related distribution requirements. We will continue to monitor undistributed taxable income and gains closely as part of our ongoing review of our distribution strategy.”
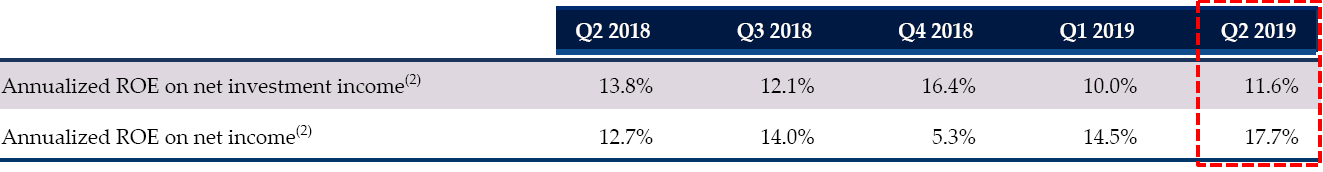
TSLX announced a special/supplemental dividend of $0.04 per share payable in September and annualized ROE for the second quarter 2019 was 11.6% and 17.7% on a net investment income and a net income basis, respectively.
“Our Board also declared a $0.04 per share supplemental dividend to shareholders of record as of August 30, payable September 30. This marks the 10th consecutive supplemental dividend since we introduced this framework in Q1 of 2017. To date, we have declared a total of $0.58 per share in supplemental dividend to our shareholder for an increase of 15% over our base dividend level, while also growing net asset value per share by 4% over this period.”
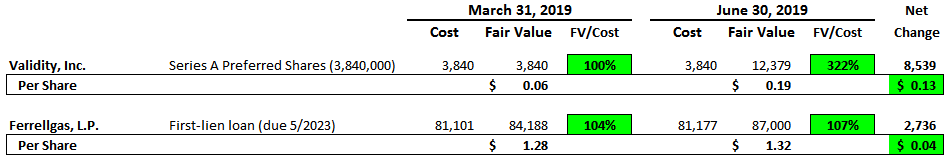
During Q3 2019, there will likely be around $0.13 per share of realized gains related to the exit of its preferred equity investment in Validity, Inc. that will be used to support upcoming supplemental dividends. This investment was discussed on the recent call:
“Note that the increase in the fair value mark on our convertible preferred equity investment in Validity contributed a positive $0.13 per share to this quarter’s net unrealized gain. We continue to hold our convertible preferred equity investment and updated the fair value mark to reflect the valuation from the recent equity investment. We expect to realize our investment at current fair value mark in the near term. If realized, any gains on our equity position at the time of exit would be unwound from the balance sheet and recognized into net income, but won’t flow through to net investment income.”
I am expecting a conservative amount of $0.21 per share of supplemental dividends paid in 2019 (takes into account the $0.12 per share paid in Q1 2019) which will most likely be higher, especially given the likelihood of additional realized gains. Management gave 2019 NII guidance of $1.77 to $1.85 which is likely conservative, similar to 2017/2018 guidance.
“Based on the strength of our investment pipeline, the earnings power of the portfolio and our expectations for fee-related activity for the remainder of the year, we believe we remain on pace to achieve our 2019 NII per share target of $1.77 to $1.85.”
For Q2 2019, TSLX beat its best-case projections due to much higher-than-expected portfolio growth during the quarter driving higher leverage and covering its dividend by 125%.
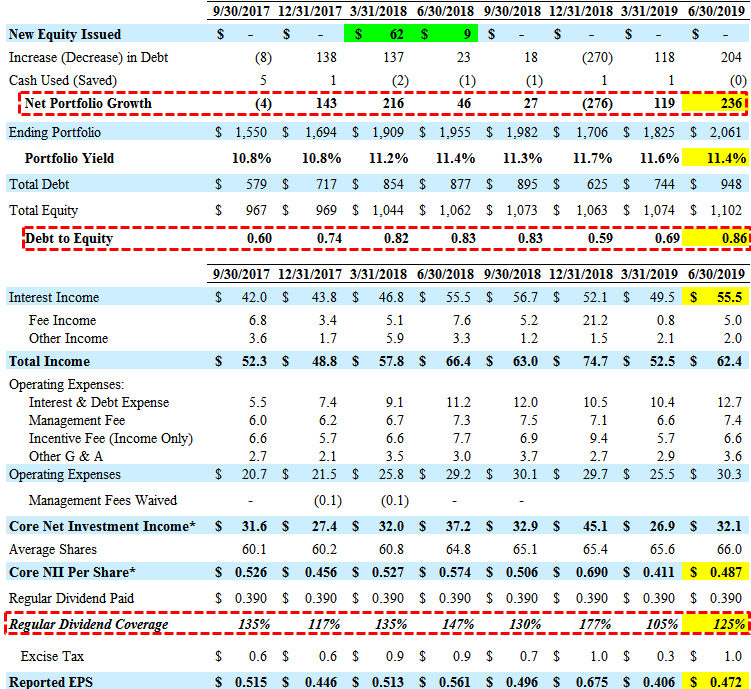
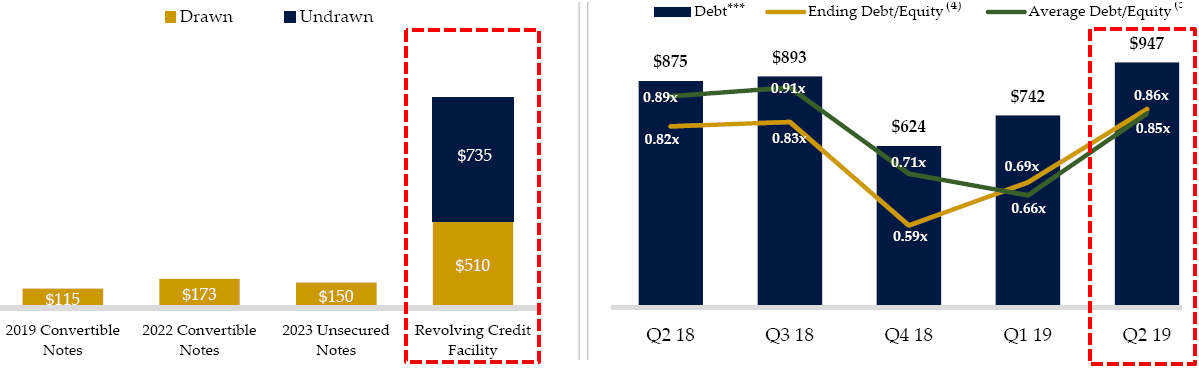
Repayments and exits during Q4 2018 drove its debt-to-equity to a four year low of 0.59 that has increased to 0.86 in Q2 2019 due to stronger portfolio growth.
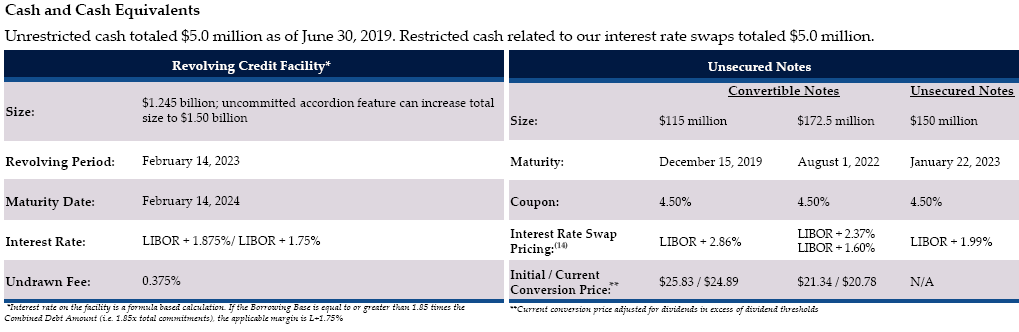
During Q2 2019, the company increased its revolving credit facility by another $75 million that will be used to refinance its higher rate 2019 convertible notes. However, I am expecting additional unsecured notes to be issued at some point as discussed by management. It should be noted that 100% of TSLX’s borrowings are at variable rates (based on LIBOR) but the company is adequately positioned for rising interest rates due to ‘match funding’ with 100% of debt investments at variable rates. The company still has $735 million of undrawn capacity on its revolving credit facility for additional growth in 2019.
“Shifting to the right side of our balance sheet, during the quarter, we upsized our revolving credit facility by $75 million to $1.245 billion, with the addition of a new lender to our bank group. At quarter end, we had significant liquidity with $735 million of undrawn revolver capacity. Given the ample liquidity and low marginal cost of funding under our revolver, our base case is to repay the $115 million of convertible notes that mature in December with this facility. As a reminder, by swapping our fixed rate debt to floating rate, we provide net interest margin expansion for our business in falling rate environment once LIBOR dips below the floor on our portfolio.”
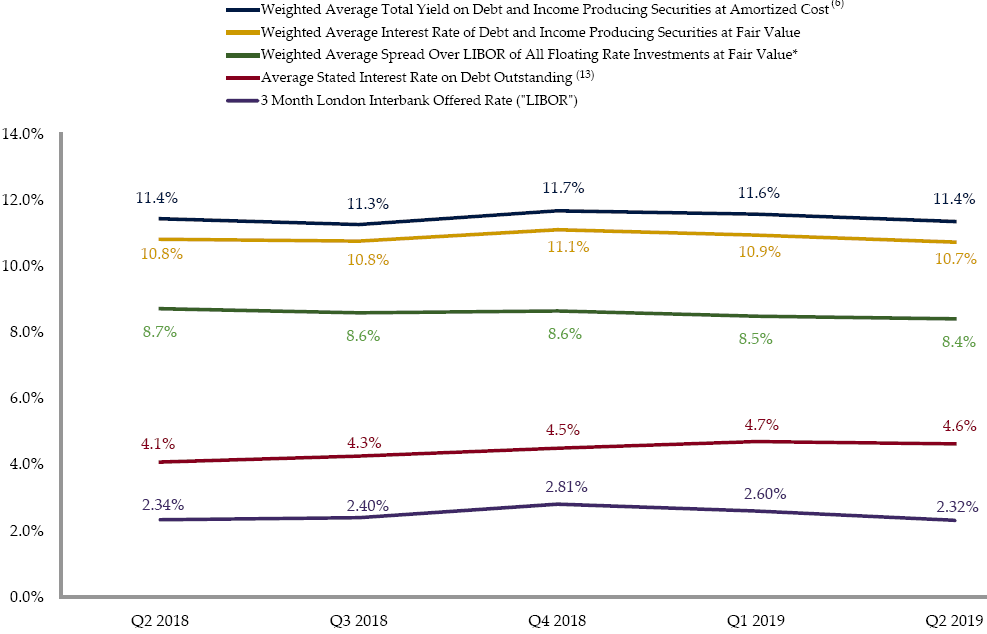
There was another decline in its portfolio yield (from 11.6% to 11.4%) due to new investments at lower yields.
“The weighted average total yield on our debt and income-producing securities at amortized cost was 11.4% compared to 11.6% at March 31. The decrease was primarily driven by the movement in LIBOR during the quarter on our floating rate debt portfolio.”
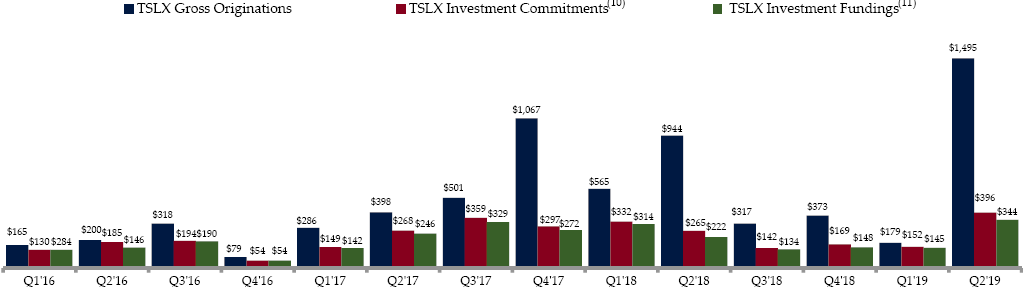
TSLX management continues to produce higher returns by investing in distressed companies through excellent underwriting standards that protect shareholders during worst-case scenarios including call protection, prepayment fees and amendment fees backed by first-lien collateral of the assets. Historically, higher returns have been partially driven by these strong financial covenants and call protections during periods of higher amounts of prepayments (discussed below) and worst-case scenarios (discussed at the end of this report). However, similar to previous reports, the base case projections do not include large amounts of fee and other income related to early repayments.
“Given our direct origination strategy, 99% of our portfolio by fair value was sourced through non-intermediated channels. At quarter-end, we maintained effective voting control on 83% of our debt investments and averaged 2.1 financial covenants per debt investment consistent with historical trends. And we continue to have meaningful call protection on our debt portfolio of 103.4 as a percentage of fair value as a way to generate additional economic should our portfolio get repaid in the near term.”

It also important to point out that the company is able to cover dividends with recurring sources as discussed by management on previous calls:
“As we’ve said in the past, in environments where we receive elevated levels of prepayments and a decrease in our financial leverage ratio, we would expect elevated levels of other fees. However, if repayment activity were to decline, then we would expect to leg back into our target leverage ratio, contributing more rapidly to our interest and dividend income line.”
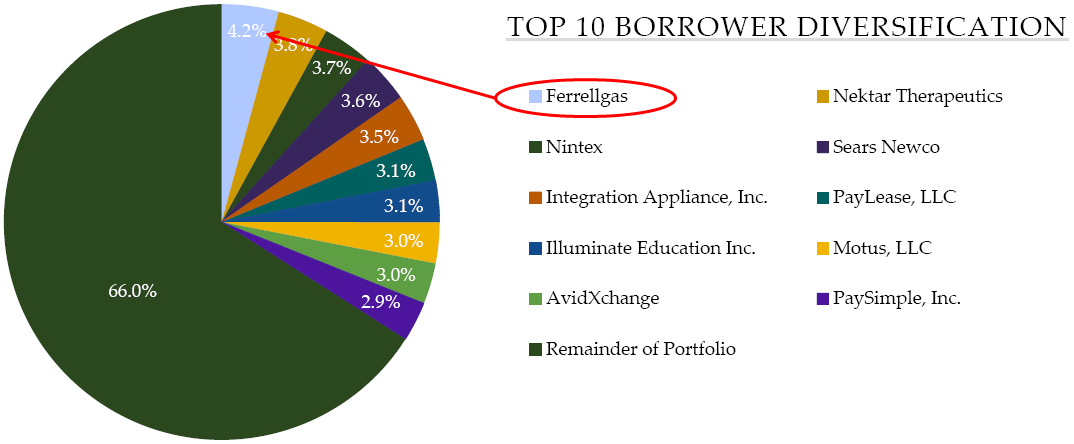
As discussed in previous reports, Ferrellgas Partners remains its largest investment and is currently valued almost $6 million over cost or $0.09 per share and will likely drive another large special dividend.
Previous call: “Ferrellgas is a publicly-traded distributor of propane with an enterprise value of $2.3 billion. The company has a defensive core business with high return on invested capital and a strong management team but faced refinancing difficulties given the challenging regulatory environment for banks. Due to our ability to provide a fully underwritten financing solution through co-investments from affiliated funds we were able to structure a first lien last out position at a low attach point of 0.2X at a low net leverage of 1.7X with highly attractive adjusted returns.”
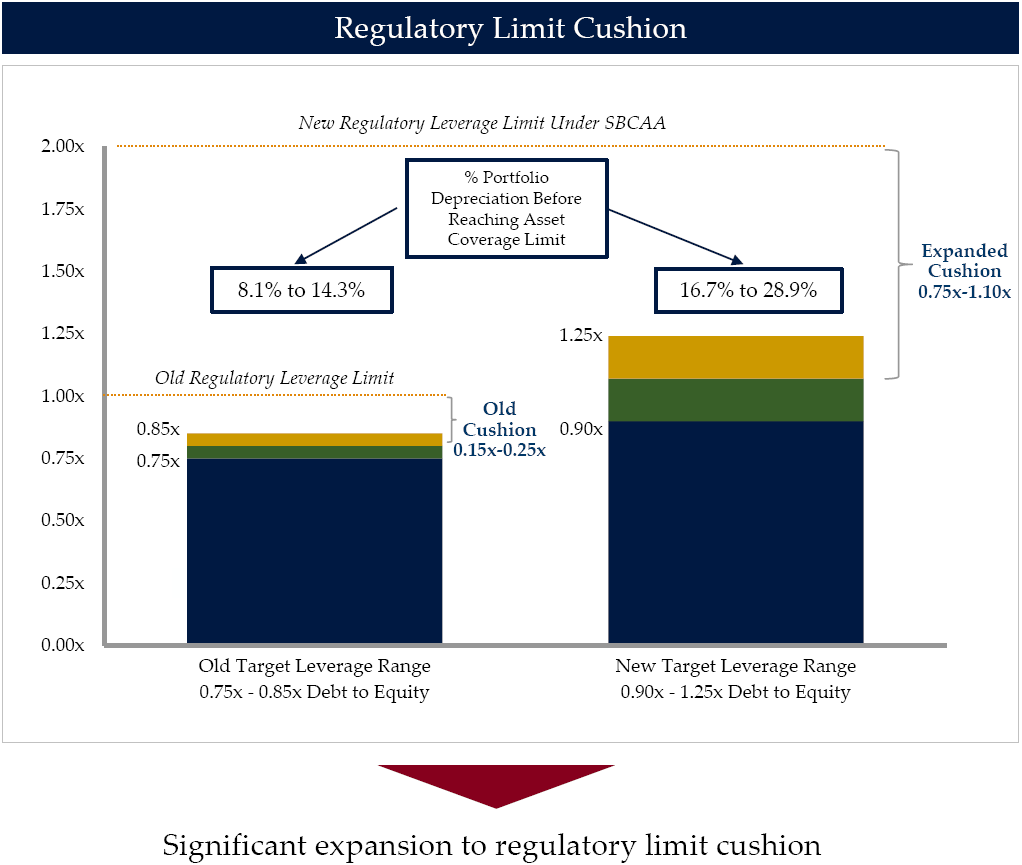
In October 2018, TSLX’s shareholders overwhelmingly approved the proposal to allow the company to increase leverage by approving the application to the company of a minimum asset coverage ratio of 150% effective October 9, 2018. TSL Advisers, LLC intends to waive a portion of the management fee in excess of an annual rate of 1.0% on assets financed with higher leverage and revised its target debt-to-equity range from 0.75-0.85 to 0.90-1.25.
“If we get to the 1.25 times debt-to-equity ratio, which I am not seeing we are going to get there anytime soon. Earnings per share as it’s kind of at $2.25 to $2.35 range. It feels like we are on our way. I don’t think, we’ll be at 1.25 by the end of the year. And that the sense is that, if there is churn and financial leverage, we’ll have an increase in fee income that supports our ROE.”
The table below illustrates the impact on ROEs at differing levels of leverage (debt-to-equity) with higher and lower assets yields:
“As we said in the past, in periods where we see a decrease in our financial leverage, we would expect elevated levels of other fees from repayment activity to support our ROEs. We believe our revised financial policy will allow us to drive incremental ROEs for our shareholders as we reached the higher end of our leverage target.”
“We’ve added Slide 16 to our presentation material this quarter to isolate the impact of balance sheet leverage on the earnings power of our business. The table at the top of the page shows our unit economics based on annualized results for the first quarter. Below that, the sensitivity table illustrates that for each asset level yield, holding constant operating expense ratio and increasing financial leverage corresponds to an increase in ROE. We know that this concept is relatively intuitive. So the sensitivity table is really meant to help people calibrate the magnitude of leverage on ROE for our business. Looking ahead to Q2, based on the increase in our leverage from an average of 0.66 times in Q1 to our estimate of 0.83 times today, we would expect to experience approximately 70 basis points of annual ROE expansion even if we have seen the same low level of activity-related fees and asset yields as Q1.”

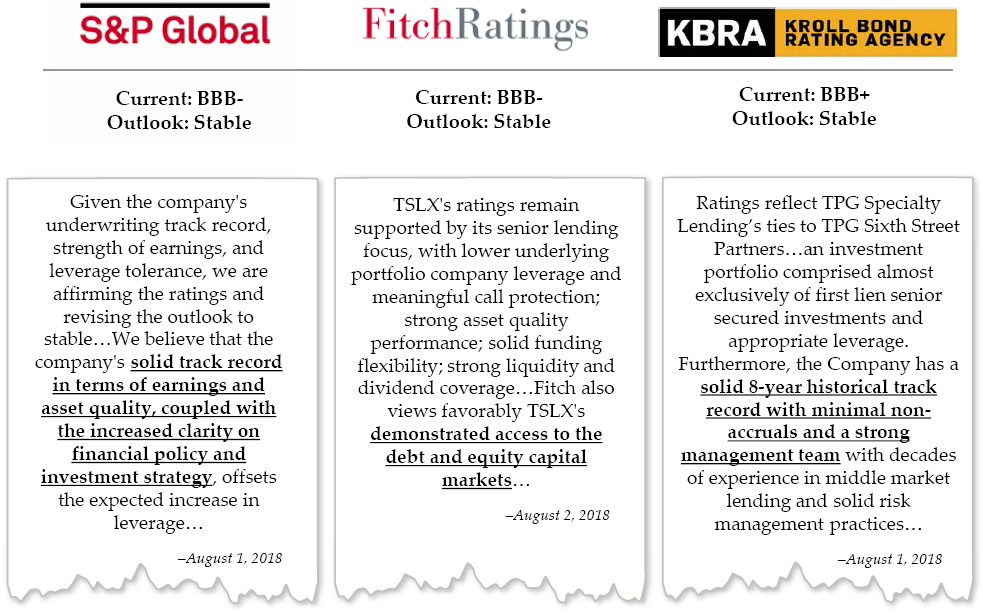
The following are the investment-grade ratings from Fitch, S&P and Kroll under the new target leverage range of 0.90x-1.25x debt-to-equity.
TSLX Risk Profile Update
TSLX continues to selectively growing its portfolio using prudent amounts of leverage, onboarding higher-than-average credit quality first-lien investments at higher-than-market yields and providing better-than-average dividend coverage and returns to shareholders. As discussed earlier, TSLX has excellent underwriting standards that protect shareholders during worst-case scenarios including voting control, call protection prepayment fees and amendment fees backed by first-lien collateral of the assets.
“Given our direct origination strategy, 99% of our portfolio by fair value was sourced through non-intermediated channels. At quarter end, we maintained effective voting control on 83% of our debt investments and averaged 2.1 financial covenants per debt investment consistent with historical trends. And we continue to have meaningful call protection on our debt portfolio of 103.4 as a percentage of fair value as a way to generate additional economic should our portfolio get repaid in the near term.”

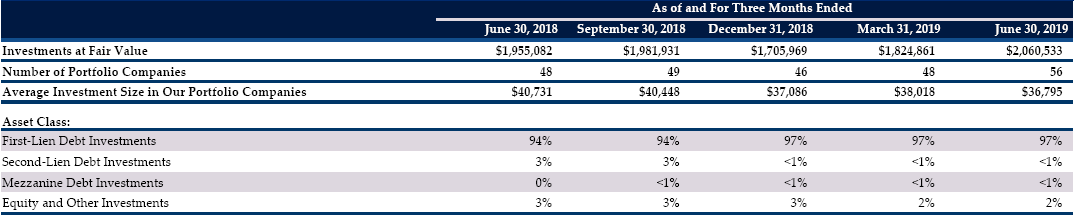
“Our portfolio’s diversification profile benefit from this quarter’s funding activity, quarter-over-quarter, the number of portfolio companies increased from 48 to 56, our average investment size decreased slightly from $38 million to $37 million and our top 10 borrower concentration decreased from 37.8% to 34% of the portfolio at fair value. We continue to be late cycle minded with our exposure to non-energy cyclical industries at an all-time low of 3% of the portfolio at fair value. As a reminder, this figure excludes our retail asset based loan investments, which are supported by liquid collateral values and are not underwritten based on enterprise value, which tends to fluctuate.”
As of June 30, 2019, 100% of the portfolio was meeting all payment and covenant requirements. First-lien debt remains around 97% of the portfolio and management has previously given guidance that the portfolio mix will change over the coming quarters with “junior capital” exposure growing to 5% to 7%.

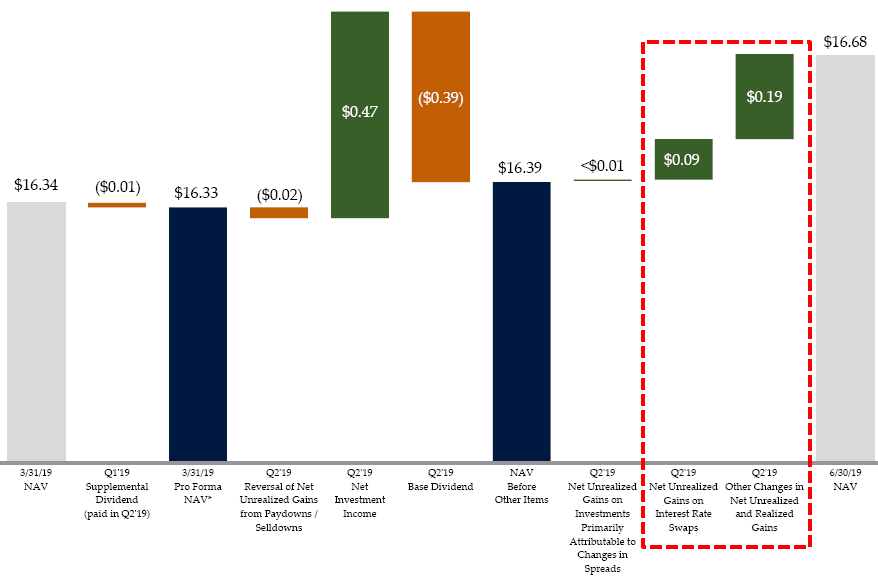
During Q2 2019, TSLX’s net asset value (“NAV”) per share increased by $0.34 or 2.1% (from $16.34 to $16.68) due to overearning the dividends by $0.07 per share after excluding excise tax, unrealized gains on its interest rate swaps of $0.09 per share and $0.19 per share of changes in portfolio valuations including Validity, Inc. discussed earlier and Ferrellgas Partners, L.P. (FGP) together accounting for around $0.17 per share of unrealized gains:
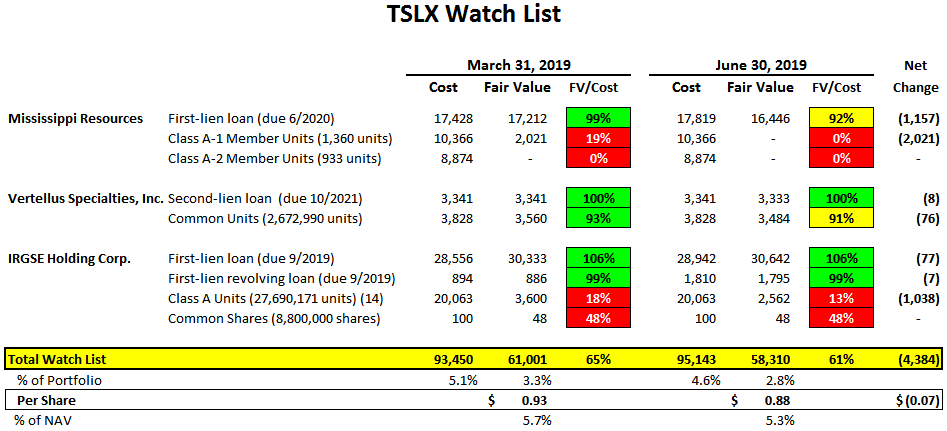
There were some additional markdowns in the three ‘watch list’ investments Mississippi Resources, Vertellus Specialties, and IRGSE Holding Corp. but mostly related to the equity positions as shown in the following table. However, its first-lien position in Mississippi Resources was marked down to 92% of cost and needs to be watched:
“The difference between this quarter’s net investment income and net income was primarily driven by net unrealized gains specific to individual portfolio companies and net unrealized mark to market gains related to our interest rate swaps given the change in the shape of the forward LIBOR curve.”
It is important for investors to understand that one of TSLX’s strategies for higher IRRs is investing in distressed retail asset-based lending (“ABL”) as “traditional brick and mortar retail gives way to the rise of e-commerce”. Historically, borrowers have paid amendment fees to avoid even higher prepayment fees if they decided to refinance. Also, the amendments included an additional “borrowing base” providing increased downside protection on the investment. This strategy continues to drive higher fee income including prepayment and amendments fees. See the end of this report for previous examples.
“Retail ABL continues to be one of our various themes given the ongoing secular trends in our platform’s differentiated capabilities and relationships in this area. As the direct lending asset classes become increasingly competitive, we have continually developed and evolved our investment themes in order to generate a robust pipeline of strong risk-adjusted return opportunities.”
“This quarter’s portfolio activity highlights the distinct competitive advantage that our platform offers from a sourcing and scale perspective. Let me take a moment to provide a few examples. We were active on our retail ABL team during the quarter with new investments in Barneys, Maurices and Sable. Together, these three names comprise $200 million of originations, $85 million of which were allocated to affiliated funds or third parties. As we’ve said on our previous earnings calls, we continue to like being a solution provider in this space, given the ongoing secular trends from brick and mortar retailers and our platforms’ human capital expertise. Inclusive of this quarter’s repayment of the Payless DIP loan, we’ve generated an average gross unlevered IRR of 22% across our fully realized retail ABL investments.”
From previous call: “What really matters is, how we think the inventory will liquidate as it compares to what – where we are lending against it. Retail goes as well as the consumer. That is not the – that’s not what’s happening here, right. Consumer is in good health. There is a business model issue and a structural issue with retail, but more so given the fixed cost base and given the discerning mediation of both kind of fast brands and plus Amazon and omni-channel business models. And so, it’s really the liquidation value of inventory and the liquidation value of the inventory has held up great. So, we continue to hope for a decent amount of structural change. So we can provide capital and provide – be a solution provider into that space. And quite frankly, the liquidation values continue to hold up very, very, very well.”
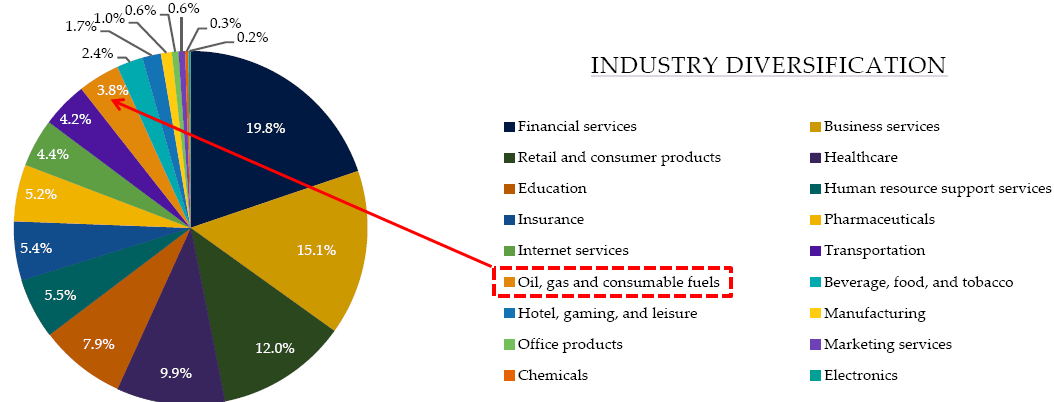
Similar to investing in distressed retail assets, the company is focused on increasing returns through investing opportunistically in oil/energy but only first-lien “with attractive downside protective features in the form of significant hedged collateral value at current price levels”. Management has mentioned that energy exposure would not exceed 10% of the portfolio and only first-lien using appropriate hedges. TSLX made “opportunistic” investments in Verdad Resources in Q2 2019, MD America Energy during Q4 2018, Ferrellgas Partners during Q2 2018 and Northern Oil & Gas in Q4 2017 that was previously repaid.
“Another transaction this quarter that highlights our platform’s capabilities is the $225 million term loan facility that we sold at an agent for the Verdad Resources, an upstream E&P company with primary operations in the DJ Basin. This opportunity was sourced with our energy team and coincided with our opportunistic approach of providing first lien reserve based loans to upstream companies situated low on their cost curves at current price levels. Our platform sector expertise and ability to act in size allows us to structure a customized one-stop solution for the company and its sponsor at pricing in terms that provide a strong risk return profile on our investment. Inclusive of the $42.2 million par value loan that we funded for Verdad, our portfolio’s total energy exposure of the quarter remained low at 3.8% of portfolio at fair value.”
This information was previously made available to subscribers of Premium BDC Reports, along with:
- TSLX target prices and buying points
- TSLX risk profile, potential credit issues, and overall rankings
- TSLX dividend coverage projections and worst-case scenarios
- Real-time changes to my personal portfolio
To be a successful BDC investor:
- As companies report results, closely monitor dividend coverage potential and portfolio credit quality.
- Identify BDCs that fit your risk profile.
- Establish appropriate price targets based on relative risk and returns (mostly from regular and potential special dividends).
- Diversify your BDC portfolio with at least five companies. There are around 50 publicly traded BDCs; please be selective.