Head-To-Head Public Article Preview: ORCC Versus GSBD
The following information was previously provided to subscribers of Premium BDC Reports along with:
ORCC and GSBD target prices/buying points
ORCC and GSBD risk profiles, potential credit issues, and overall rankings. Please see BDC Risk Profiles for additional details.
ORCC and GSBD dividend coverage projections (base, best, worst-case scenarios). Please see BDC Dividend Coverage Levels for additional details.
The Big Boys Continue To Pile Into This Dividend Sector
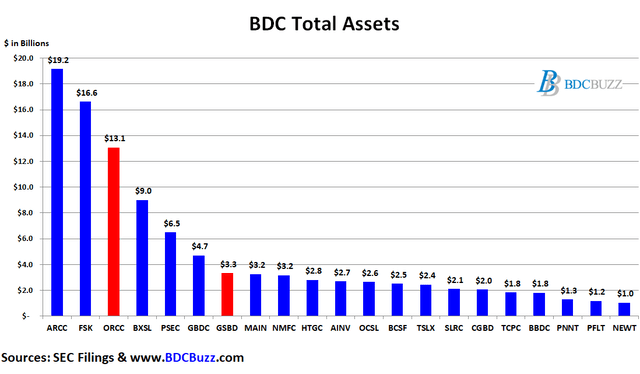
As mentioned in “The Big Boys Continue To Pile Into This Dividend Sector: ORCC” Business Development Companies (“BDCs”), like REITs almost 20 years ago, want institutional investors and the scale that comes with them. Many of the largest asset managers have been actively building assets in the sector including BlackRock, Goldman Sachs Group, Franklin Templeton, The Blackstone Group, Barings, Apollo, The Carlyle Group, Ares Management, KKR & Co. Inc., Oaktree Capital Management, TPG Capital, Bain Capital, and Blue Owl. However, Ares and Apollo have managed Ares Capital (ARCC) and Apollo Investment (AINV) for quite a while as compared to others. This article discusses Goldman Sachs BDC (GSBD)and Owl Rock Capital (ORCC). There are now 20 publicly traded BDCs with more than $1 billion in assets and I have discussed many of them over the last few months (see list below) and will try to cover the others in upcoming articles.
These 13 asset management companies combined manage more than $16.5 trillion in assets (up from $11 trillion in early 2020), and there will likely be continued positive changes to regulations over the coming quarters driving up multiples for current investors. Please keep in mind that higher multiples mean higher prices (and lower yields) as the BDC sector continues to attract more attention and respect from the investment community especially given how they performed during the pandemic. Most BDCs seem to be in a virtuous circle of improving asset quality supporting a lower cost of capital driving improved earning, NAV, and dividend increases. Many have recently issued very low rate unsecured notes and refinanced their balance sheets including Owl Rock Capital (ORCC) and Goldman Sachs BDC (GSBD) as discussed in this article.
Portfolio Mix and Credit Quality
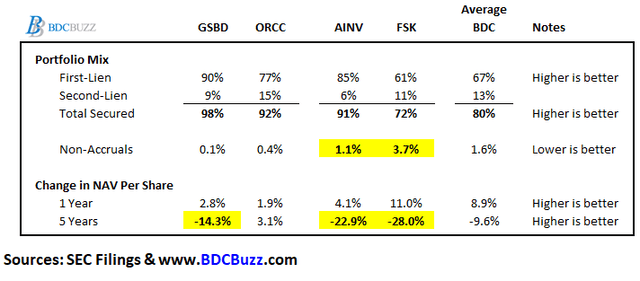
The following tables show a handful of some of the metrics used to compare BDCs but please keep in mind that this information is oversimplified and needs discussion. For example, not all “first-lien” is the same credit quality. I would feel much safer with second-lien in a higher quality BDC than first-lien in a lower quality one. Plenty of the BDCs that were the worst performers had plenty of first-lien only to have huge declines in book values or net asset values (“NAV”) the following quarters. Medley Capital (MCC) and Fifth Street Capital (FSC) were perfect examples of this.
Also, please note that BDCs such as GSBD, ORCC, and AINV have mostly secured debt positions as compared to equity participation which has been primarily responsible for most of the NAV growth for other BDCs. That is why the average BDC has experienced ANV growth of around 9% over the last four quarters but they also have lower amounts of secured positions. For some examples of BDCs that have been benefitting from equity positions please see the following articles from September 2021:
It is important to point out that BDCs that have been marking up equity positions would likely experience larger NAV declines during a serious market downturn or economic event. Please be careful.
Also, non-accruals are investments that a BDC is currently not accruing income due to credit issues. Some BDCs will exit or restructure these investments just before the quarter-end taking a realized loss but avoiding being listed as a credit issue when it comes to reporting. It’s better to look at historical realized losses which clearly identify historical credit issues as discussed in some of the articles linked above including “FS KKR Capital: Dividend Decrease Coming” which discussed FSK and AINV.
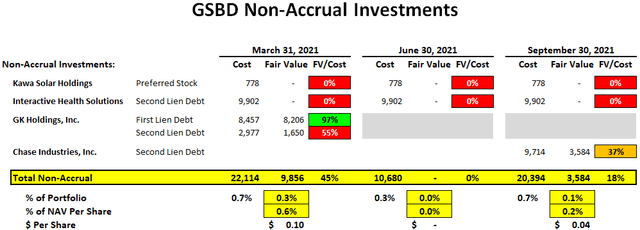
As shown in the previous table, FSK and AINV have had larger NAV declines over the last 5 years but so has GSBD mostly related to legacy investments. These investments have been discussed in previous articles and were considered idiosyncratic especially given the improved credit quality over the last two years. GSBD has 111 portfolio companies and with only 2 put on non-accrual status over the last 7 quarters.
As of September 30, 2021, GSBD’s investments on non-accrual status accounted for 0.1% and 0.7% of the total investment portfolio at fair value and cost, respectively. If its non-accrual were completely written off the impact to NAV would be around $0.04 per share or 0.2%:
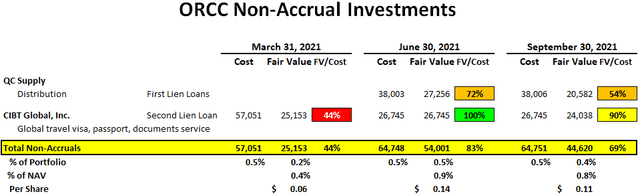
Two of ORCC’s smaller first-lien loans to QC Supply were added to non-accrual status during Q2 2021 and marked down again during Q3 2021. Also, CIBT Global, Inc. remains non-accrual and was also marked down as shown in the following table. Please keep in mind that ORCC has 130 portfolio companies so there will always be a certain amount on non-accrual which currently account for 0.4% of the total portfolio fair.
We are carefully monitoring the current headwinds caused by the labor shortages and supply chain disruptions. To date, we have not seen a material impact as many of our companies are services businesses, which have modest exposure to the manufacturing economy. For example, some of our largest sectors are software, insurance, and health care, which are not as exposed to the current economic headwinds. In line with last quarter, our nonaccruals remained low with only two investments on non-accrual status, representing 0.4% of the portfolio based on fair value. One of the lowest levels in the BDC sector and our annualized loss ratio is 14 basis points.”
Expense Ratio & Fee Agreements
As a part of assessing BDCs, it’s important to take into account expense ratios. BDCs with lower operating expenses can pay higher amounts to shareholders without investing in riskier assets.
“Operating Cost as a Percentage of Available Income” is one of the many measures that I use which takes into account operating, management, and incentive fees compared to available income. “Available Income” is total income less interest expense from borrowings and is the amount of income that is available to pay operating expenses and shareholder distributions.
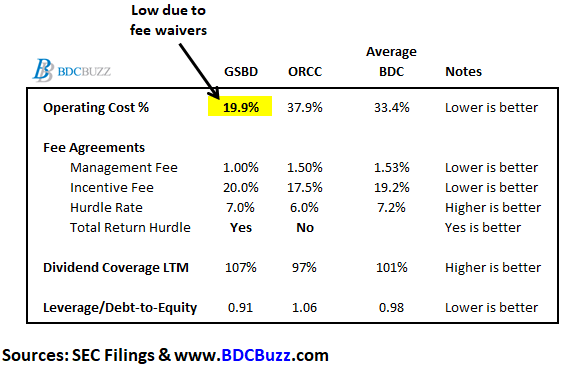
As discussed in “Conservative Portfolio Safely Paying Investors 7.3%“, many BDCs have been temporarily waiving fees or have fee agreements that take into account previous capital losses that are ending this year. GSAM is waiving a portion of its incentive fee for the four quarters of 2021 (Q1 2021 through and including Q4 2021) in an amount sufficient to ensure that GSBD’s net investment income per share is at least $0.48 per share per quarter.
However, GSBD has what I consider to be a more shareholder-friendly fee agreement with a lower-than-average base management fee of 1.00% and a total return hurdle to protect shareholders from additional credit issues. ORCC has a lower yielding portfolio which is why its hurdle rate is only 6.0% (not ideal) and lower-than-average incentive fee rate.
The ‘dividend coverage LTM’ is showing the average dividend coverage over the last 12 months (4 quarters) and is higher for GSBD due to fee waivers and lower for ORCC as the company was previously underleveraged. ORCC continues to increase leverage covering its dividend by 109% in Q3 2021 as discussed later.
GSBD Dividend Coverage Update
Author’s Note: The following information was provided to subscribers along with three quarters of financial projections using base, best, and worst-case assumptions to test the sustainability of the current dividends for GSBD.
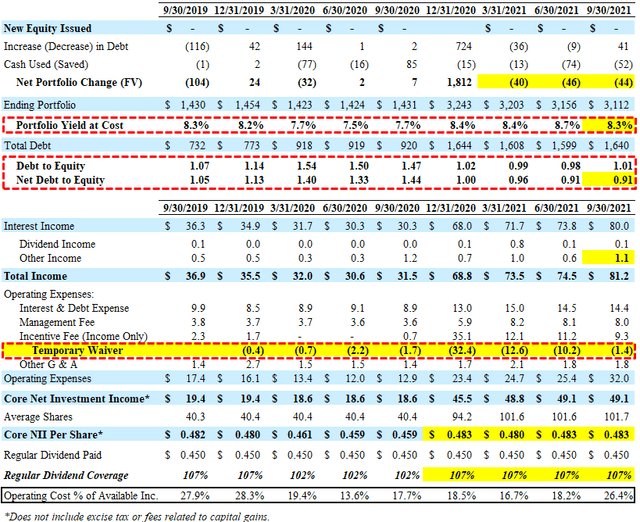
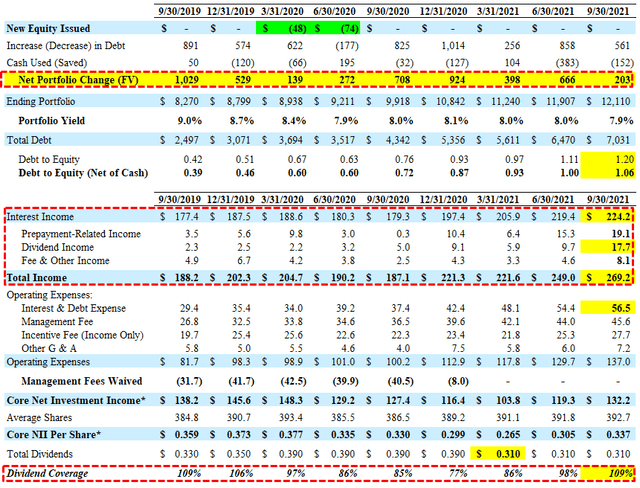
For Q3 2021, GSBD reported slightly below its best-case projections mostly due to an increase in accelerated accretion related to repayments and higher fee income partially offset by lower portfolio yield and lower portfolio growth (decline). Leverage (debt-to-equity) remains at its near-term low of 0.91 (net of cash) giving the company adequate growth capital for increased earnings potential. It should be noted that fee waivers continued to decline and were only $1.4 million.
I am expecting improved dividend coverage for GSBD over the coming quarters mostly due to:
Portfolio growth due to lower prepayments
Reinvesting the proceeds from Hunter Defense Technologies
Continued lower cost of borrowings
Higher portfolio yield from rotating into higher yield assets
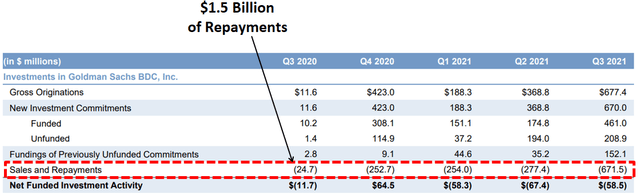
It is important to point out the GSBD remains below its targeted leverage due to $1.5 billion of repayments over the last 4 to 5 quarters which is meaningful given that its total portfolio is only $3.1 billion. However, management is not expecting the same level of repayments:
Elevated repayments continued unabated this quarter. At $672 million repayments equaled 21% of the fair value of investments at the beginning of the quarter and were 2.4 times greater than last quarter which itself was the previous high water mark repayments in the company’s nearly 10-year history. Repayments were diversified across the book with the single large repayment only amounted to less than 10% of the total. This is a somewhat remarkable level of portfolio turnover in a single quarter, there are a few takeaways I would offer for this unusual activity. First, I believe this repayment activity is a reflection of our focus on sectors and companies that continue to grow, perform well, and are therefore increasingly in investor favor. In an environment where M&A activity is high and equity evaluations are rising, it’s not surprising that high quality companies are either being sold or graduating to a lower cost of capital.”
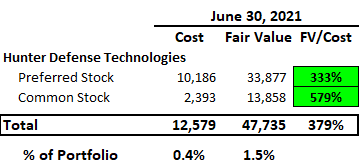
One of the repayments from Q3 2021 was Hunter Defense Technologies which accounted for almost $48 million or 1.5% of the portfolio driving a realized gain of almost $36 million or $0.35 per share. This was a non-income producing equity investment that will be reinvested into debt investments yielding at least 8% which is an additional ~$3.8 million of annual income.
During the quarter, we exited our equity position in Hunter Defense Technologies. Hunter Defense is a provider of shelters and ancillary products used primarily by the U.S. military in mobile troop deployments. The sale of the position generated a realized gain of $36 million. Hunter Defense was a previously non-income producing asset that’s been able to be monetized, recycled back into income producing assets.”
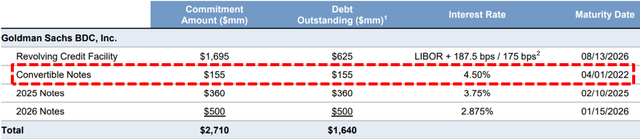
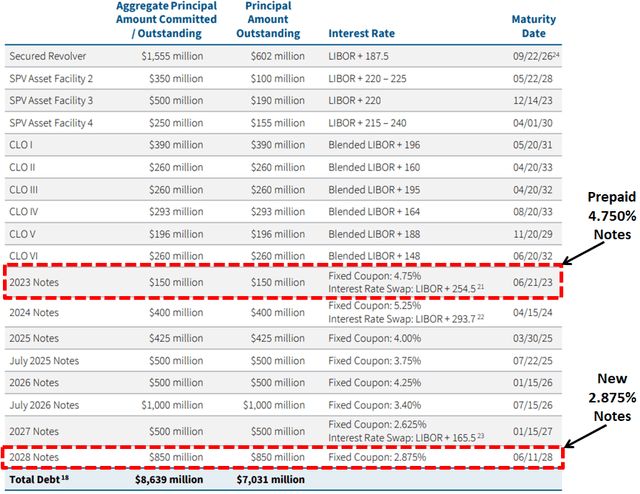
Similar to most BDCs, GSBD has been lowering its borrowing rates as well as constructing a flexible balance sheet including a public offering of $500 million of 2.875%unsecured notes due 2026. In August 2021, the company reduced the interest rate on its credit facility from LIBOR plus 2.00% to LIBOR plus 1.875%/1.75% which will be used to refinance its $155 million of 4.50% convertible notes on April 1, 2022. This will have a meaningful impact on earnings starting in Q2 2022:
There’s also tremendous tailwinds on the liability side of the balance sheet for the company here as well. I’m sure many of the investors in this space are following what’s going on in the financial markets for these assets. There’s typically generally a high correlation between if there’s pressure on asset yields, there’s also an opportunity on the liability side. For example, we’ve got our convertible bond which has a 4.5% coupon coming due early next year, that will be recycled. Our current plan would be to refinance that with our existing capacity under our revolving credit facility, which of course comes with a much lower cost of capital. I think there’ll be ongoing opportunities over the course of next year to do that, as well. So I think those are just a few things that I point to that that give us some optimism that there’s still really good opportunities to perform here.”
ORCC Dividend Coverage Update
Author’s Note: The following information was provided to subscribers along with three quarters of financial projections using base, best, and worst-case assumptions to test the sustainability of the current dividends for ORCC.
For Q3 2021, ORCC beat its best-case projected earnings due to higher-than-expected prepayment-related, dividend, and fee income as well as higher portfolio growth growing total income to the highest level of $269 million.
ORCC was not expected to cover its quarterly dividend but Core NII of $0.337 (excluding excise tax) covered 109% of its dividend of $0.310.
I am expecting improved dividend coverage for ORCC over the coming quarters mostly due to:
Increased dividend income from its Senior Loan Fund and Wingspire
Maintaining target leverage with new investments offsetting repayments
Additional prepayment fees and accelerated OID
Higher portfolio yield from rotating into higher yield assets
Continued lower cost of borrowings
ORCC continues to increase leverage and is now near the midpoint of its target debt-to-ratio between 0.90 and 1.25 (currently 1.06 excluding $780 million of available cash) giving the company plenty of growth capital.
We experienced a record level of originations this quarter which resulted in a fully ramped $12 billion-plus portfolio. We also had a record level of repayments. Prior to this quarter we had not yet seen the pace of repayments expected for a portfolio of our size but this trend finally materialized in the third quarter. We had more than $2 billion of repayments, which generated healthy fee and amortization income. At the same time, we’re able to seamlessly replace those repaid investments with equally attractive new investments of a similar credit quality and comparable economics, which has allowed us to finish the quarter in an equally strong position and with leverage comfortably in our target range. While this quarter may prove to be on the higher end, we do expect repayments to continue to exceed the levels we have seen in the last couple of years.”
Management is expecting another strong quarter partially due to higher prepayment-related income which has been taken into account with the updated financial projections and was discussed on the recent earnings call:
We had a significant amount of repayments this quarter, which drove a material increase in earnings from accelerated accretion and prepayment fees. While this is not a contractual earnings stream, we do expect repayment-related income to broadly stay around these levels in future quarters, as we expect that our repayments will remain at a more normalized pace, recognizing that the timing of repayments is idiosyncratic in any specific quarter.”
“We expect to see a healthy level, likely lower than this quarter’s record, but higher than previous quarters. Now that the portfolio is fully ramped, we will generally be targeting originations in line with repayments in order to maintain a fully levered, fully invested portfolio, and we have a strong backlog of attractive deals expected to close this quarter.”
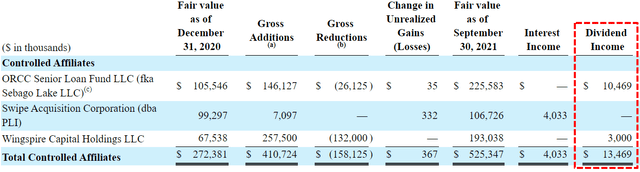
The increased dividend income was mostly related to equity investments in Windows Entities and Wingspire Capital Holdings that will likely continue over the coming quarters:
Our total investment income for the quarter, increased to $269 million, up $20 million from the prior quarter. This increase was primarily driven by dividend income, which increased by $8 million. We received our first dividend from Wingspire this quarter, as well as continued dividend income from Windows Entities and our senior loan fund. We expect dividend income from Wingspire and our senior loan fund to continue to increase as our committed capital is deployed.”
“Our investment in Wingspire, an asset-based lender to US-based middle market companies, with roughly $350 million of assets and very strong credit performance. We currently have approximately $195 million invested in Wingspire and see opportunities to invest more capital going forward. We expect Wingspire will be run rating at a high single-digit ROE by the end of this year and can generate a 10-plus percent ROE.”
Also taken into account with the updated projections is additional dividend income from its ORCC Senior Loan Fund (previously Sebago Lake LLC) which now accounts for 1.9% of the total portfolio. Management is expecting this joint venture with Nationwide Life Insurance to eventually provide quarterly dividend income of $7 million:
“The other investment is in our Senior Loan Fund. As you recall, last quarter, we increased our equity commitment in the fund to $325 million and our economic ownership to 87.5%. The fund has already generated an attractive average quarterly ROE over the past three years of approximately 10%, and we will look to increase our capital invested over time.”
From previous call: “And so we’ll just be able to increase over time the amount of money ORCC has working and grow that number, when we get all that working it’s going to take some time should be we $7 million a quarter, which is I think terrific.”
On November 23, 2021, ORCC announced the prepayment of its higher rate of 4.75% notes due 2023. In August 2021, the company issued another $400 million of its 2.875% notes due 2028. As of September 30, 2021, ORCC had around $2.4 billion of liquidity consisting of $780 million of cash and almost $1.6 billion of undrawn debt capacity (including upsizes).
Setting Target Prices
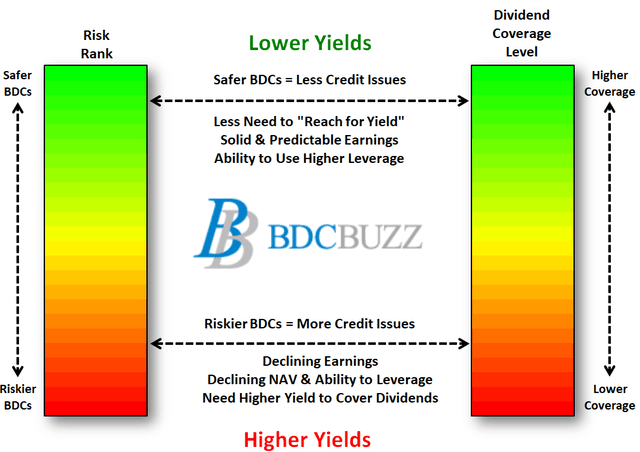
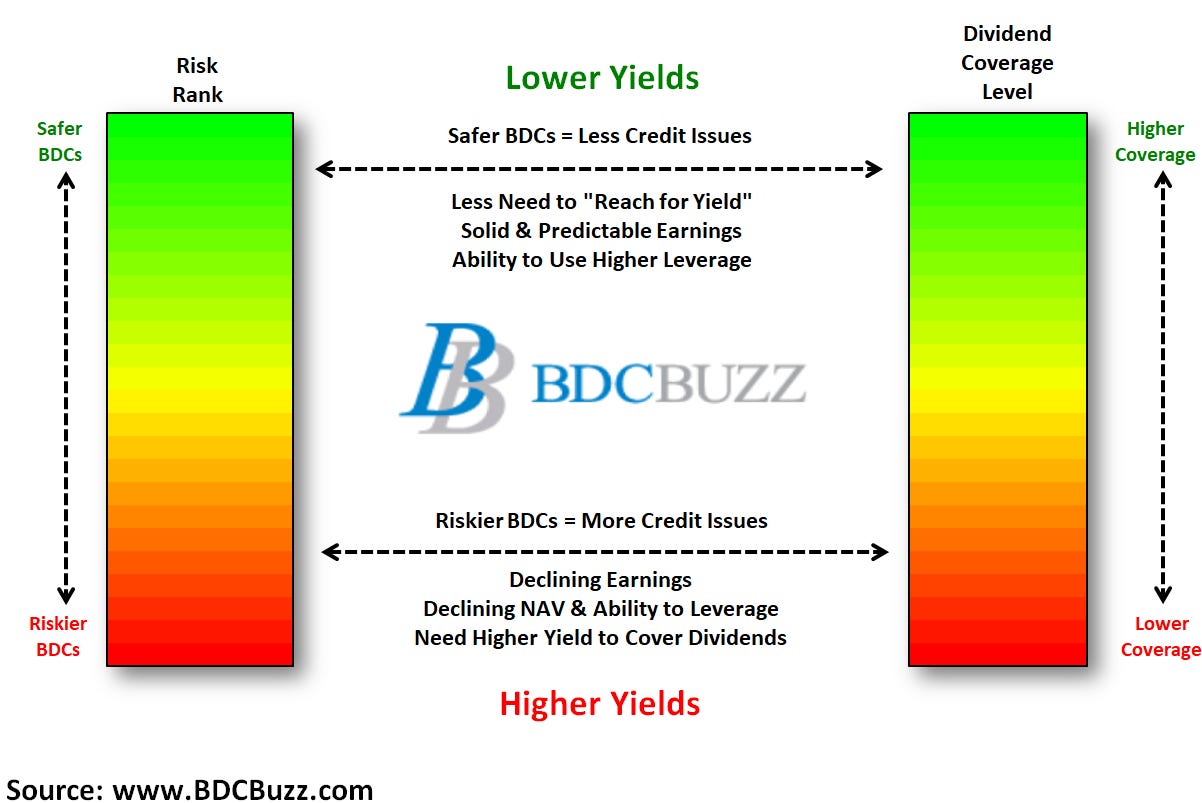
There are very specific reasons for the prices that BDCs trade driving higher and lower yields mostly related to portfolio credit quality and dividend coverage potential (not necessarily historical coverage). Also, and this is very important, the price-to-book/NAV is highly dependent on the amount of dividends that a BDC is paying as a percentage of NAV (but also taking into account risk profile and projected dividends).
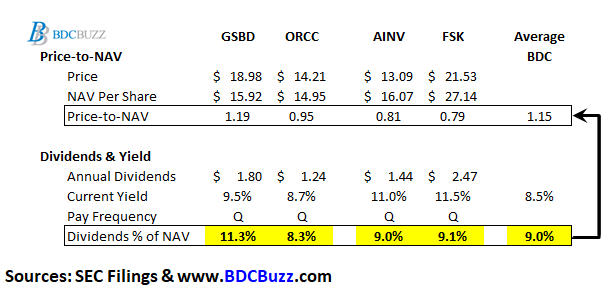
For example, GSBD is currently paying a regular quarterly dividend of $0.45 per share which is $1.80 annually and 11.3% of its current NAV per share ($1.80/$15.92). This is much higher than most BDCs which are currently averaging around 9.0% of NAV.
ORCC pays a regular quarterly dividend of $0.31 per share which is $1.24 annually and 8.3% of its current NAV per share ($1.24/$14.95).
The last table from “Dividend Increase Coming For PennantPark” shows each BDC roughly categorized into groups of paying below 7.5%, 7.5% to 9.0% (including ORCC), and over 10.0% (including GSBD). If GSBD is able to maintain its regular dividend then the current pricing should be higher driving a yield closer to the average of 9.0% and its price-to-NAV closer to the other BDCs in the top group (paying over 10.0% of NAV).
Again, BDCs with higher quality credit platforms and management typically have higher quality portfolios and investors pay higher prices. This drives higher multiples to NAV and lower yields.
BDCs with lower expenses and higher potential dividend coverage typically have stable to growing dividends and investors pay higher prices. This drives higher multiples to NAV and lower yields.
What Can I Expect Each Week With a Paid Subscription?
Each week we provide a balance between easy to digest general information to make timely trading decisions supported by the detail in the Deep Dive Projection reports (for each BDC) for subscribers that are building larger BDC portfolios.
Monday Morning Update – Before the markets open each Monday morning we provide quick updates for the sector including significant events for each BDC along with upcoming earnings, reporting, and ex-dividend dates. Also, we provide a list of the best-priced opportunities along with oversold/overbought conditions, and what to look for in the coming week.
Deep Dive Projection Reports – Detailed reports on at least two BDCs each week prioritized by focusing on ‘buying opportunities’ as well as potential issues such as changes in portfolio credit quality and/or dividend coverage (usually related). This should help subscribers put together a shopping list ready for the next general market pullback.
Friday Comparison or Baby Bond Reports – A series of updates comparing expense/return ratios, leverage, Baby Bonds, portfolio mix, with discussions of impacts to dividend coverage and risk. This week we are providing a general market update with “suggested limit orders” for each BDC due to the expected volatility.
This information was previously made available to subscribers of Premium BDC Reports. BDCs trade within a wide range of multiples driving higher and lower yields mostly related to portfolio credit quality and dividend coverage potential (not necessarily historical coverage). This means investors need to do their due diligence before buying including setting target prices using the portfolio detail shown in this article (at a minimum) as well as financial dividend coverage projections over the next three quarters as discussed earlier.