The following information was previously provided to subscribers of BDC Buzz Premium Reports along with:
- FSK target prices, buying points and suggested limit orders (used during market volatility).
- FSK risk profile, potential credit issues, changes in NAV, and overall rankings. Please see BDC Risk Profiles for additional details.
- FSK dividend coverage projections (base, best, worst-case scenarios). Please see BDC Dividend Coverage Levels for additional details.
![]()

FSK Quick Update:
- This update discusses FSK, which is considered a trading position for higher risk/return investors for the reasons discussed below, including the amount of investments considered ‘watch list’.
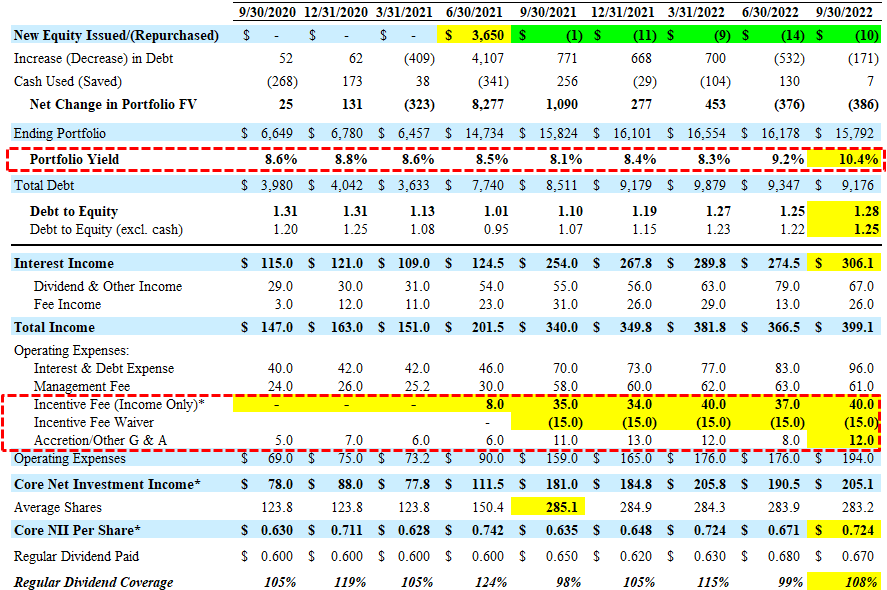
- FSK is currently one of the highest yielding BDCs at over 13%. However, dividend coverage is/was supported by temporary fee waivers in 2022.
- My primary concerns include many of its ABF, capital goods, software investments and real estate/aircraft leasing exposure likely driving higher non-accruals and NAV decline in Q4 2022.
- One of the best ways to invest in FSK is through its investment grade notes, many of which have higher-than-average yields and will be discussed in a separate update. Please see the updated “Interest Expense Coverage” and “Asset Coverage” ratios below.
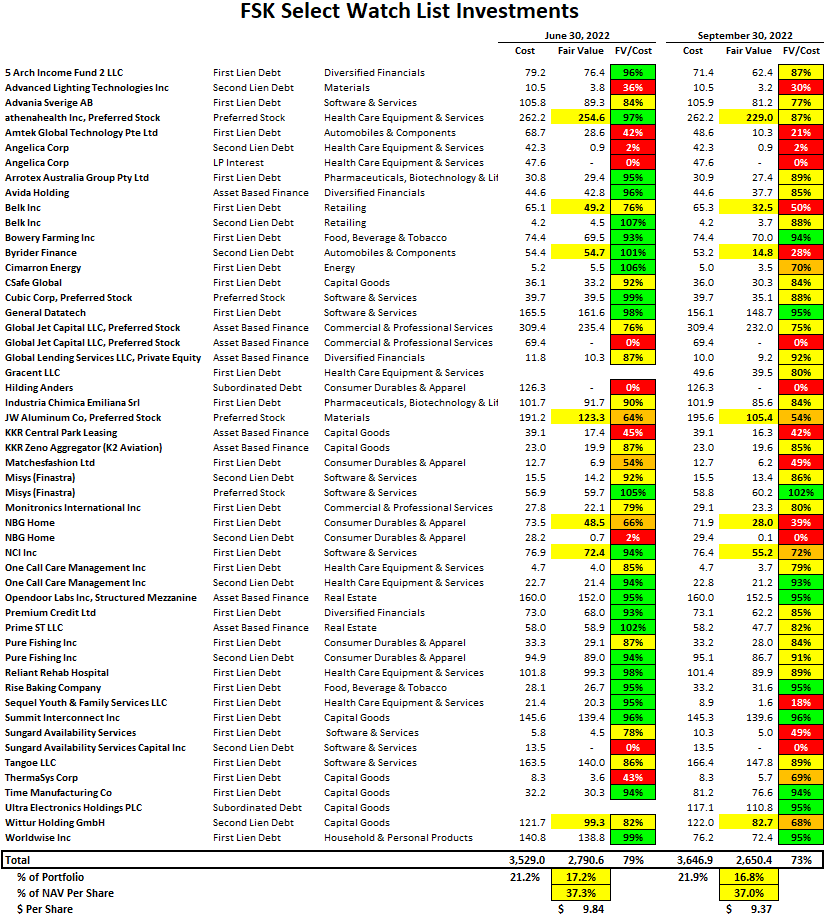
- FSK has a much higher amount of ‘watch list’ investments currently at 22% portfolio cost (17% fair value) and accounts for 37% of NAV per share.
FSK Risk Profile Quick Update
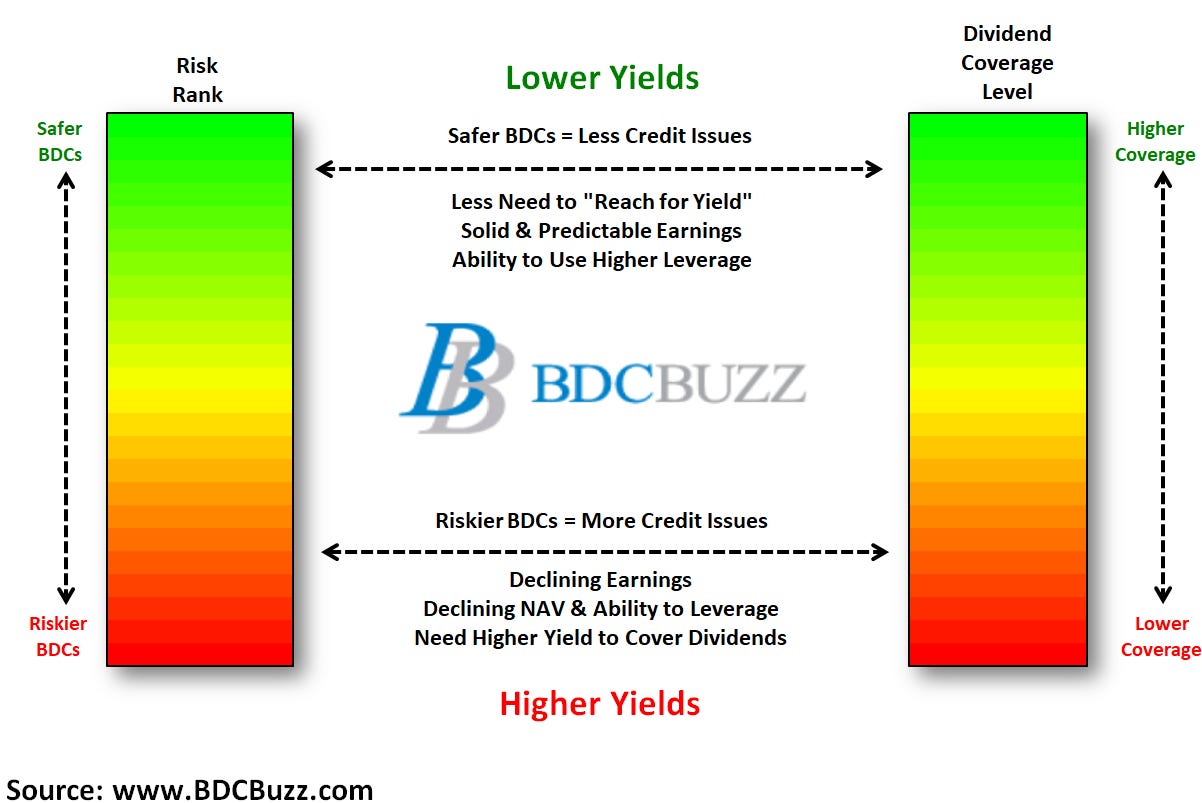
This report discusses FS KKR Capital (FSK) that remains a ‘Tier 4’ and a component in the ‘High-Yield’ portfolio due to:
- Potential for relatively higher non-accruals in a recessionary environment
- Previous realized losses and NAV declines driven by higher cyclical exposure
- Higher amounts of non-cash payment-in-kind (“PIK”) income
- Dividend coverage that is supported by temporary fee waivers ($0.053 per quarter)
As discussed later, my primary concerns include many of its asset based finance (“ABF”), capital goods, and software investments as well as real estate and aircraft leasing exposure. Also, management previously removed the ‘total return’ hurdle or ‘look back’ provision that was partially protecting shareholders from additional capital losses.
As mentioned in previous reports, its preferred stock and mezzanine positions in Global Jet and JW Aluminum need to be watched as these are larger PIK investments that are only accruing a portion and marked below cost. During Q2 2022, there was a meaningful increase in the amount of non-accrual investments that remain around 5% of the portfolio cost but declined from 2.9% to 2.5% of the portfolio fair value due to marking down 5 Arch Income, Global Jet, Sequel Youth, and Sungard, as well as removing Amtek and Petroplex. However, three new investments that were previously considered ‘watch list’ were added to non-accrual status (Byrider Finance, Belk Inc., and NBG Home) as shown below.
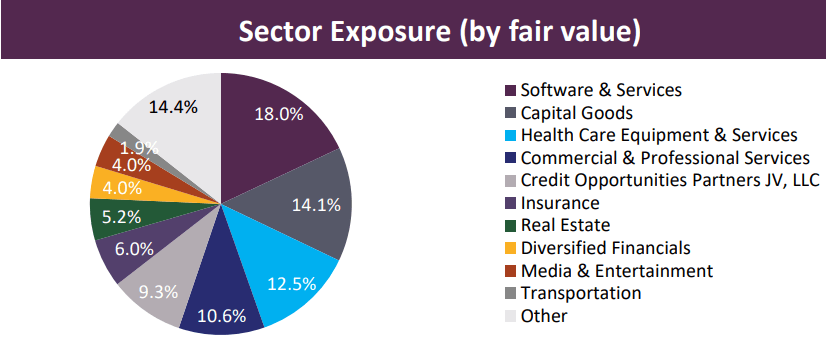
“While assessing our sector exposure today, we take comfort in the fact that we have focused on more defensive industries over the past several years as our top industry exposures today include software services, health care services and insurance services businesses, which represent approximately 37% of our portfolio. This compares to more cyclical and volatile sectors such as materials, capital goods and energy, which represented approximately 34% of the total portfolio at the end of the second quarter of 2018 and today represent only 17% of our portfolio. “The largest negative movers in our portfolio, which are impacted by credit-related issues during the quarter were by Byrider Finance and NBG Home. I would also point out that these names both were placed on nonaccrual during the third quarter, which means they are already factored into our third quarter reported earnings.”
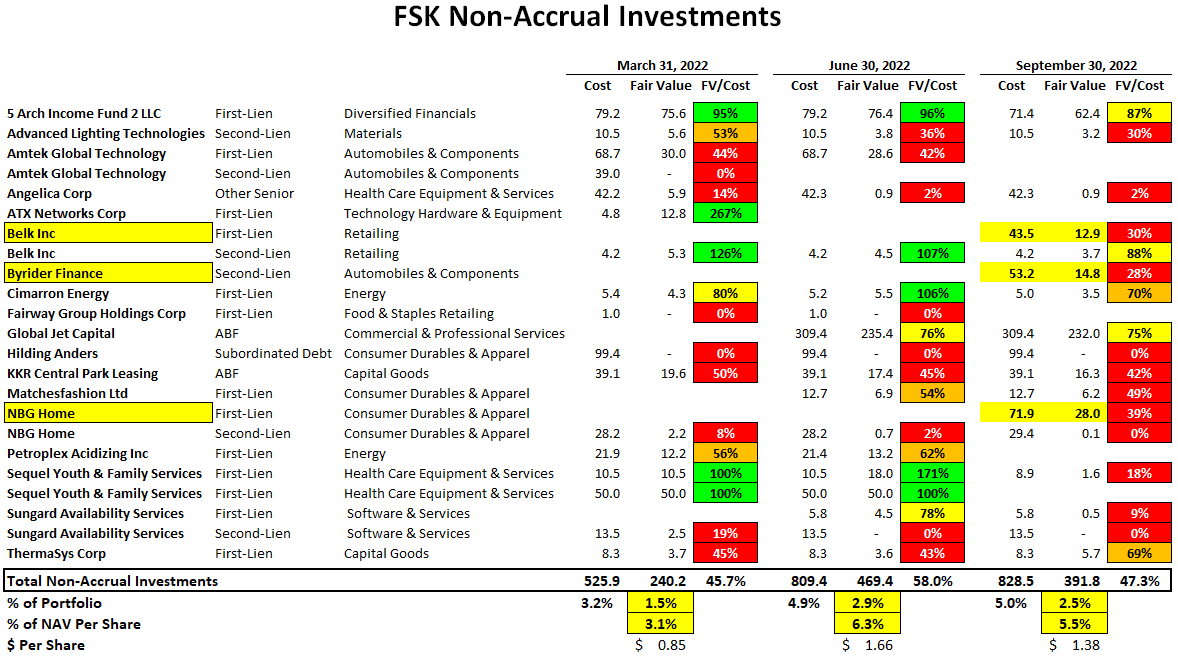
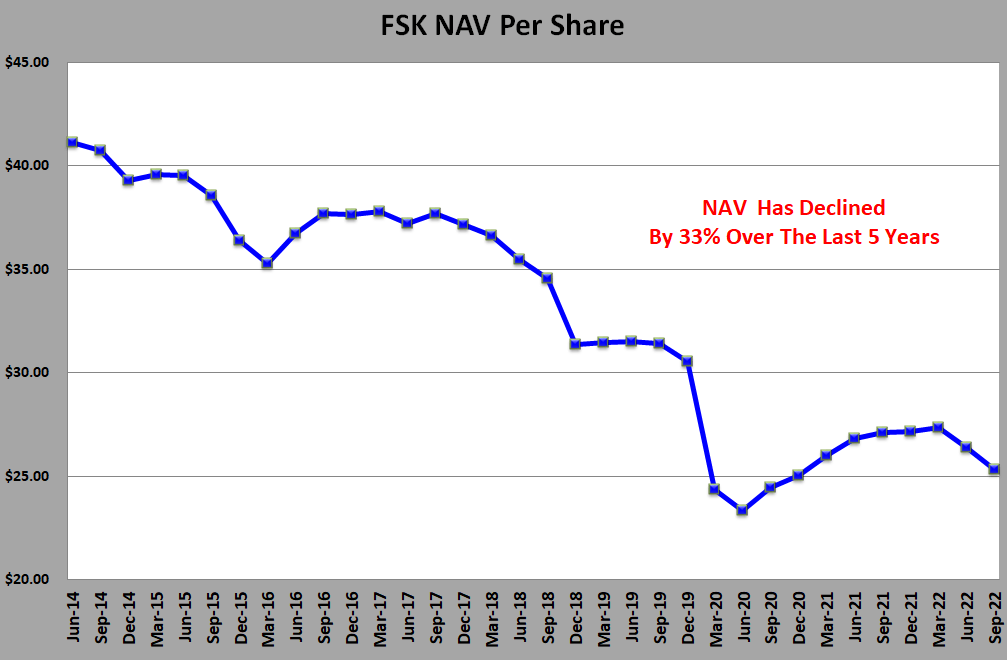
During Q3 2022, its NAV per share declined by 4.2% (from $26.41 to $25.30) mostly due to marking down many of its ‘watch list’ investments, including Byrider Finance, athenahealth Inc, Belk Inc., NCI Inc., JW Aluminum, and NBG Home as shown in the following table.
“Certain companies in our portfolio have been meaningfully impacted by a combination of inflation, supply chain issues and the increasing interest rate environment, which contributed to a portion of our portfolio depreciation during the quarter.”
Even after taking into account the additional markdowns, the amount of ‘watch list’ investments remains almost 17% of the portfolio and around 37% of NAV, which is much more than most BDCs. Some of my primary concerns include many of its asset based finance (“ABF”), capital goods, and software investments as well as real estate and aircraft leasing exposure (similar to previous declines from Global Jet). FSK is likely investing in the riskiest portions of its ABF positions, including Opendoor (OPEN) which continues to face challenges in the residential real-estate market. Also, S&P downgraded Misys (Finastra) to CCC+, citing an “unsustainable capital structure” and could be added to non-accrual.
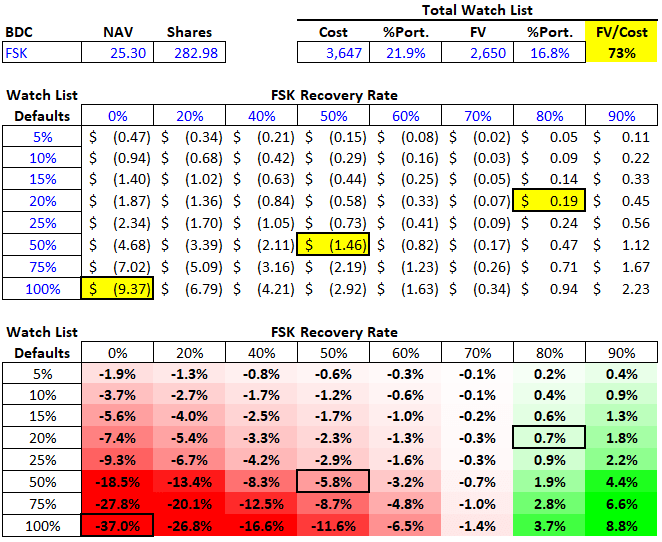
The following table shows the potential impact on FSK’s NAV per share with various default rates only for its watch list investments, along with a range of potential recovery rates.
For example:
- If 100% of the investments defaulted with 0% recovery, the negative impact to NAV per share would be around $9.37 or 37.0%. This is the worst-caseworst-case scenario for this watch list.
- If 50% of the investments defaulted with 50% recovery, the negative impact to NAV per share would be around $1.46 or 5.8%.
- If 20% of the investments defaulted with 80% recovery, the positive impact to NAV per share would be around $0.19 or 0.7%.
It is important to understand that FSK’s watch list is currently marked at an average of 73% of cost and any changes to other investments will also have an impact (positive or negative). FSK will likely earn around $0.70 to $0.80 per share for Q4 2022 compared to its regular dividend of $0.61 per share, plus a supplemental dividend of $0.07 per share for a total of $0.68 per share. Q4 2022 earnings take into account the final fee waiver, which contributed around $0.053 per share per quarter for 2022.
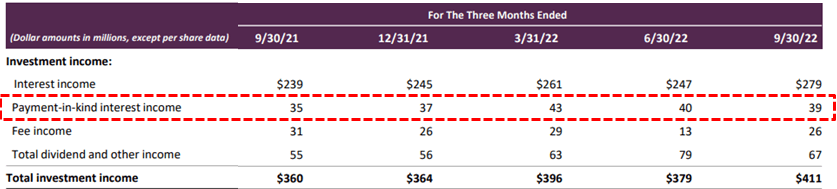
There are many factors to take into account when assessing dividend coverage for BDCs including portfolio credit quality, realized losses, fee structures including ‘total return hurdles’ taking into account capital losses, changes to portfolio yields, borrowing rates, the amount of non-recurring and non-cash income including payment-in-kind (“PIK”). Most BDCs have around 2% to 8% PIK income and I pay close attention once it is over ~5% of interest income. Higher amounts of PIK is typically a sign that portfolio companies are not able to pay interest expense in cash and could imply potential credit issues over the coming quarters. The amount of PIK interest income remains around 13% of total interest income.
Management is actively working to improve portfolio credit quality and dividend coverage through rotating out of legacy investments (including non-income producing), the previous ramping of its Credit Opportunities Partners joint venture, and increased leverage. The best case projections take all of this into account, potentially driving increased dividends to shareholders.
As shown below, I am expecting additional supplemental dividends over the coming quarters. I will continue to adjust pricing as needed based on the updated results, including portfolio credit quality and dividend coverage potential.
FSK Quick Quarterly Update (September 30, 2022)
- Earnings: Reported just below its base case projections mostly due to a decline in the size of the overall portfolio, higher operating expenses, and continued non-accruals mostly offset by higher-than-expected portfolio yield with NII of $0.724 per share. Please note that the company is temporarily waiving fees through 2022, which contributes around $0.053 per share per quarter. PIK interest income remains around 13% of total interest income.
- Dividends: Maintained its base dividend of $0.61 per share plus a supplemental dividend of $0.07 per share for a total of $0.68 per share for Q4 2022, which was just above the previous base case projections.
- Credit Quality: Three new investments that were previously considered ‘watch list’ were added to non-accrual status (Byrider Finance, Belk Inc., and NBG Home). Total non-accruals decreased to 2.5% to 5.0% of the total investment portfolio at fair value and cost, respectively (previously 2.9% and 4.9%) due to marking down 5 Arch Income, Global Jet, Sequel Youth, and Sungard, as well as removing Amtek and Petroplex.
- NAV Per Share: Decreased by 4.2% (from $26.41 to $25.30) mostly due to marking down many of its ‘watch list’ investments, including Byrider Finance, athenahealth Inc, Belk Inc., JW Aluminum, and NBG Home as shown earlier.
What Can I Expect Each Week With a Paid Subscription?
Each week we provide a balance between easy to digest general information to make timely trading decisions supported by the detail in the Deep Dive Projection reports (for each BDC) for subscribers that are building larger BDC portfolios.
- Monday Morning Update – Before the markets open each Monday morning, we provide we provide quick updates for the sector, including significant events for each BDC along with upcoming earnings, reporting, and ex-dividend dates. Also, we provide a list of the best-priced opportunities along with oversold/overbought conditions, and what to look for in the coming week.
- Deep Dive Projection Reports – Detailed reports on individual BDCs each week prioritized by focusing on buying opportunities and potential issues such as changes in portfolio credit quality and/or dividend coverage (usually related). This should help subscribers put together a shopping list ready for the next general market pullback.
- Weekly General Updates or Comparison Reports – A series of updates discussing ‘Building a BDC Portfolio’, suggested pricing and limit orders, expense/return ratios, interest rates, leverage, BDC Investment Grade Notes/Baby Bonds, portfolio mix, and potential impacts on dividend coverage and risk.
![]()
This information was previously made available to subscribers of BDC Buzz Premium Reports. BDCs trade within a wide range of multiples driving higher and lower yields mostly related to portfolio credit quality and dividend coverage potential (not necessarily historical coverage). This means investors need to do their due diligence before buying, including setting target prices using the portfolio detail shown in this article (at a minimum) as well as financial dividend coverage projections over the next three quarters, as discussed earlier.