The following information was previously provided to subscribers of BDC Buzz Premium Reports along with:
- ARCC target prices, buying points and suggested limit orders (used during market volatility).
- ARCC risk profile, potential credit issues, changes in NAV, and overall rankings. Please see BDC Risk Profiles for additional details.
- ARCC dividend coverage projections (base, best, worst-case scenarios). Please see BDC Dividend Coverage Levels for additional details.
ARCC Quick Update:
- ARCC recently announced a perfectly timed equity offering which is relatively small, which will be used for its only 2023 unsecured note maturity on February 10.
- More importantly, ARCC provided preliminary results for Q4 earnings and NAV as well as portfolio activity during the quarter which have been taken into account with the updated projections.
- Basically ARCC had an active quarter likely generating fee income driving higher earnings with reduced leverage but slightly reduced NAV.
- As we enter an environment of increased recessionary concerns, these reports will continue to focus on risk profiles, including any changes to ‘watch list’ investments and the potential impact on NAV using various default and recovery rates as we have done for ARCC
Ares Capital (ARCC) announced an equity offering of 9.0 million shares and then upsized the offering to 10.5 million shares (plus underwriters’ option to purchase up to an additional 1.575 million shares). ARCC had around 518 million shares outstanding as of December 31, 2022, taking into account the equity offering in November 2022 and ATM share issuances.
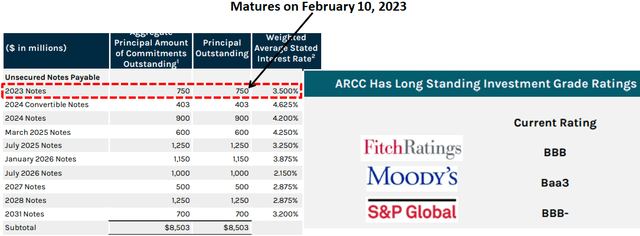
ARCC has an upcoming maturity of its $750 million of unsecured notes due on February 10, 2023, compared to around ~$225 million of net offering proceeds from the recently announced equity offering. It is important to point out that this is the only unsecured note maturity in 2023.
Also, the company provided the following preliminary estimates for Q4 2022, which have been taken into account with the updated projections:
- Core EPS between $0.61 and $0.63 per share (compared to analyst estimates of $0.54)
- NAV per share between $18.35 and $18.43 (1% decline, to previously $18.56)
- Net realized gains of $0.05 per share
- $2.2 billion of new commitments funded with an average yield of 11.0% (at cost)
- $2.3 billion of exited/repaid investments with an average yield of 9.4% (at cost)
Core EPS is a non-GAAP financial measure. Core EPS is the net increase (decrease) in stockholders’ equity resulting from operations less net realized and unrealized gains and losses, any capital gains incentive fees attributable to such net realized and unrealized gains and losses and any income taxes related to such net realized gains and losses.
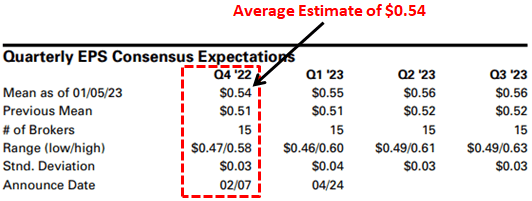
As shown below, the consensus earnings estimates previously ranged between $0.47 and $0.58 per share with an average of $0.54 per share compared to like $0.62 per share:
ARCC Risk Profile Quick Update
During Q3 2022, its net asset value (“NAV”) per share declined by 1.3% mostly due to a widening of credit spreads and markdowns for TibCo Software, SHO Holding, Eckler Industries, Potomac, and AthenaHealth Group, partially offset by overearning the dividend.
“Our NAV per share declined modestly by 1% as we took net unrealized losses, largely due to the declining prices in the credit and equity markets. Despite this, the fundamental performance of the portfolio remains solid, even as a more difficult economic backdrop appears inevitable.”
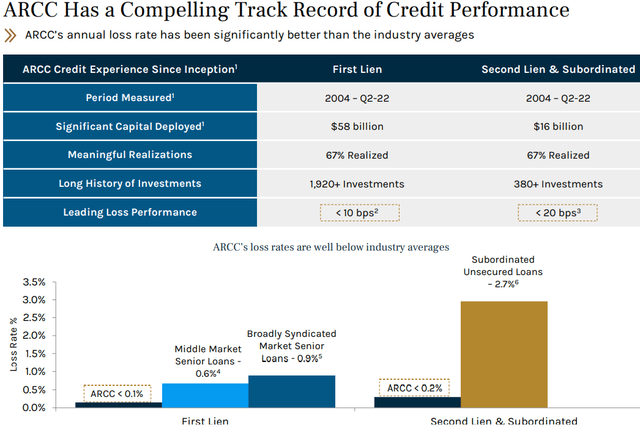
ARCC’s NAV per share has increased from $14.43 in Q4 2004 to the current $18.56 even after taking into account the financial crisis of 2008 and the recent COVID crisis.
“Two measures of portfolio credit quality, our nonaccrual rate at cost and the weighted average portfolio grade both remained static quarter-over-quarter and show stronger metrics than our historical averages. The stability in these credit metrics is supported by a healthy level of weighted average EBITDA growth of 13% year-over-year. By historically focusing our efforts on upper middle market companies with high free cash flows that operate in more resilient, less cyclical industries, we believe we’ve been able to reduce some of the credit risks that come from operating in a more difficult environment with higher market interest rates. While we are closely monitoring these risks, we believe they are manageable.”
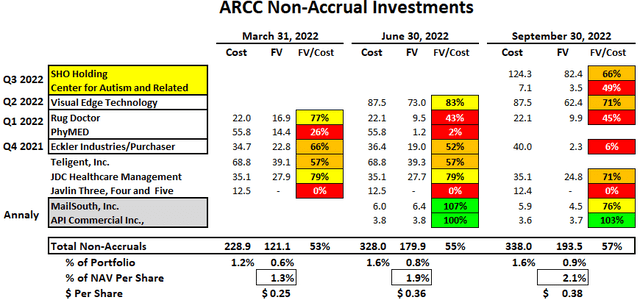
Non-accrual investments increased slightly to 0.9% of the total portfolio fair value due to adding SHO Holding (known as Shoes for Crews, manufacturer and distributor of slip-resistant footwear) and Center for Autism and Related Disorders (also held in the SDLP, autism treatment and services provider specializing in applied behavior analysis therapy) partially offset by exiting Teligent Inc. ($31 million loss) and PhyMED ($55 million loss). Please note that ARCC had offsetting realized gains $66 million during Q3 2022 from exiting Primrose Holding, IRI Holdings, and Bearcat Buyer, Inc.
As discussed in the previous report, Teligent Inc. (pharmaceutical company that develops, manufactures and markets injectable pharmaceutical products) officially went out of business as its plan of liquidation became effective on July 26, 2022. PhyMED was marked at 2% of cost likely driving around $0.11 per share of realized losses but no additional impact to NAV per share during Q3 2022.
Visual Edge Technology was added to non-accrual during Q2 2022 and is a provider of outsourced office solutions with a focus on printer and copier equipment and other parts and supplies. Also, MailSouth, Inc. and API Commercial are smaller non-accrual investments from the direct lending portfolio of Annaly Capital acquired during Q2 2022. RugDoctor (manufacturer/marketer of carpet cleaning machines) was added during Q1 2022 and is a legacy investment from the ACAS acquisitions. As mentioned in previous reports, Eckler Industries was considered a ‘watch list’ investment and was added to non-accrual status in Q4 2021 and remains on non-accrual. Please note that ARCC has a very large portfolio with 458 portfolio companies valued at over $21 billion, so there will always be a certain amount of non-accruals.
“Augmenting the strong credit profile of our portfolio companies is our approach to portfolio diversification. Our $21.3 billion portfolio at fair value is diversified across 458 portfolio companies. This means that any single investment accounts for just 0.2% of the portfolio on average. And our largest investment in any single company, excluding SDLP and Ivy Hill, is just 1.4% of the portfolio.”
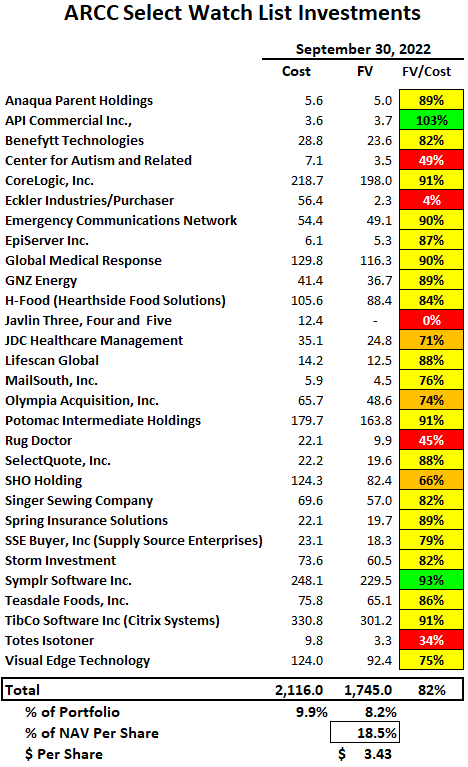
The following table shows many of ARCC’s ‘watch list’ investments which remains around 8% of the portfolio fair value (10% of cost) that are likely many of the higher-risk Grade 1 and Grade 2 credit rated investments mentioned later. Many of these investments are included in the previous table showing non-accrual investments. It should be noted that most of the watch list investments, which are not on non-accrual, remain marked over 80% of cost. See later for discussions of some of the larger watch list investments.
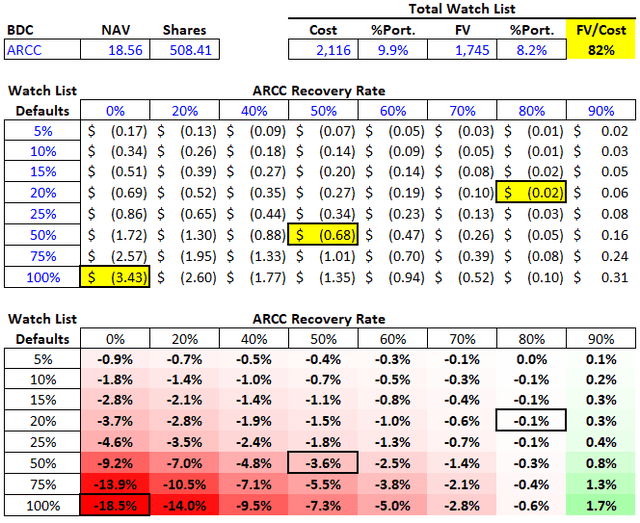
The following table shows the potential impact on ARCC’s NAV per share using a range of default rates only for its watch list and non-accrual investments, but also considering a range of potential recovery rates.
For example:
- If 100% of these investments defaulted with 0% recovery, the negative impact to NAV per share would be around $3.43 or 18.5%. This is the worst-case scenario for this group of investments.
- If 50% of these investments defaulted with 50% recovery, the negative impact to NAV per share would be around $0.68 or 3.6%.
- If 20% of these investments defaulted with 80% recovery, the slightly negative impact to NAV per share would be around $0.02 or 0.1%.
It is important to understand that ARCC’s watch list (includes its non-accruals) is currently marked at an average of 82% of cost and any changes to other investments will also have an impact (positive or negative).
H-Food Holdings(Hearthside Food Solutions) is an investment also held by ORCC and was previously downgraded by Moody’s partially due to supply chain and inflationary issues but affirmed its credit ratings:
“The outlook revision to negative from stable reflects Moody’s expectation that Hearthside’s operating performance will remain weak and free cash flow will remain negative in the next 12 months as the company faces inflationary headwinds, labor issues, and supply chain challenges. An inability to execute an operational turnaround and reduce leverage will make it challenging to refinance approaching maturities (revolver in November 2024 and first lien term loan in May 2025) and would increase default risk. Moody’s nonetheless affirmed the ratings because the company should be able to reduce Moody’s adjusted debt-EBITDA leverage to below 8x within the next 12 to 18 months through EBITDA growth in 2023, as recently implemented price increase help to offset inflationary headwinds. In addition, employee wage increases have helped to improve the fill rates at its plants and should eventually reduce employee turnover. Hearthside’s supply chain issues could persist in the next 6 to 12 months. However, Moody’s believes the company should be able to restore EBITDA growth in 2023 due to implemented price increases that will help offsett inflationary headwinds despite continued supply chain challenges.”
Global Medical Response (“GMR”) is an emergency air medical services provider that could be impacted by the “No Surprises Act”. The previous table shows the total value of its first and second lien, as well as equity positions currently marked at 90% of cost. However, its second-lien position is $95.4 million and currently valued at $83 million or 87% of cost.
No Surprises Act: “Starting on January 1, 2022, you generally won’t be responsible for balance bills or out-of-network cost-sharing when getting emergency care, non-emergency care from out-of-network providers at certain in-network facilities, or air ambulance services from out-of-network providers. When this happens, instead of you paying for unexpected out-of-network costs, you’ll generally only need to pay your normal in-network costs.”
SelectQuote, Inc.(SLQT) is a publicly traded online insurance platform (that is also held by BXSL) was marked lower again in Q3 2022. Its credit agreement was recently amended to tighten covenants (a good thing for creditors):
“amend the Company’s existing financial covenant to better align with its business plan and add an additional minimum liquidity covenant, terminate certain delayed draw term loan commitments and reduce the revolving line under the Credit Agreement form $135 million to $100 million, introduce a minimum asset coverage ratio for any borrowing of revolving loans that would result in a total revolving exposure of more than $50 million and provide certain lenders with the right to appoint a representative to observe meetings of the Company’s board of directors.”
CoreLogic, Inc. provides analytics, software and other outsourced services primarily to the mortgage, real estate and insurance sectors and is one of ARCC’s larger investments that need to be watched especially given the recent markdowns of its second lien and equity positions.
SSE Buyer (Supply Source Enterprises) is a manufacturer and distributor of personal protection equipment, commercial cleaning, maintenance, and safety products that recently announced layoffs starting last month:
“Supply Source Enterprises, has submitted a WARN with the Ohio Office of Workforce Development. The letter explains that the company will carry out a reduction in force at its Toledo distribution center at 2840 Centennial Road in Toledo. The first separations are expected to occur within the 14-day period beginning on December 26, 2022.”
Tibco Software (Citrix Systems) is a new investment in a provider of server, application and desktop virtualization, networking, and cloud computing technologies which was added to the list in Q3 2022 and includes its first and second lien, as well as equity positions.
“In a deal closed in August, Citrix Systems was acquired in a deal led by Vista Equity Partners. To finance the deal, the newly emerging combination of TIBCO software and Citrix launched offerings in the high-yield and leverage loan markets for a combined $8.5 billion. Ultimately, the offerings were heavily discounted to yield 10%. On the transaction Wall Street reportedly lost $700 million. In the same quarter as the Citrix note losses, quarterly institutional issuance in the leverage loan market fell to its lowest level since late 2009.”
What Can I Expect Each Week With a Paid Subscription?
Each week we provide a balance between easy to digest general information to make timely trading decisions supported by the detail in the Deep Dive Projection reports (for each BDC) for subscribers that are building larger BDC portfolios.
- Monday Morning Update – Before the markets open each Monday morning, we provide we provide quick updates for the sector, including significant events for each BDC along with upcoming earnings, reporting, and ex-dividend dates. Also, we provide a list of the best-priced opportunities along with oversold/overbought conditions, and what to look for in the coming week.
- Deep Dive Projection Reports – Detailed reports on individual BDCs each week prioritized by focusing on buying opportunities and potential issues such as changes in portfolio credit quality and/or dividend coverage (usually related). This should help subscribers put together a shopping list ready for the next general market pullback.
- Weekly General Updates or Comparison Reports – A series of updates discussing ‘Building a BDC Portfolio’, suggested pricing and limit orders, expense/return ratios, interest rates, leverage, BDC Investment Grade Notes/Baby Bonds, portfolio mix, and potential impacts on dividend coverage and risk.
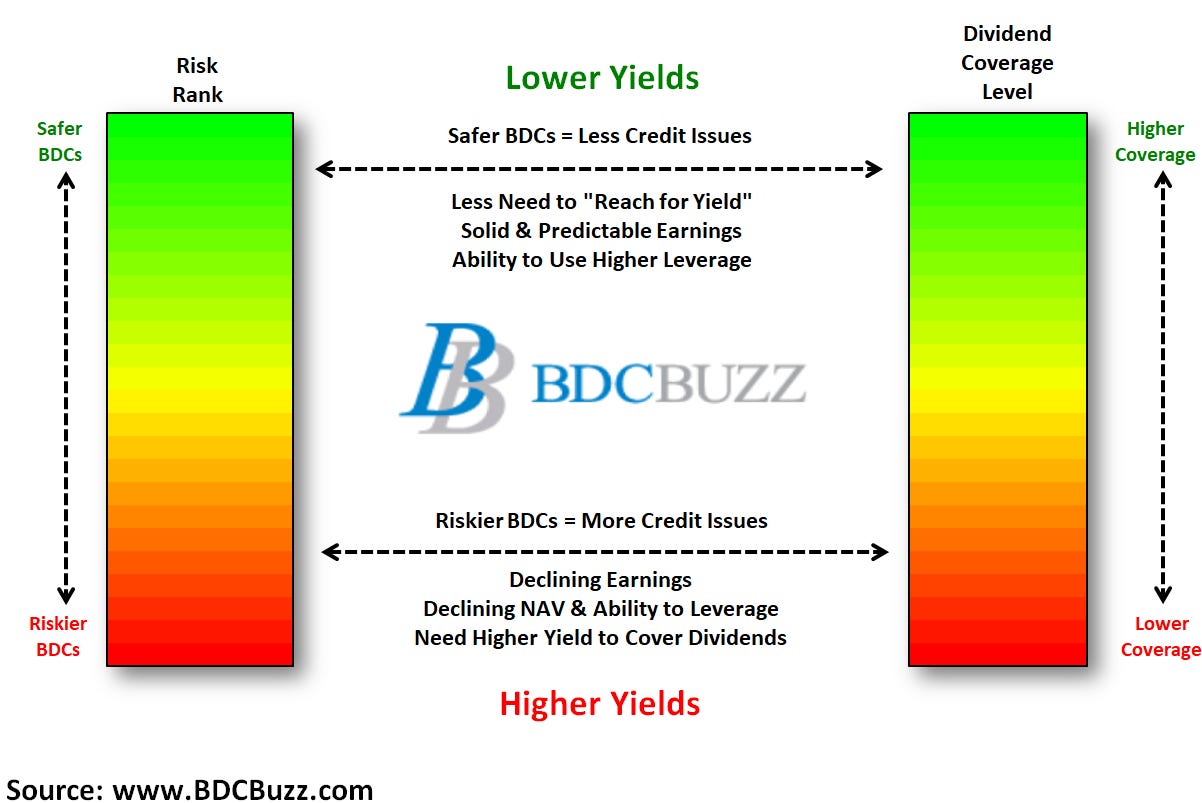
This information was previously made available to subscribers of BDC Buzz Premium Reports. BDCs trade within a wide range of multiples driving higher and lower yields mostly related to portfolio credit quality and dividend coverage potential (not necessarily historical coverage). This means investors need to do their due diligence before buying, including setting target prices using the portfolio detail shown in this article (at a minimum) as well as financial dividend coverage projections over the next three quarters, as discussed earlier.
