Summary
- Many investors ask where BDC stocks and bonds fit into their overall portfolio and this update should help.
- To keep it simple, this update uses oversimplified asset classes of cash, treasuries, corporate bonds/notes, other stocks (general market equities), and higher-yield investments (including BDCs).
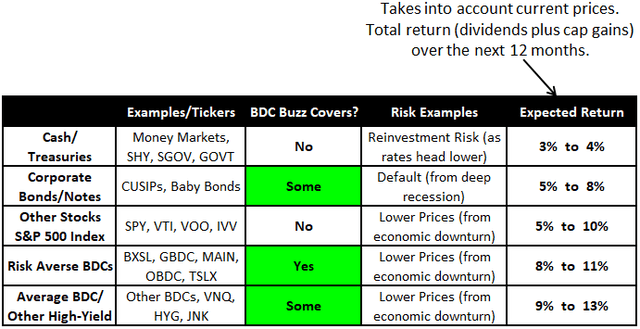
- The table below uses what I consider to be conservative estimates for annual total returns (dividends plus capital gains) and takes into account current price levels.
As discussed in previous updates, one of the many reasons that I like to invest in the BDC sector is taking advantage of market volatility to lower my weighted average purchase prices, driving much higher returns. Please see the previous update which discussed the BDC Google Sheets with real-time pricing and recommendations to help in identifying actionable opportunities during market volatility using the following tabs:
![]()
Typical Steps to Creating a Retirement Portfolio
A typical advisor charges 1% or more of the portfolio value per year for what most people can do themselves.
- Set a realistic budget.
- Calculate the amount of pre-tax income needed from your investment portfolio.
- Assess risk tolerance including asset allocations.
Many subscribers ask where BDC stocks and bonds fit into their overall portfolio. Your portfolio allocations depend on a few factors, including your age, overall risk appetite, investment time frame, and need to access capital.
Historically, investment advisors used the “100 minus your age” axiom to estimate the stock portion of your portfolio. However, that was likely when the average life expectancy was 65 to 70 compared to the current 85 or higher depending on many factors, and has been revised to 120.
- For example, if you’re 60, 60% of your portfolio should be in stocks.
Clearly, BDCs are for longer-term investors so please allow an investment time frame of at least 3 years.
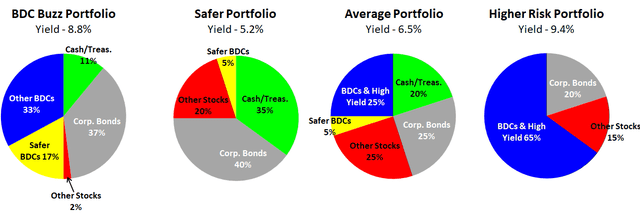
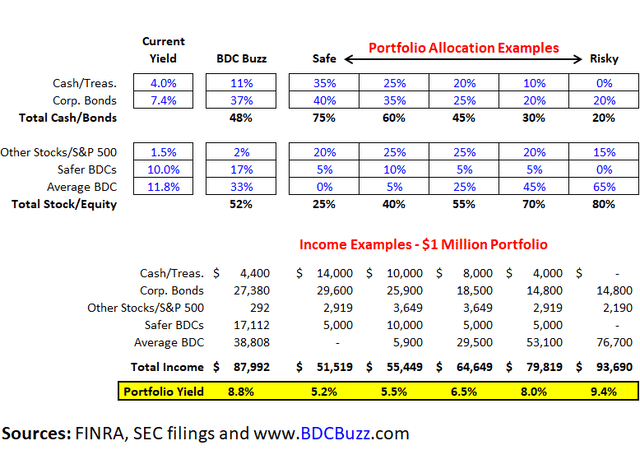
The following charts use the oversimplified asset classes of cash, treasuries, corporate bonds/notes, other stocks (general market equities), and higher-yield investments (including BDCs/CEFs) along with some examples of allocations and my personal portfolio (not exact):
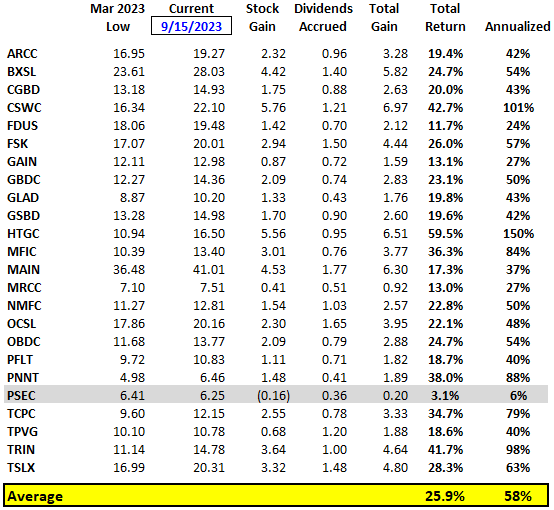
 The table below uses what I consider to be conservative estimates for annual total returns (dividends plus capital gains) and takes into account current price levels. As shown later, the average BDC has provided annualized returns of 58% for investors who purchased shares near the lows in March 2023.

As shown in the previous table, we have broken out the BDCs selected for ‘Risk Averse’ investors. Please see the “Introduction To BDC Google Sheets” for a discussion of the Risk-Averse portfolio.

The following table shows the changes in stock prices from the March 2023 lows (most of which were on March 13, 2023) plus dividends accrued/paid. The average return is around 26% over the last 6 months (annualized returns of 58%), excluding PSEC, which continues to underperform.

BDC Position Categories & Building Your Portfolio
Category A: This is for starter and smaller positions. We suggest starting a position with a smaller number of shares closer to its target price and then continuing to “buy more on the dips”. I recently did this with TRIN.
Category B: This is for current positions that you want to grow into a full/proper allocation for a diversified portfolio. We suggest adding to these positions using the suggested ‘High’ and ‘Low’ limit order prices discussed earlier.
Category C: This is for investors that already have larger positions and would likely only add at opportunistic prices near the suggested ‘Low’ limit order prices, potentially during market volatility/pullbacks. Active traders might choose to sell these shares for capital gains at a later date to re-balance the portfolio.
What is a “full position”? A full position would be the amount you want to invest into a particular stock based on the total amount available and considering the rest of your portfolio. I suggest having at least 5 BDC positions and up to 15 or 20 positions for larger portfolios. This will help with portfolio stability when select BDCs report disappointing quarters (they all do at some point). For investors with only 5 positions, this means that around 20% of the amount allocated to BDCs is considered a “full position/allocation”. I typically have 16 to 20, so a full position is around 5% to 6% of my BDC portfolio.
Over the years, I have carefully built a portfolio that I continually adjust. For investors who are looking to build a BDC portfolio, please consider the following suggestions:
- Identify BDCs that fit your risk profile by reading the individual Deep Dive Projection reports for each BDC.
- Use the BDC Google Sheets during market volatility to identify opportunities.
- Starter Positions: It is important for new investors to be patient and start with a smaller amount of shares using limit orders. Initiating a position will help with gaining interest and following the stock (also management team and credit platform) to develop a comfort level for future purchases
- Diversify: I suggest having at least 5 BDC positions and up to 15/20 positions for larger portfolios. This will help with portfolio stability when select BDCs report disappointing quarters (they all do at some point).
- Opportunity Cost: Keep in mind that while you are waiting for lower prices, BDCs are paying healthy amounts of dividends.
- Dollar Averaging Purchases: There will continue to be general market and/or sector volatility driving lower prices, providing opportunities to lower your average purchase prices.
