
Summary:
- This article discusses the BDC Google Sheets with real-time pricing and recommendations to help in identifying actionable opportunities during market volatility.
- For new subscribers, we discuss Suggested BDC Portfolios and Ranking Tiers as well as how to build a portfolio using the BDC Google Sheets.
- For lower-risk investors building a balanced 60/40 portfolio (stocks and bonds), the “BDC Notes” tab includes Interest Expense Coverage and Asset Coverage ratios.
- We continually update the “Buzz Returns” tab, which shows the total returns for each of the 121 trades over the last 8 years.
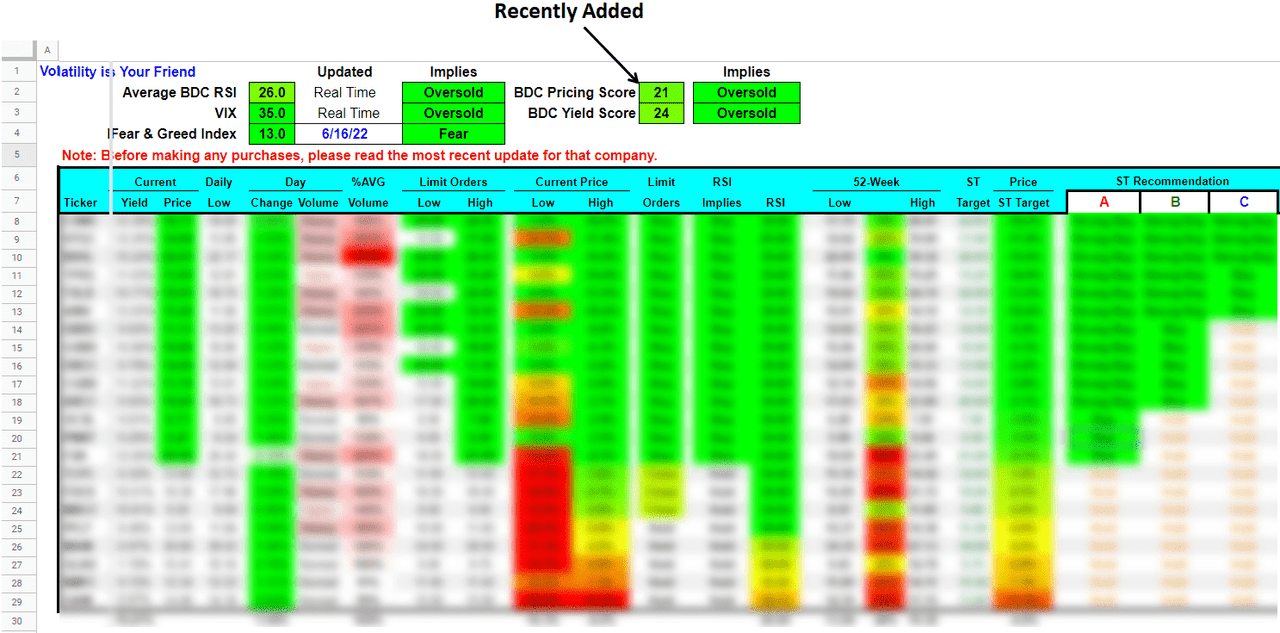
- We continually assess “oversold” or “overbought” conditions looking for buying opportunities using the “Volatility” tab which displays key market indicators in real-time along with recommended limit order prices, RSI, Short-Term and Longer-Term target prices, and recent/previous lows for each BDC.
You can sign up for the BDC Google Sheets using the following link:
This update discusses the BDC Google Sheets with real-time pricing and recommendations to help in identifying actionable opportunities during market volatility using the following tabs, as discussed below:
- All BDC Stocks (includes BDC Buzz ‘Buy & Hold’ allocations)
- Dividend Detail & Expectations (for each BDC)
- BDC Charts
- Ranking Tiers & Leverage
- Suggested BDC Portfolios (Risk Averse, Total Return, Recommended Higher-Yield, & High Yield)
- Volatility (important for building current positions)
- BDC Buzz Total Returns (121 trades over the last 8 years)
- BDC Notes (with continually updated coverage ratios)
- All Baby Bonds/Preferreds
- Risk Rankings for Baby Bonds/Preferreds
![]()
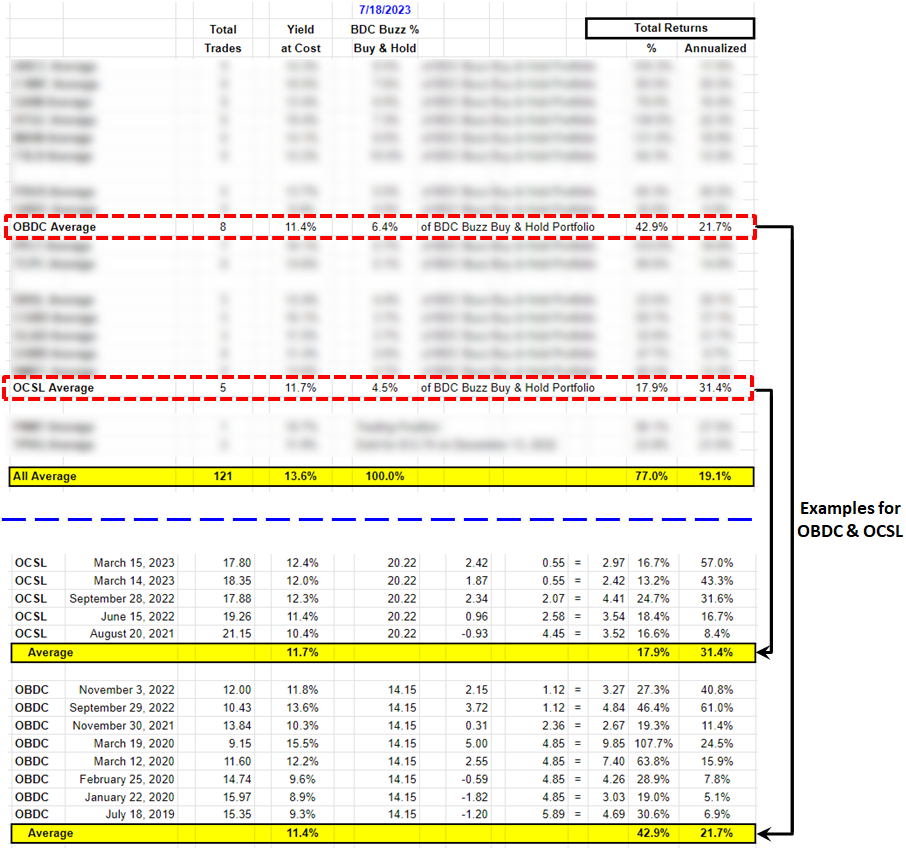
BDC Buzz Total Returns
We continually update the “Buzz Returns” tab, which shows the total returns from my recent and previous trades:
![]()
Please note that the details for each of the 121 trades over the last 8 years are included below the table, showing the total returns, all of which are in positive territory after taking into account the dividends paid. My annualized returns are currently over 19% partially due to making purchases during general market volatility, as discussed in the Upcoming BDC Buzz Purchases report.
The “Annualized” return shown does not use a simple average but shows the actual compounding of annual returns. This is the true return each year. Below the main table, there are details for each of the 121 trades broken out by BDC.
See below for examples of two of my relatively newer positions OBDC (4 years) and OCSL (2 years):
“All BDCs” Tab

The “All BDCs” tab includes links to the most recent Deep Dive Projection reports on each BDC. Also included:
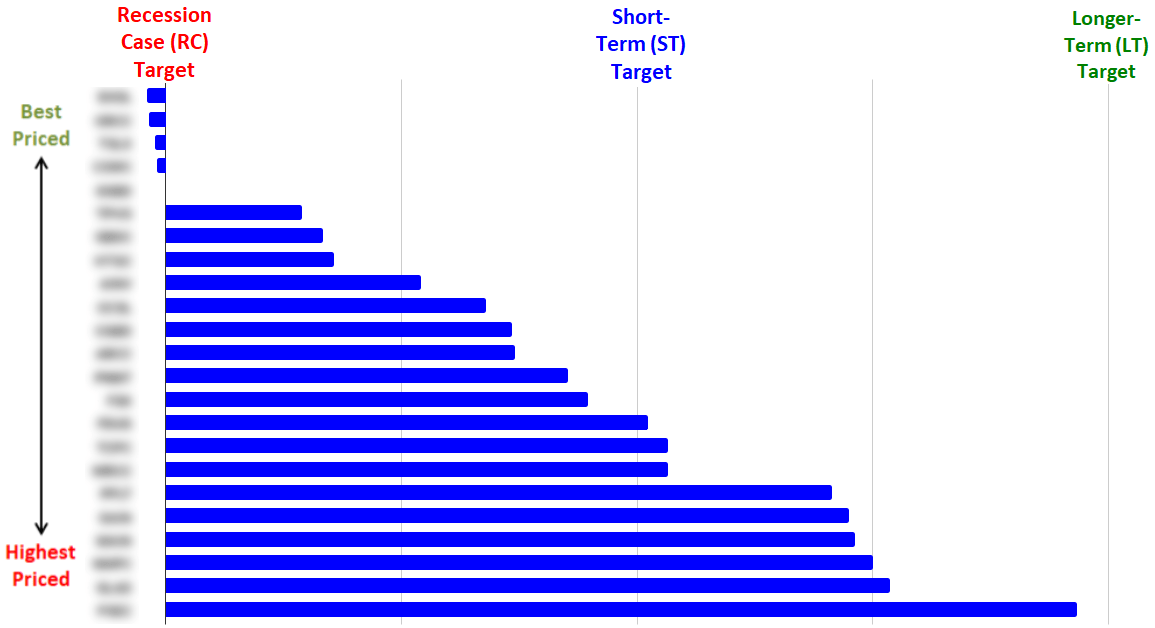
- Recommendations for Short-Term (“ST”) and Longer-Term (“LT”) target prices
- Ex-Dividend Dates
- Current Dividend Yields
- Price-to-NAV Multiples
- Trading Volumes With Indicators (Light, Normal, High, Heavy)
- Relative Strength Index (“RSI”, discussed below)
- 52-Week Lows and Highs
- Moving Averages (50 and 200 days)
- BDC Buzz Portfolio Allocations
General BDC Target Pricing Assumptions
- Short-Term (“ST”) Target Price = Assumes an extended market pullback (potentially due to expectations of an economic downturn).
- Longer-Term (“LT”) Target Price = Over the next 12 to 24 months and based on returning to normal market conditions.
- Recession Case (“RC”) Target Price = Assumes a deep, broad, and/or prolonged recession.
BDCs are currently trending closer to or below their Short-Term (“ST”) target prices. However, BDC pricing reacts quickly and could eventually trend back to their Longer-Term (“LT”) targets again if inflation moderated to a point where the Fed took a less aggressive approach coupled with maintained economic indicators.
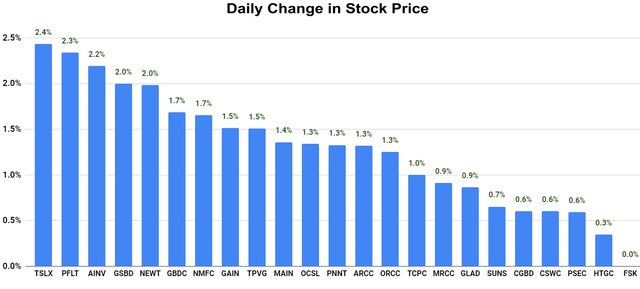
Trading Volume
The sheets measure the average volume being traded for all BDCs to see if it is an active or slow trading day for the sector (considering the time of day) and then identify BDCs that are trading above or below that average (also given the time of day). This is important because investors should know when volumes might indicate something meaningful is occurring with the stock (positive or negative).
Relative Strength Index
The Relative Strength Index or RSI is an indicator that I use only after I already know which BDC I would like to purchase but waiting for a good entry point. I consider target prices to be much more important when adding to current positions. Also, I would suggest that investors ignore RSI when starting small positions and then use it for timing additional purchases to build their position. Previously added was a column showing “RSI Implies” using:
- 40 or below = “Buy”
- 41 to 69 = “Hold”
- 70 or higher = “Overbought”
This is a complicated formula that takes into account changes in daily pricing over a rolling 365 days. The RSI values are color-coded with green showing closer to 30 (indicating oversold), yellow showing near 50, and red showing closer to 70 (indicating overbought).
Definition from Investopedia:
The relative strength index is a momentum indicator developed by noted technical analyst Welles Wilder, that compares the magnitude of recent gains and losses over a specified time period to measure speed and change of price movements of a security. It is primarily used to attempt to identify overbought or oversold conditions in the trading of an asset. Traditional interpretation and usage of the RSI is that RSI values of 70 or above indicate that a security is becoming overbought or overvalued, and therefore may be primed for a trend reversal or corrective pullback in price. On the other side of RSI values, an RSI reading of 30 or below is commonly interpreted as indicating an oversold or undervalued condition that may signal a trend change or corrective price reversal to the upside.”
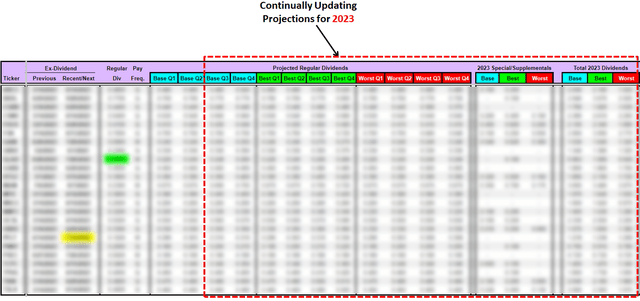
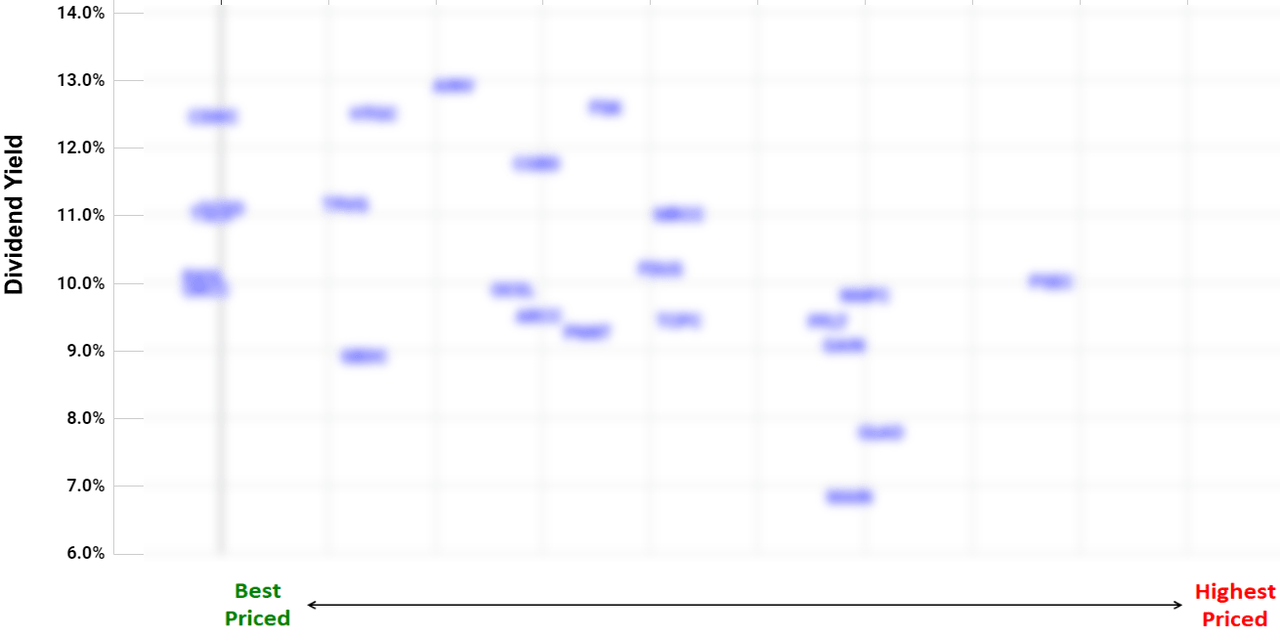
Dividend Detail & Expectations
The “Dividends” tab shows the current and expected dividends for each BDC, including the base, best, and worst-case scenarios. This information is important, as it is one of the primary drivers for target prices (along with portfolio credit quality).
This information is continually updated as the projections for each BDC are adjusted to take into account reported results:
- Regular and total dividend yields
- Pay frequency
- Previous and upcoming ex-dividend dates
- Current regular dividend
- Base, Best, Worst Case projected quarterly dividends
- Base, Best, Worst Case projected special dividends
We have recently added Trinity Capital (TRIN) and continue to update the projected dividends for Q3 and Q4 2023 as well as total expected dividends for 2023, as each of the Deep Dive Projection reports are updated:
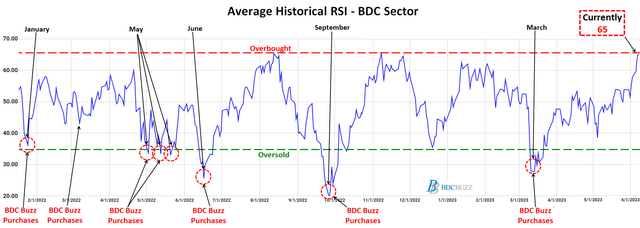
Charts to Help Take Advantage of Market Volatility
The following tab is one of my favorites, as it provides charts to help investors take advantage of upcoming/continued volatility:

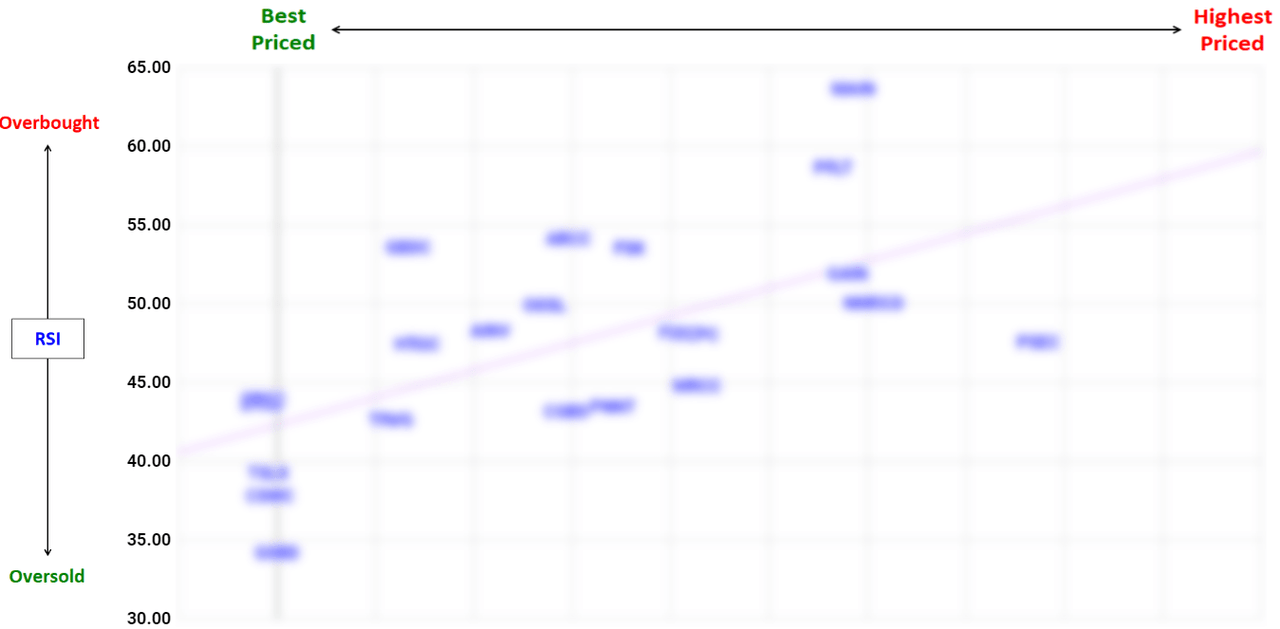
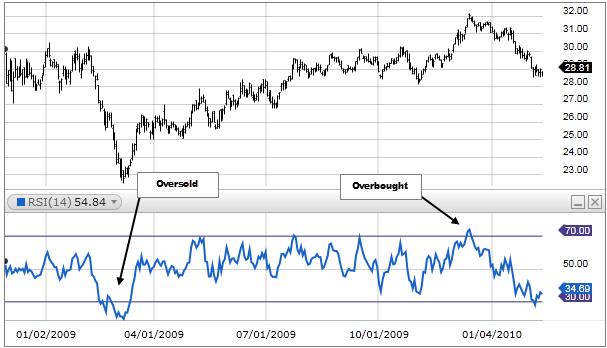
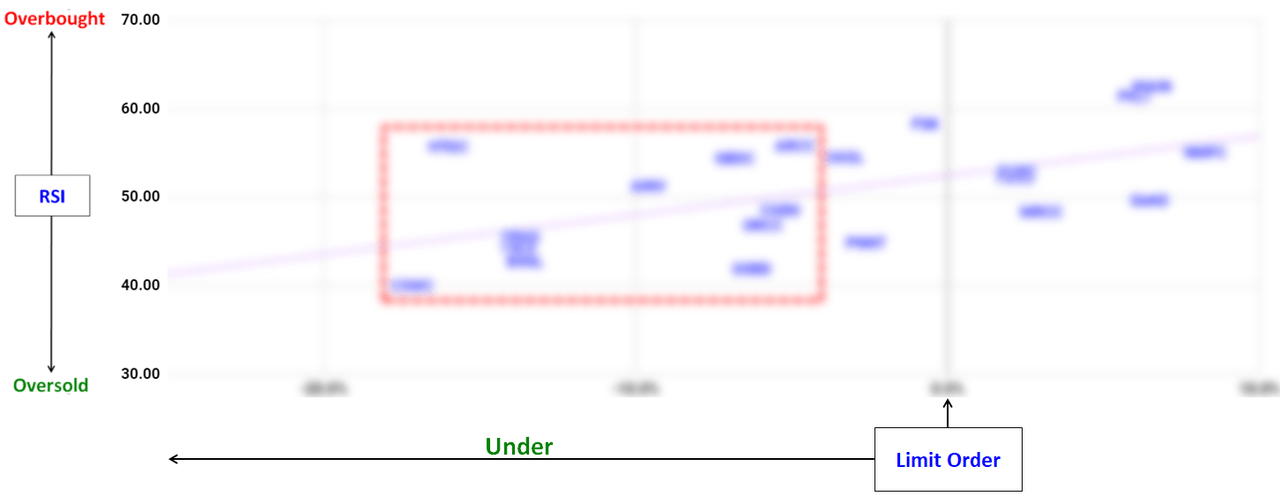
The following chart shows in real-time if the sector is overbought or oversold. When the entire sector is oversold, there’s nothing wrong with “your stock” and it means that you may want to buy more at these levels. BDC pricing is often driven by changes in investors’ attitudes about risk.
BDC prices continue to rally from the March 2023 lows likely due to reporting strong Q1 2023 results with average dividend coverage of around 125% even after taking into account the massive amount of dividend increases for the sector (90% of all BDCs have increased their dividends recently). Also, most BDCs reported stable to growing NAV per share.
As shown below, the average RSI has rebounded again from the most recent low in March 2023. Also shown are my previous purchase points, as I continue to take advantage of market volatility to make additional purchases of my smaller positions, which have provided excellent returns that will be discussed in upcoming articles.
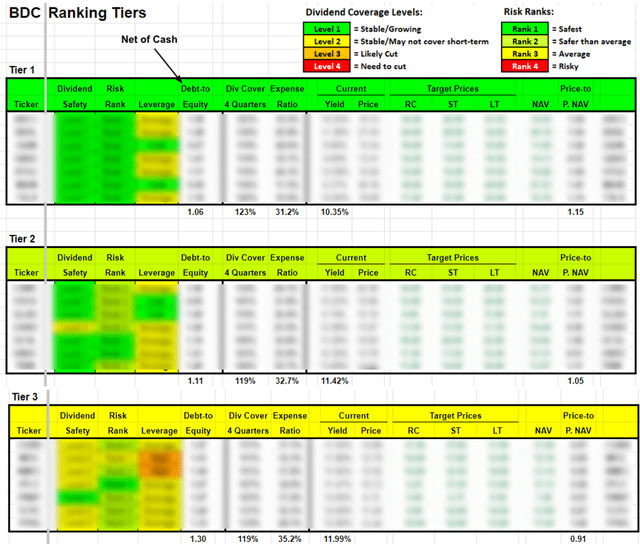
BDC Ranking Tiers
It is important to understand the Ranking Tiers are based on a relative basis, meaning that just because a company is ranked as ‘Tier 2’ or ‘Tier 3’ does not imply that it is a ‘bad’ stock. I own many Tier 3 companies, some of which might be upgraded over the coming weeks. The Ranking Tiers combine the results from many of the reports available at the link provided earlier and are primarily responsible for driving the target pricing assigned to each BDC focused on capital preservation, including NAV per share stability and portfolio strength, to sustain dividend coverage.
This includes the ability of the portfolio to retain value during an economic downturn. One of the best approaches to assessing risk in a BDC portfolio is using a “vintage analysis” that takes into account many aspects including the time frame that each loan was originated as well as asset class, maturity, directly originated vs. syndicated, industry sector, PIK vs. cash yields. BDCs that were lending during times of less protective covenants and higher leverage multiples while maintaining higher-than-average yields will likely have upcoming credit issues regardless of the overall economy
Assessing which vintages are potentially riskier than others is an evolving art and there are a few key indicators that I use, including historical market liquidity levels, default rates, leverage multiples, and covenant light trends. More importantly, I compare the cash/PIK yields of each loan by the time frame that they were originated, but also taking into account the asset class and company sector. Specifically, I am looking for “above market” yields that could imply higher risk. Another important indicator is loans that should have been refinanced at lower rates and are past their “prepayment penalty” windows. This would include loans that have much higher than current market yields and could easily be refinanced unless the portfolio company has potential credit issues.

The “Debt-to-Equity” ratio excludes cash, which is important for BDCs with meaningful amounts of cash relative to their borrowings.
The “Expense Ratio” is the average “Operating Cost as a Percentage of Available Income” measuring operating, management, and incentive fees compared to available income over the last four quarters. “Available Income” is total income less interest expense from borrowings and is the amount of income that is available to pay expenses, including shareholder distributions. BDCs with lower operating expenses can pay higher amounts to shareholders without investing in riskier assets.
- Also, the quality of the credit platform and management is critical when determining which Tier is assigned to each BDC. These are ‘qualitative’ measures that do NOT fit into boxes in the table below.
Suggested BDC Portfolios

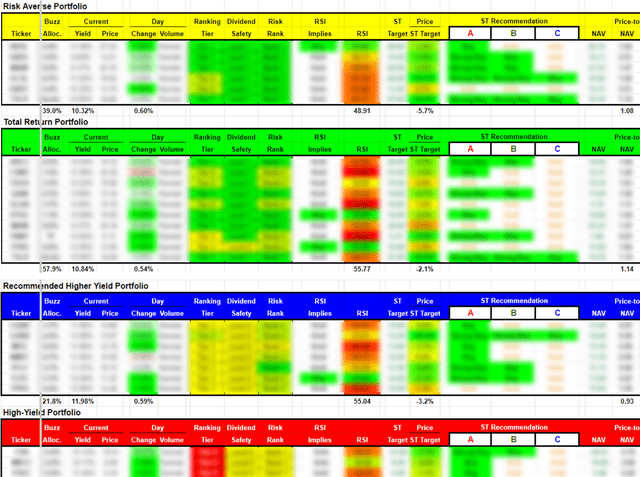
Risk-Averse:
This portfolio is for investors concerned with capital preservation (especially during a recession) and seeking less volatility along with solid dividends. These BDCs typically have lower-than-average yields due to lower-yielding and safer investments. Many of these companies have lower fee structures to ensure dividend coverage with safer investments. Many of the lower-risk BDCs have higher pricing multiples contributing to lower-than-average yields, but during recessions, they tend to outperform the others with less volatility and still pay a healthy dividend with long-term capital appreciation.
Total Return:
This portfolio is appropriate for longer-term investors concerned with tax-adjusted returns from dependable regular dividends and the potential for special dividends as well as long-term capital appreciation from increased stock values. Overall returns will probably be higher and have more favorable tax treatments (depends on the year, changes frequently for some). However, many of these BDCs are also priced at a premium with correspondingly lower dividend yields and may involve more risk due to higher amounts of equity investments needed for NAV per share growth and the potential for realized gains to pay special dividends.
Recommended Higher-Yield:
This portfolio could also be called ‘Cruising Altitude BDCs’, meaning that most of these BDCs have reached a fully ramped dividend (Level 2) and are now focused on portfolio maintenance. These BDCs may have lower dividend coverage potentially supported by management willing to waive fees to ensure coverage, hopefully giving them more sustainable dividends than other higher-yielding BDCs. I will be making changes to this portfolio mostly based on pricing and updated projections included in the Dividend Coverage Levels report.
High-Yield:
This portfolio could also be called ‘Underdogs’ and is for investors that are willing to take on more risk with less capital appreciation (over the long-term), but higher dividend yields. These stocks usually have higher volatility, offering the potential for higher returns depending on investment timing. Most of these companies trade at lower multiples, typically at a meaningful discount to NAV.
Taking Advantage of Market Volatility
We continually assess overall BDC Pricing relative to other yield-related investments looking for “oversold” or “overbought” conditions. This includes general sector and individual BDCs keeping subscribers up to date on potential buying opportunities.
Volatility is your friend, invest in higher quality, constantly monitor the fundamentals, and don’t freak out when you see your investments going on sale for no reason. Most BDCs continue to report strong results due to previously improved earnings and balance sheets, relatively low leverage, maintaining excellent credit quality, previously reduced borrowing rates, dividend increases, management carefully deploying capital into first-lien assets of non-cyclical companies with strong covenants, etc.
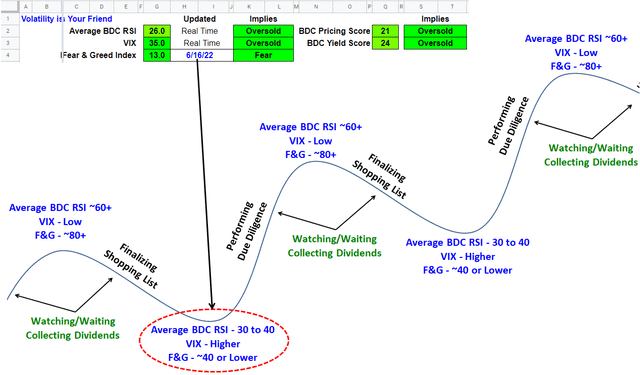 The “Volatility” tab displays key market indicators in real-time along with recommended limit orders, RSI, ST and LT targets, and recent/previous lows for each BDC:

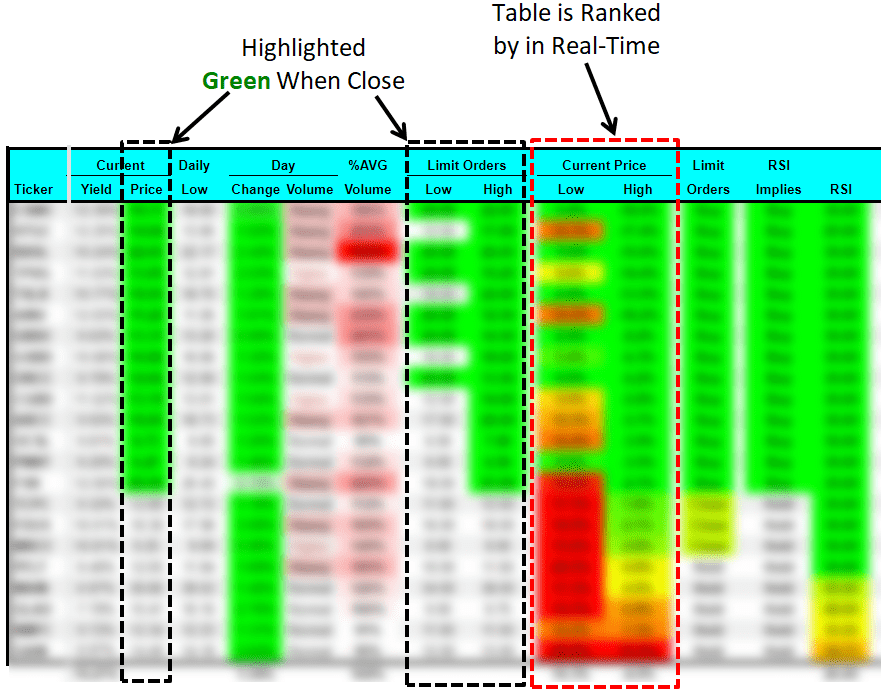
The table below shows the real-time volatility indicators as well as the following details for each BDC:
- Current BDC prices and yields
- Daily change and volume indicators (discussed earlier)
- Recommended “limit orders” (Low and High)
- Current price compared to the recommended ‘Low’ and ‘High’ limit orders
- RSI and what it implies (Buy, Hold, Overbought)
- ST and LT targets and current difference to the actual price
- 52-week lows and highs
- BDC Sector Pricing Score (discussed below)
- BDC Sector Yield Score (discussed below)
- Recent stock price lows (far right, not shown in this example)
- BDC Buzz allocations (far right, not shown in this example)
BDC Position Categories & Building Your Portfolio
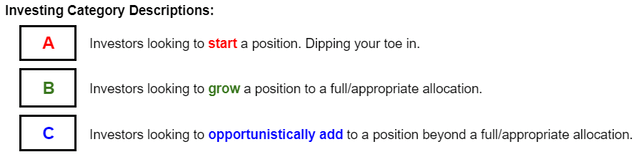
Category A: This is for starter and smaller positions. We suggest starting a position with a smaller number of shares closer to its target price and then continuing to “buy more on the dips”.
Category B: This is for current positions that you want to grow into a full/proper allocation for a diversified portfolio. We suggest adding to these positions using the suggested ‘High’ and ‘Low’ limit order prices as discussed later.
Category C: This is for investors that already have larger positions and would likely only add at opportunistic prices near the suggested ‘Low’ limit order prices, potentially during market volatility/pullbacks. Active traders might choose to sell these shares for capital gains at a later date to re-balance the portfolio.
We have developed a scoring system to keep subscribers updated on the current conditions of the BDC sector using pricing (most important), RSI (least important), and yields. This system should help subscribers identify the current market conditions for those who are using this volatility to build portfolios.
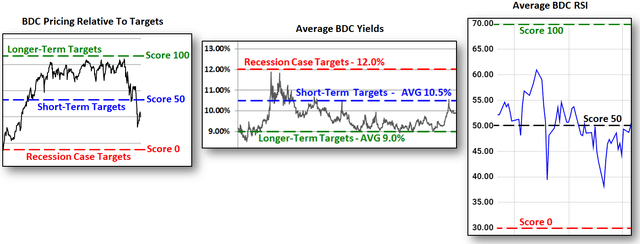
BDC Pricing Score (Relative to Targets)
- Score 100 = the average BDC trading at its LT targets
- Score 50 = the average BDC trading at its ST targets
- Score 0 = the average BDC trading at its RC targets
The suggested range for limit orders is between the ‘Low’ and ‘High’, giving subscribers an idea of how low a stock can go during market volatility. Start near the high and then set others lower down to the low. Use odd amounts, like $0.01 or $0.06. Each lower price should have more shares as you go.
The table is ranked in real-time by an average of the current price compared to both the recommended ‘Low’ and ‘High’ limit order prices. This means that better deals are at the top of the table. Another feature is highlighted prices for each in “green” when they are under or very close to the recommended ‘Low’ or ‘High’ limit orders.
 The following charts use this information from the previous table to provide a more visual format for finding buying opportunities.
You can sign up for the BDC Google Sheets using the following link:
Tradeable BDC Notes
- Please see the end of this update for a discussion of how to trade BDC notes.
As mentioned in previous updates, many BDCs have investment grade (“IG”) bonds/notes for lower-risk investors building a balanced 60/40 portfolio (composed of 60% to 70% stocks/equities and 30% to 40% bonds or other fixed-income offerings). Stock market volatility will likely remain elevated, and these bonds/notes allow investors to lock in 6% to 9% annualized returns with maturities ranging from 1 to 8 years.
 Why the recent focus on BDC Notes?
Great question. They were previously overpriced, and prices continue to decline because of the recent and expected rise in interest rates.
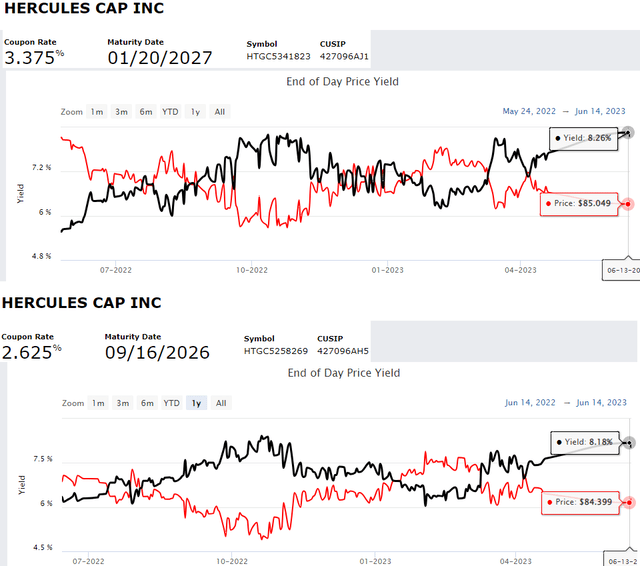
As mentioned in the HTGC Deep Dive Projection report, HTGC has two publicly traded investment grade bonds/notes (CUSIPs: 427096AH5 and 427096AJ1) recently trading at prices with yield-to-maturities of over 8%.
Each of the updated Deep Dive Projection reports includes the projected interest expense coverage and asset coverage ratios with best, base, and worst case. Please see the following links from Investopedia for more information:
- Interest Expense Coverage
- Asset Coverage Ratio
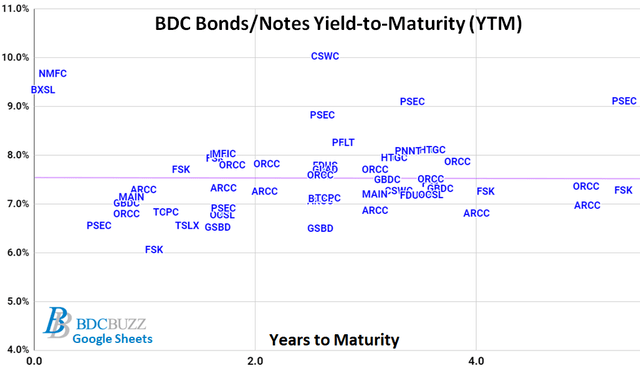
The following sheet includes links so that subscribers can pull up the most recent trades, pricing, and yield information for each. As you can see, we have added quite a few and will continue to add for each BDC.
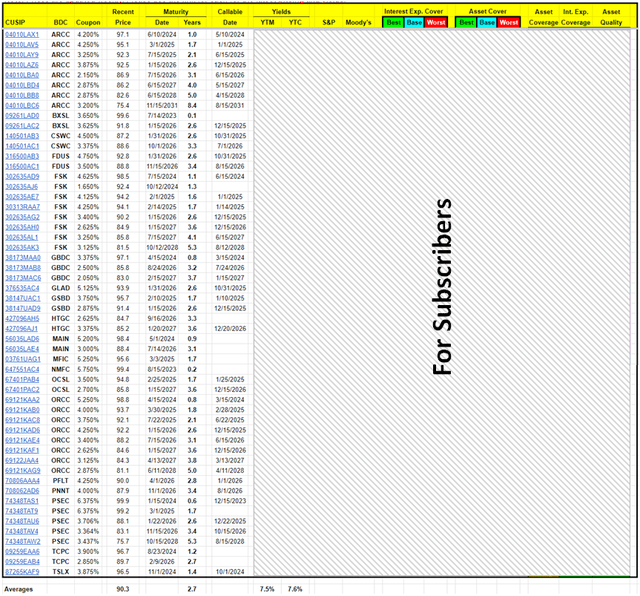
The following chart can be found just below the table, showing the current yield-to-maturity and years to maturity.
The following are some options that BDC management teams have before potentially defaulting on a debt obligation:
- Reducing leverage by not reinvesting repayments from portfolio companies
- Reducing the dividend to common shareholders
- Reducing or waiving management and incentive fees
- BDCs have permanent equity capital (no “runs on the bank” to force the liquidation of undervalued assets)
- Raising equity capital: common or preferred, even dilutive if absolutely necessary
- External manager/credit platform can provide additional capital if needed
For these reasons, no BDC has defaulted on a debt obligation.
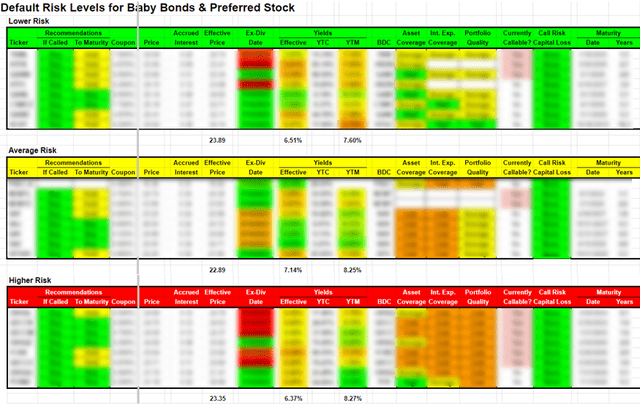
Baby Bonds & Preferred Stock Sheets
The following information is included in the “Bond Info” sheet:
- The “Bond Risk” tab is ranked by Default Risk with notification of Call Risk Capital Loss, which changes based on the current pricing.
- It is important to take into account which BDCs are “callable” and the potential for capital losses during the worst-case scenario.
- The Call Risk Capital Loss refers to the worst-case scenario of the bond being called tomorrow and takes into account 30 days of additional interest accrued before being redeemed.
- Breakeven Days refer to the number of days of interest needed to breakeven given the current market price
- BDC Baby Bonds trade “dirty” which means that there is a certain amount of accrued interest in the market price.
- Investors need to own the Baby Bond one trading day before the ex-dividend date to be eligible for the full quarter of interest.
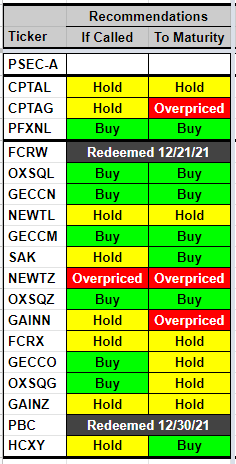
Recommendations Based on “If Called” and “To Maturity”:
- “If Called” – assumes that the Baby Bond is called in the near future.
- “To Maturity” – assumes that you hold until maturity.
Previously we made a few changes to the Baby Bond tabs including adding recommendations based on “If Called” and “To Maturity” (discussed below) along with “Suggested Buy” prices (see below) that change daily based on accruing interest and days to call/maturity. This means if you are using them to set limit orders you need to adjust weekly as well as take into account the ‘Ex-Div Date’, which is quarterly and the price will probably change on the following day, which might trigger your limit order. I will discuss this in upcoming updates. This pricing is mostly driven by the “call date’ as I firmly believe that the largest risk for investors is the “redemption risk”. There has never been a default on a BDC Baby Bond as there are many levers management can pull before this worst-case scenario.
The “Suggested Buy” price takes into account the call date and ensures that investors get a minimum of around 5% annual returns for lower risk and 6% for higher-risk Baby Bonds if the company decides to redeem early (on the “Call Date” or in 30 days for the ones that are currently callable).
The recommendations change in real-time based on current pricing, ex-distribution date, call/redemption date, maturity date, etc.
The “Bond Risk” Tab:
 The “Bond Risk” tab includes a summary of metrics used to analyze the safety of a debt position, such as the “Interest Expense Coverage” ratio, which is used to see how well a firm can pay the interest on outstanding debt. Also called the times-interest-earned ratio, this ratio is used by creditors and prospective lenders to assess the risk of lending capital to a firm. A higher coverage ratio is better, although the ideal ratio may vary by industry. When a company’s interest coverage ratio is only 1.5 or lower, its ability to meet interest expenses may be questionable.
The asset coverage ratio is a financial metric that measures how well a company can repay its debts by selling or liquidating its assets. The higher the asset coverage ratio, the more times a company can cover its debt. Therefore, a company with a high asset coverage ratio is considered to be less risky than a company with a low asset coverage ratio.
The Bond Risk tab is ranked by Default Risk with notification of Call Risk Capital Loss, which changes based on the current pricing. Also included are ‘Buy’, ‘Hold’, or ‘Overpriced’ indicators for each Baby Bond/Preferred that is driven by real-time pricing (taking into account accrued interest), which BDCs are “callable” and the potential for capital losses during the worst-case scenario, and effective yields. The ‘Overpriced’ indicator is for BDCs with a higher risk of Capital Losses mostly due to being called at current prices.
BDC Position Categories & Building Your Portfolio
Category A: This is for starter and smaller positions. We suggest starting a position with a smaller number of shares closer to its target price and then continuing to “buy more on the dips”.
Category B: This is for current positions that you want to grow into a full/proper allocation for a diversified portfolio. We suggest adding to these positions using the suggested ‘High’ and ‘Low’ limit order prices as discussed later.
Category C: This is for investors that already have larger positions and would likely only add at opportunistic prices near the suggested ‘Low’ limit order prices, potentially during market volatility/pullbacks. Active traders might choose to sell these shares for capital gains at a later date to re-balance the portfolio.
What is a “full position”? A full position would be the amount you want to invest into a particular stock based on the total amount available and considering the rest of your portfolio. I suggest having at least 5 BDC positions and up to 15 or 20 positions for larger portfolios. This will help with portfolio stability when select BDCs report disappointing quarters (they all do at some point). For investors with only 5 positions, this means that around 20% of the amount allocated to BDCs is considered a “full position/allocation”. I typically have 16 to 20, so a full position is around 6% of my BDC portfolio.
Investors will continue to need equity investments (stocks) to generate an adequate portfolio yield (to keep up with inflation and/or higher yield expectations). BDCs pay higher-than-average yields with the average BDC currently yielding around 11%. Safer BDCs typically yield between 8% and 10%, but patient investors can get higher yields by taking advantage of volatility.
Over the years, I have carefully built a portfolio that I continually adjust. For investors that are looking to build a BDC portfolio, please consider the following suggestions:
- Identify BDCs that fit your risk profile by reading the individual Deep Dive Projection reports for each BDC.
- Use the BDC Google Sheets during market volatility to identify opportunities.
- Starter Positions: It is important for new investors to be patient and start with a smaller amount of shares using limit orders. Initiating a position will help with gaining interest and following the stock (also management team and credit platform) to develop a comfort level for future purchases.
- Diversify: I suggest having at least 5 BDC positions and up to 15/20 positions for larger portfolios. This will help with portfolio stability when select BDCs report disappointing quarters.
- Opportunity Cost: Keep in mind that while you are waiting for lower prices, BDCs are paying healthy amounts of dividends.
- Dollar Averaging Purchases: There will continue to be general market and/or sector volatility driving lower prices, providing opportunities to lower your average purchase prices.
You can sign up for the BDC Google Sheets using the following link:
What Can I Expect Each Week With a Paid Subscription?
Each week we provide a balance between easy-to-digest general information to make timely trading decisions supported by the detail in the Deep Dive Projection reports (for each BDC) for subscribers that are building larger BDC portfolios.
- Monday Morning Update – Before the markets open each Monday morning, we provide quick updates for the sector, including significant events for each BDC along with upcoming earnings, reporting, and ex-dividend dates. Also, we provide a list of the best-priced opportunities along with oversold/overbought conditions, and what to look for in the coming week.
- Deep Dive Projection Reports – Detailed reports on individual BDCs each week prioritized by focusing on buying opportunities and potential issues such as changes in portfolio credit quality and/or dividend coverage (usually related). This should help subscribers put together a shopping list ready for the next general market pullback.
- Weekly General Updates or Comparison Reports – A series of updates discussing ‘Building a BDC Portfolio’, suggested pricing and limit orders, expense/return ratios, interest rates, leverage, BDC Investment Grade Notes/Baby Bonds, portfolio mix, and potential impacts on dividend coverage and risk.
![]()