TPVG: Stable 11% Yield With Pre-IPO VC Tech Exposure For Higher Returns

Summary

  • TPVG has rallied 13% since my previous article “11.7% Yield Positioned For Rising Rates And Ready To Rally” partially due to the expected earnings beat for Q2.
  • TPVG recently completed an equity offering, and this article discusses some of the pros and cons as well as reasons to purchase the stock depending on pricing.
  • Also predicted, TPVG recently obtained shareholder approval to reduce its asset coverage requirement from 200% to 150%, effective June 22, 2018.
  • This article also discusses the potential impact from rising interest rates and the recent total returns from my previously announced purchases of higher quality BDC stocks, including TPVG.

You can read the full article at the following link:

Please read the full article at the link provided above or sign up for Premium Reports that includes updated Deep Dive Reports on each BDC including this one.

TPVG Article Follow-Up:

This article is a followup to “11.7% Yield Positioned For Rising Rates And Ready To Rally“:

As predicted in the article linked above, the stock price for TriplePoint Venture Growth (TPVG) rallied 13% shortly after the article and the company easily beat analyst expected EPS by $0.10 per share. As mentioned in the previous article, TPVG was expected to easily cover its dividend due to prepayment-related income from its $50 million loan to Ring, Inc. driving an effective yield of 17.2% as shown below.

PFLT: PSSL Growth & Higher Leverage

Summary

  • PFLT reported between my base/best cases covering 98% of its dividend. Portfolio growth was higher-than-expected and there was another increase in portfolio yield driving interest income to its highest level.
  • The portfolio remains predominantly invested in first-lien debt at around 81% portfolio and the PSSL now accounts for 13% (previously 9%) and is 100% invested in first-lien debt.
  • There were no investments on non-accrual as Sunshine Oilsands was exited and responsible for most of the realized losses. NAV per share declined by 1.1% due to various markdowns.
  • I am expecting improved dividend coverage through growth of its PSSL and slowly increasing leverage and eventually utilizing its Board approved reduced asset coverage ratio, effective as of April 5, 2019.

The following is a quick update that was previously provided to subscribers of Premium Reports on August  8, 2018. For target prices, dividend coverage and risk profile rankings, credit issues, earnings/dividend projections, quality of management, fee agreements, and my personal positions on all BDCs  (including this one) please see Deep Dive Reports.

PennantPark Floating Rate Capital (PFLT) reported between my base and best case projections covering 98% of its dividend and was not expected to fully cover due to being underleveraged. However, there was higher-than-expected portfolio growth and an increase in its portfolio yield (as predicted in the previous report) driving interest income to its highest level as shown below and likely adequate dividend coverage over the coming quarters. I am expecting the company to slowly increase its leverage and eventually utilize its Board approved reduced asset coverage ratio, effective as of April 5, 2019.

“Due to the activity level year to date as well as this quarter, the increase in LIBOR and the growth of PSSL, we are pleased that our current run rate net investment income covers our dividend,” said Arthur H. Penn, Chairman and CEO. “Our earnings stream should have a nice tailwind based on a continuation of these factors. Adding people to our platform has resulted in a significantly enhanced deal flow which puts us in a position to be both more active and selective.”

Please note that ‘Core NII’ excludes “$1.0 million on unrealized gains accrued but not payable”.

Also, there was previously around $0.45 per share of spillover to cover dividend shortfalls:

“We have significant spillover income that we can use as cushion to protect our dividend while we ramp the portfolio. As of September 30, our spillover was $0.45 per share.

There was another increase in its overall portfolio yield (from 8.6% to 8.7%).

As discussed in my previous reports, PFLT’s portfolio yield has started to increase partially due to additional returns from the PennantPark Senior Secured Loan Fund (“PSSL”) and I am expecting higher portfolio yield and dividend coverage in the upcoming quarters. In May 2018, the company doubled the capacity of the PSSL to a total of $630 million.

“As of June 30, 2018, PSSL’s portfolio totaled $346.9 million, consisted of 38 companies with an average investment size of $9.1 million and had a weighted average yield on debt investments of 7.7%. For the three months ended June 30, 2018, PSSL invested $142.7 million (of which $27.1 million was purchased from the Company) in 10 new and three existing portfolio companies with a weighted average yield on debt investments of 7.4%. PSSL’s sales and repayments of investments for the three months ended June 30, 2018 totaled $16.1 million.”

As of June 30, 2018, there were no investments on non-accrual status as Sunshine Oilsands Ltd. (previously on non-accrual) was exited and primarily responsible for realized losses of around $1.8 million during the quarter. Net asset value (“NAV”) per share decreased by 1.1% (from $13.98 to $13.82) due to markdowns in various investments including LifeCare Holdings, Quick Weight Loss Centers, Affinion Group Holdings, Chicken Soup for the Soul Publishing, and GCOM as well as restructuring its investment in New Trident HoldCorp, Inc.

The portfolio remains predominantly invested in first-lien debt at around 81% portfolio and the PSSL now accounts for 13% compared to 9% the previous quarter. It is important to note that PSSL is 100% invested in first-lien debt.

SUNS: Fee Waivers & Shareholder Vote To Increase Leverage

Summary

  • For the quarter ended June 30, 2018, SUNS hit my base case projections covering its dividend thanks to continued fee waivers which have increased over the last two quarters.
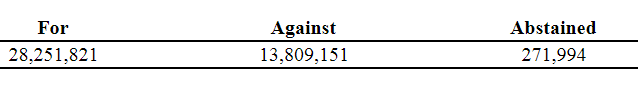
  • The Board approved a reduction in the minimum asset coverage ratio to 150% effective as of August 2, 2019, unless approved earlier by shareholders at its 2018 Annual Meeting.
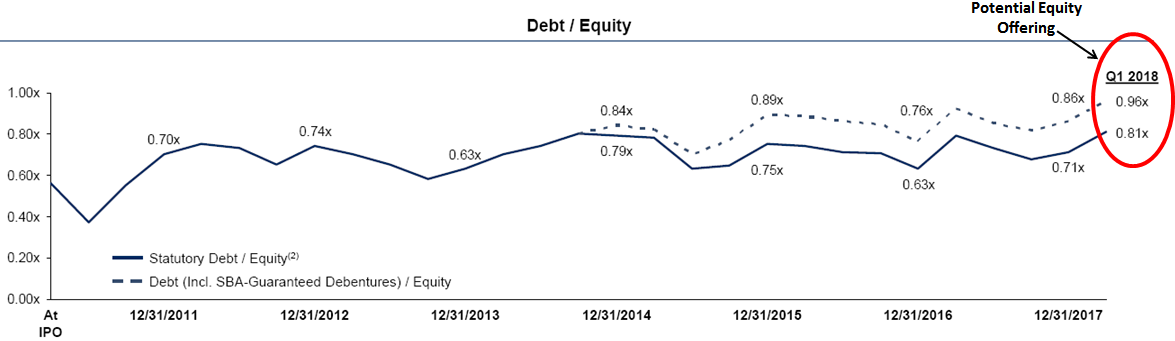
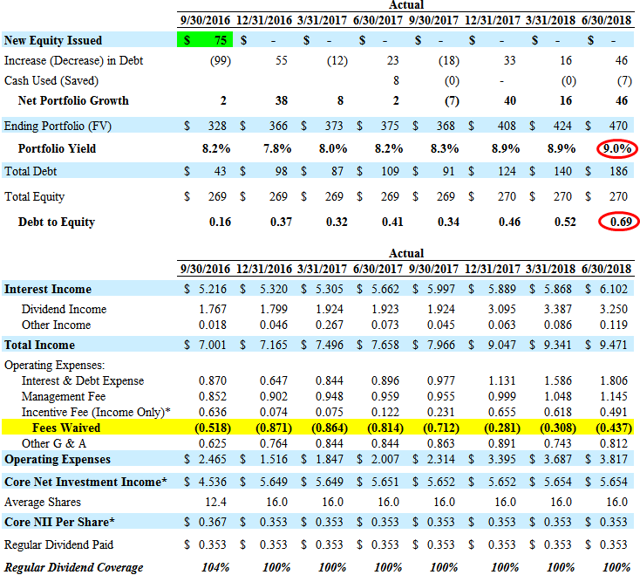
  • NAV remained stable, portfolio growth was higher-than-expected increasing leverage to 0.69 and portfolio yield increased mostly due to North Mill Capital.
  • Its first-lien investment in PPT Management Holdings, was added to non-accrual status with a cost of $7.8 million and fair value of $7.1 million (1.5% of the portfolio FV).


The following is a quick update that was previously provided to subscribers of Premium Reports on August 6, 2018. For target prices, dividend coverage and risk profile rankings, credit issues, earnings/dividend projections, quality of management, fee agreements, and my personal positions on all BDCs  (including this one) please see Deep Dive Reports.

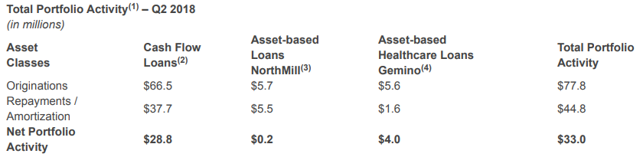
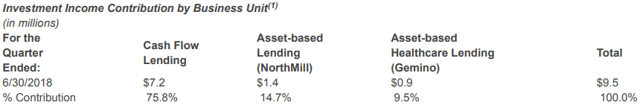
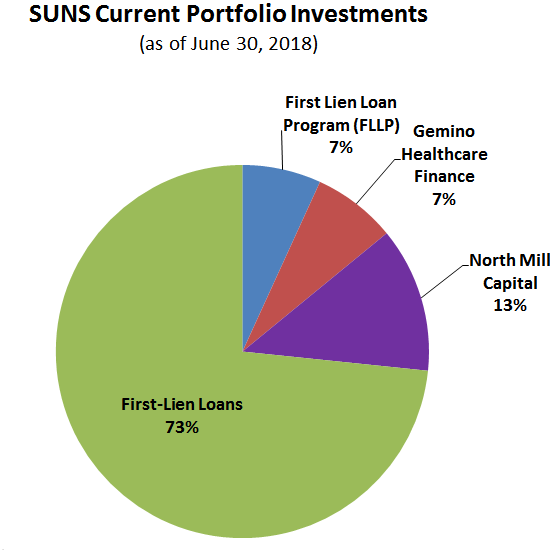
For the quarter ended June 30, 2018, Solar Senior Capital (SUNS) hit my base case projections covering its dividend thanks to continued fee waivers which increased from $0.308 million to $0.437 million as shown in the following table. The portfolio yield increased mostly due to North Mill Capital (“NMC”) that now accounts for 13% of the total portfolio and its weighted average yield increased from 12.9% to 13.3%. Portfolio growth was higher-than-expected and its debt-to-equity increased to 0.69 mostly due to new investments in its first-lien portion of the portfolio.

“We are pleased with Solar Senior Capital’s portfolio growth and operating performance in Q2 2018. Overall, the financial health of our portfolio companies remains sound,” said Michael Gross, Chairman and CEO of Solar Senior Capital Ltd. “Solar Senior’s comprehensive portfolio is predominantly comprised of first lien senior secured loans with floating rate coupons. We believe the Company is well positioned for the current environment and has the sourcing engines across cash flow and asset-based lending niches to drive additional portfolio growth and generate increased investment income.”


On August 2, 2018, the Board approved a reduction in the minimum asset coverage ratio from 200% to 150% effective as of August 2, 2019, unless approved earlier by the shareholders at its 2018 Annual Meeting. On June 1, 2018, its revolving credit facility was refinanced by way of amendment, allowing for an asset coverage ratio of 150%. On July 13, 2018, the credit facility was expanded by $25 million to $225 million. The company will target a range of 1.25x to 1.50x debt-to-equity, operating at a substantial cushion to the regulatory limit. Once the 150% coverage ratio becomes effective, the Company expects to use a modest amount of incremental leverage to continue to invest in its current mix of investments, including senior secured first lien cash flow and senior secured first lien specialty finance asset-based loans.

“Solar Senior Capital’s investment strategy is conducive to operating under the modified asset coverage ratio,” said Michael Gross, Chairman and CEO of Solar Senior Capital. “We believe that the senior secured first lien middle market loan asset class—Solar Senior Capital’s investment focus since inception—can prudently be levered above the previous BDC limits. We view this change as a significant opportunity to generate a greater return on equity for Solar Senior Capital.”

“The increased leverage flexibility will enable us to grow our senior secured first lien asset-based lending businesses and build and/or acquire other commercial finance platforms. We will finance the First Lien Loan Program’s loans directly on balance sheet, which will increase efficiencies and create new investment capacity for non-qualifying assets that, among other things, enables us to expand our specialty finance verticals,” said Bruce Spohler, Chief Operating Officer of Solar Senior Capital. “In summary, the asset coverage modification will enable us to do more of what we’ve been doing: investing in first lien, senior secured cash flow and asset-based loans.”

Its first-lien investment in PPT Management Holdings, LLC was added to non-accrual status during the quarter with a cost of $7.8 million and fair value of $7.1 million (1.5% of the portfolio FV). During the previous quarter, its first-lien investment in Metamorph US 3, LLC was added to non-accrual but was recently exited and responsible for most of the realized losses. However, its net asset value (“NAV”) per share has remained stable over the last two quarters due to markups including North Mill Capital and Gemino. The exit of Metamorph resulted in a decrease of investments with ‘rating 4’ as shown below:


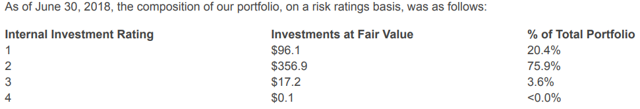
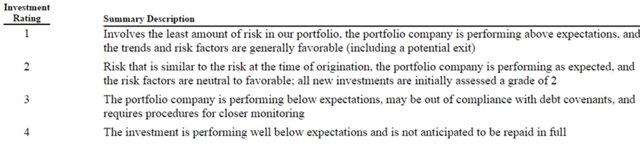
As mentioned in previous reports, there is the potential for an upgrade as the company integrates and grows its recent acquisition/investment in North Mill Capital (“NMC”) as well as ramping its Solar Life Science Program LLC(“LSJV”) and First Lien Loan Program (“FLLP”) providing continued higher returns and overall portfolio yield growth. However, the company remains reliant on fee waivers to cover its dividend and as of June 30, 2018, the LSJV has not commenced operations.


NorthMill LLC

NorthMill currently manages a highly diverse portfolio of directly-originated and underwritten senior-secured commitments. As of June 30, 2018, the portfolio totaled approximately $322,813 of commitments, of which $162,983 were funded, on total assets of $188,189. At June 30, 2018, the portfolio consisted of 91 issuers with an average balance of approximately $1,791 versus 92 issuers with an average balance of approximately $1,600 at December 31, 2017. NMC has a senior credit facility with a bank lending group for $160,000 which expires on October 20, 2020. Borrowings are secured by substantially all of NMC’s assets. For the three months ended June 30, 2018, NMC had net income of $591 on gross income of $5,361. For the six months ended June 30, 2018, NMC had net income of $1,531 on gross income of $10,253.

Solar Life Science Lending

On February 22, 2017, Solar Senior Capital and its affiliates announced the formation of the Solar Life Science Program LLC (“LSJV”). LSJV is expected to invest the majority of its assets in first lien loans to publicly-traded companies in the U.S. life science industry. Solar Senior Capital has committed $75 million of equity to the joint venture. The joint venture has established a pipeline of investment opportunities to effectuate the ramping of LSJV’s investment portfolio. As of June 30, 2018, LSJV has not commenced operations.

Gemino Healthcare Finance LLC

As of June 30, 2018, the portfolio totaled approximately $173,588 of commitments, of which $111,334 were funded, on total assets of $106,357. At June 30, 2018, the portfolio consisted of 29 issuers with an average balance of approximately $3,839 versus 29 issuers with an average balance of approximately $3,677 at December 31, 2017. All of the commitments in Gemino’s portfolio are floating-rate, senior-secured, cash-pay loans. Gemino’s credit facility, which is non-recourse to us, had approximately $73,000 and $75,000 of borrowings outstanding at June 30, 2018 and December 31, 2017, respectively. For the three months ended June 30, 2018 and 2017, Gemino had net income of $668 and $655, respectively, on gross income of $2,745 and $2,760, respectively. For the six months ended June 30, 2018 and 2017, Gemino had net income of $1,380 and $1,423, respectively, on gross income of $5,464 and $5,611, respectively.

First Lien Loan Program LLC

As of June 30, 2018 and December 31, 2017, FLLP had total assets of $106,312 and $121,791, respectively. For the same periods, FLLP’s portfolio consisted of first lien floating rate senior secured loans to 19 and 23 different borrowers, respectively. For the three months ended June 30, 2018, FLLP invested $2,685 across 3 portfolio companies. For the three months ended June 30, 2017, FLLP invested $3,744 across 6 portfolio companies. Investments sold or prepaid totaled $19,870 for the three months ended June 30, 2018 and $8,626 for the three months ended June 30, 2017. At June 30, 2018 and December 31, 2017, the weighted average yield of FLLP’s portfolio was 7.4% and 7.3%, respectively, measured at fair value and 7.5% and 7.2%, respectively, measured at cost.


GAIN: Initiating Coverage of Potentially Oversold Best Of Breed BDC

Summary

  • Earlier this year, I initiated active coverage of GAIN (8.2% yield) and its preferred stocks GAINM (6.2% yield) and now its newly issued GAINL (6.3% yield).
  • GAIN continues to focus on equity participation primarily responsible for growing its NAV per share and “recurring non-recurring” dividend income, that contribute to the growing amount of undistributed NII.
  • Monthly dividends are mostly supported by interest and fee income from debt investments while semiannual dividends are generally supported by capital gains and dividend income from equity investments.
  • As of today, GAIN is likely “oversold”, and I have recently purchased shares of GAINL for many reasons, including some discussed in this article.

You can read the full article at the following link:

Gladstone Investment

Earlier this year, I initiated active coverage of Gladstone Investment (GAIN) and its preferred stocks (GAINM) and the recently issued (NASDAQ:GAINL). As shown below, GAIN continues to outperform the S&P 500, UBS ETRACS Business Development Company ETN (NYSEARCA:BDCS) and UBS ETRACS 2X Leveraged Business Development Company ETN (NYSEARCA:BDCL). However, as mentioned in “14.5% Yielding ETN: Time To Buy Or Take Profits?” BDCL and BDCS should not be used as a longer-term investment for the BDC sector as they continually underperform the sector even after including distributions.

Please see the end of the is article for reasons to buy GAIN, including recently approached “oversold” conditions.

Reasons to Purchase GAIN

GAIN continues to focus on equity participation which is primarily responsible for growing its NAV per share and “recurring non-recurring” dividend income that contribute to the growing amount of undistributed spillover income used to support continued semiannual dividends. Currently, around 11% of GAIN’s distributions for 2018 are considered capital gains and will likely have favorable tax treatment.

GAIN will likely earn at least $0.20 per share each quarter covering 101% of its monthly dividend driven by its an annual hurdle rate of 7% on equity before paying incentive fees to management.

The company recently reduced its borrowing rates and is positioning the balance sheet to support higher leverage and hopefully returns to shareholders.

However, given the recent increase in non-accruals, I will likely be waiting until after the company reports calendar Q3 2018 earnings (est. November 1, 2018) before making additional purchases.

GAIN’s relative strength index (“RSI”) has dipped under 30 today (currently 27) indicating potentially oversold conditions and historically a buying point as shown in the following chart:

CGBD: Approaching Oversold Conditions Driving 9% Yield

Summary

  • I recently purchased additional shares of this higher quality BDC that is trading 6% below book value paying a 9.0% dividend yield with an upcoming special dividend in Q4.
  • There is the potential for special dividends or a dividend increase for multiple reasons including recent shareholder approval to increase leverage, rising rates and portfolio yield, and ramp of its Credit Fund.
  • This article also provides an update to CGBD’s portfolio credit quality including Hydrofarm and PPT Management potentially being added to non-accrual status.

You can read the full article at the following link:


When to Buy BDCL?

I closely watch the yield spreads between BDCs and other investments including the ‘BofA Merrill Lynch US Corporate B Index’ (Corp B). Yield spreads are important to monitor as they can indicate when a basket of investments is overbought or oversold compared to other yield-related investments. However, general market yields can change at any time. Also, spreads change depending on perception of risk and these are only averages that then need to be assigned a range for assessing individual investments/BDCs. BDCs can be volatile and timing is everything for investors that want to get the “biggest bang for their buck” but still have a higher quality portfolio that will deliver consistent returns over the long-term.

The following chart uses the information from the previous chart showing the average yield spread between BDCs and Corp B. I consider BDCs oversold when the yield spread approaches 4.5% higher and overbought when it is closer to 2.5%. This would imply that BDCs are currently priced appropriately relative to Corp B debt yields as the current yield spread is almost 3.5% (the difference between 9.85% for BDCs and 6.40% for Corp B).

BDCL typically under-performs due to fees and index allocations but can be a good investment if timed correctly as shown below:

PNNT: 9.3% Yield And Recent Rally From Rising Book Value

Summary

  • PNNT has rallied 15% since my previous article predicting that the company would report increased book value/NAV per share due to rebounding oil prices and accretive share repurchases.
  • NAV per share increased by 1.0% (from $9.00 to $9.09) partially due to accretive share repurchases and net realized/unrealized gains of over $5.1 million.
  • PNNT is actively repurchasing shares, including almost 1.1 million (1.5% of outstanding shares) at a weighted average price of $7.27 or 19.2% discount to previous NAV.
  • Accretive share repurchases should improve earnings/NII per share along with portfolio growth and use of leverage, as well as monetizing its equity investments and increased LIBOR that could result in a dividend increase.

You can read the full article at the following link:

As shown in the following chart, PennantPark Investment (PNNT) has rallied 15% since my previous article “PNNT: Higher Oil Prices And Interest Rates Driving Higher Returns For This 11% Yielding BDC“. Among other things, the article predicted that the company would report increased net asset value (“NAV”) per share due to rebounding oil prices and accretive share repurchases.

FDUS: 10.6% Yielding BDC Trading Below Book Value

Summary

  • FDUS has outperformed most BDCs when it comes to NAV per share growth, but declined during the recent quarter with realized losses mostly due to the exits of two investments.
  • FDUS is for higher risk investors (looking for higher yields) and does not fit my personal risk profile due to its portfolio of mostly second-lien/subordinated debt and equity investments.
  • However, these investments are responsible for most of the historical realized gains, NAV per share growth, and special dividends.
  • The stock is likely under-priced and trading 9% below book value, giving it a current regular dividend yield of 10.6% (before specials).

You can read the full article at the following link:

AINV: 10.6% Dividend Yield With Potential Book Value Upside From Oil Hedges

Summary

  • As predicted in the previous article, AINV’s NAV per share declined due to $23 million in realized losses including its hedges as oil prices headed higher and ‘legacy’ investments.
  • However, 80% of the total portfolio is now considered to be invested in its “core strategies” with 55% in first-lien and no new non-accruals.
  • Recent investments were at lower yields and likely to support “the increase in our regulatory leverage which will become effective April 2019”.
  • Management is already working with and positioning borrowers for increased leverage and will likely be in place well-before April 2019.
  • The company repurchased another 1.4 million shares during the recent quarter.

You can read the full article at the following link:

Current BDC Dividend Yields

Business development companies (“BDCs”) are currently paying dividend yields between 7% and 13% with a handful of companies that increased dividends so far this year including Ares Capital (ARCC) and Main Street Capital (MAIN) as predicted in “This High-Yielding, Sleep-Well Investment Is About To Announce A Dividend Increase“.

MRCC: Credit Issues Need To Be Watched

Summary

  • MRCC reports Q2 2018 results this week and this article discusses what investors should be looking for, including signs of improvement in two of its portfolio investments.
  • MRCC is my smallest positions as I have not been purchasing additional shares.
  • In June 2018, MRCC held its annual meeting and shareholders approved the company becoming subject to a minimum asset coverage ratio of 150%, permitting the company to double its leverage.
  • MRCC’s portfolio remains primarily of first-lien loans, representing around 86% of the portfolio as of March 31, 2018, which is generally favorable when considering higher use of leverage.

You can read the full article at the following link:

Recent MRCC Stock Performance

Monroe Capital (MRCC) is my smallest positions as I will not be purchasing additional shares “until there are signs of improvement or at least stabilization of its investments in Rockdale Blackhawk, LLC and TPP Operating, Inc.” as discussed in this article.

MRCC’s stock rallied from $12.80 to $14.50 after my previous public article (linked below) as shown in the following chart and its relative strength index (“RSI”) is currently at 30 indicating ‘oversold’ conditions:

Copyright © 2018-2025 BDC BUZZ All rights reserved.