Previous Quick Market Update:
The following is a quick update that was previously provided to subscribers of Premium Reports along with target prices, dividend coverage and risk profile rankings, credit issues, earnings/dividend projections, quality of management, fee agreements, and my personal positions on all business development companies (“BDCs”) please see Deep Dive Reports.
Quick BDC Market Update:
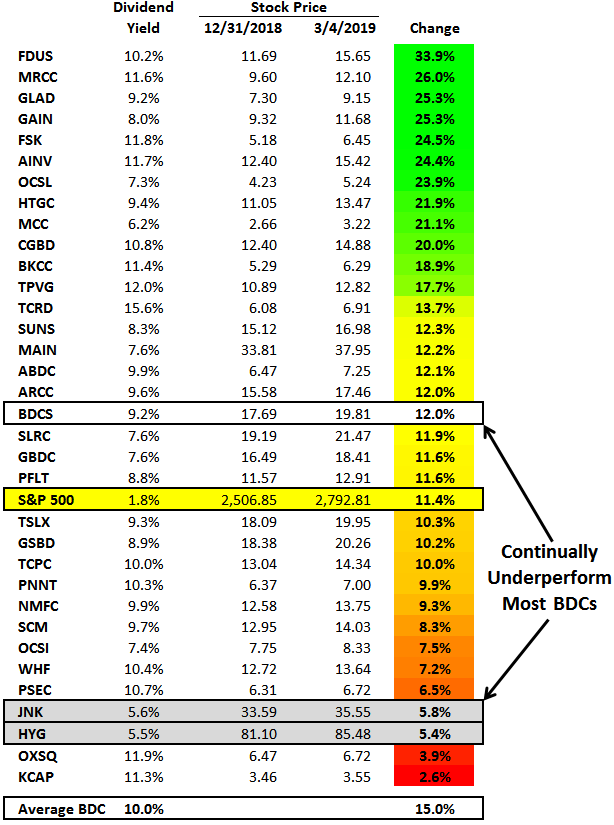
- As predicted in previous updates, BDC prices have rebounded strongly in 2019 with the average BDC up 15% as compared to the S&P 500 up 11%.
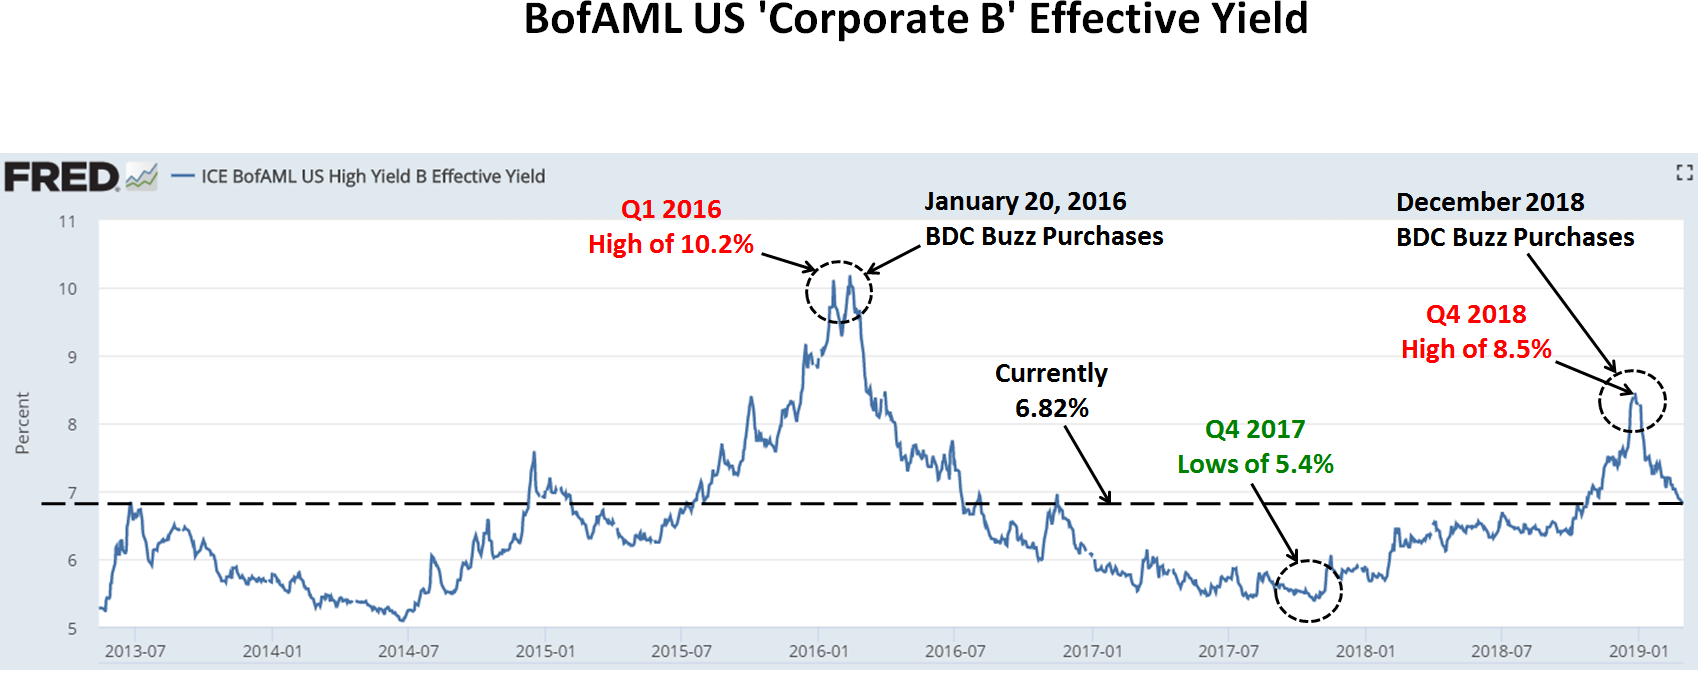
- I closely watch the yield spreads between BDCs and other investments including the ‘BofA Merrill Lynch US Corporate B Index’ (Corp B) that recently increased from 6.36% on October 1, 2018, to 8.45% on December 26, 2018.
- However, these yields have been declining in 2019 and are currently around 6.82%.
- The average BDC dividend yield is almost 10.4% and 3.6% higher than Corp B implying neither oversold or overbought conditions.
- There is a chance for lower BDC prices potentially due to another ‘flight to safety’ and retail investor fear-related selling when they should be holding or buying.
- I’m closely watching various economic and BDC fundamentals as well as ‘Corp B’ effective yield spreads looking for oversold conditions. This update outlines the two most likely general market scenarios and my potential purchase plans over the coming weeks.
- BDC fundamentals remain strong including a healthy U.S. economy, low market defaults and most BDCs focused on protecting shareholder capital with first-lien assets with protective covenants as discussed in many Deep Dive
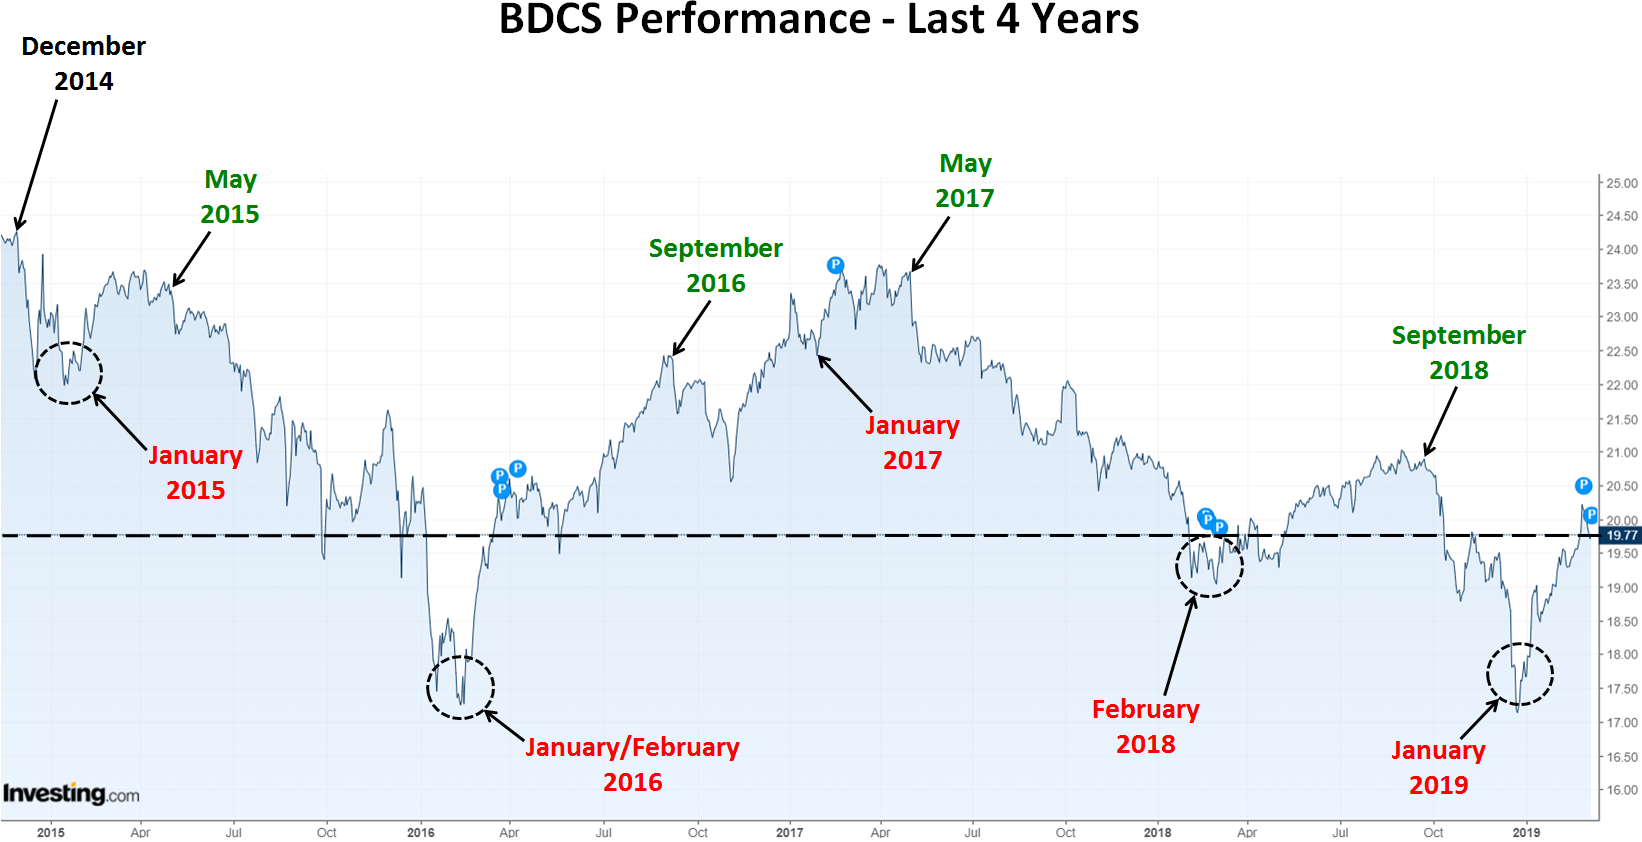
Business Development Companies (“BDCs”) were down sharply through December 31, 2018, likely due to final tax-loss harvesting and/or year-end position changes in various investment funds. As predicted and shown in the chart below, “BDCS” has rebounded from the recent lows. During previous years, the average BDC stock price typically declined from December through January/February and then rallied through May/September.
As predicted in the previous updates, most BDCs have been outperforming the S&P 500 so far in 2019, but still, have an average dividend yield of around 10%. The average BDC continually outperforms high-yield corporate bond ETFs such as the iShares iBoxx $ High Yield Corporate Bond ETF (HYG) and the SPDR Bloomberg Barclays High Yield Bond ETF (JNK), and UBS ETRACS Wells Fargo Business Development Company ETN (BDCS). It should also be noted that the following table does not take into account returns from dividends paid.
BDC pricing is closely correlated to yield spreads including other non-investment grade debt and ‘BofA Merrill Lynch US Corporate B Index’ (Corp B). As shown in the chart below, I typically make multiple purchases when Corp B effective yields rise including January/February 2016, when the markets experienced concerns of slowing Chinese growth and increased energy sector defaults driving higher yield expectations, especially for non-investment grade debt. Also shown in the chart below, is the recent pullback in Corp B yields which is/was driving higher BDC pricing this year.
2019 BDC Buzz Plan:
The S&P 500 is still around 5% below its previous highs for various reasons, some of which are related to BDCs (including a potential economic slowdown), but the underlying fundamentals of the U.S. economy and BDCs remain strong.
There is a chance for lower BDC prices potentially due to returned flight to safety and fear-related selling when investors should be holding or buying. I believe that the following are the two most likely general market scenarios and what I will be doing in each case:
- Continued/additional positive news regarding interest rate policy, U.S. and world economy driving a full rebound beyond previous levels where I will be making meaningful purchases on the way back up.
- BDC prices continue to rebound or at least remain higher through May or even as late as September and then back down through December/January. In this scenario, I will be making select purchases of underpriced BDCs and then waiting to make meaningful purchases.
As discussed in the BDC Risk Profiles Rankings report, most BDCs have built their portfolios and balance sheets in anticipation of a recession with investments supported by high cash flow multiples and protected by protective covenants and first-lien on assets for worst case scenarios.
The following comment is from the recent ARCC call: “As we look at the portfolio and evaluate the economy, we continue to approach the market with the belief that we are late in a credit cycle, and that economic growth is slowing. As a lender, these are perfectly healthy conditions for underwriting and strong portfolio performance. However, we do believe that slowing economic growth can challenge weaker companies. And if this thesis proves itself out it should benefit Ares Capital as more differentiation among credit managers is a good thing for established companies like ours which has resources and access to capital that surpasses our peers. A more fundamental credit downturn can be a significant market opportunity for us. We have been able to consolidate market share during times of distress, and outperform other credit managers. And we’re positioning ourselves to take advantage of this if an opportunity arises.”
Are BDCs Overbought or Oversold?
Yield spreads are important to monitor as they can indicate when a basket of investments is overbought or oversold compared to other yield-related investments. However, general market yields can change at any time. Also, spreads change depending on the perception of risk and these are only averages that then need to be assigned a range for assessing individual investments/BDCs. BDCs can be volatile and timing is everything for investors that want to get the “biggest bang for their buck” but still have a higher quality portfolio that will deliver consistent returns over the long-term.
I closely watch the yield spreads between BDCs and other investments including the ‘BofA Merrill Lynch US Corporate B Index’ (Corp B) that recently increased from 6.36% on October 1, 2018, to 8.45% on December 26, 2018. However, as discussed earlier, these yields have been declining in 2019 and are currently around 6.82%. This is meaningful for many reasons but mostly due to indicating higher (or lower) yields expected by investors for non-investment grade debt that will likely result in higher portfolio yields over the coming quarters.
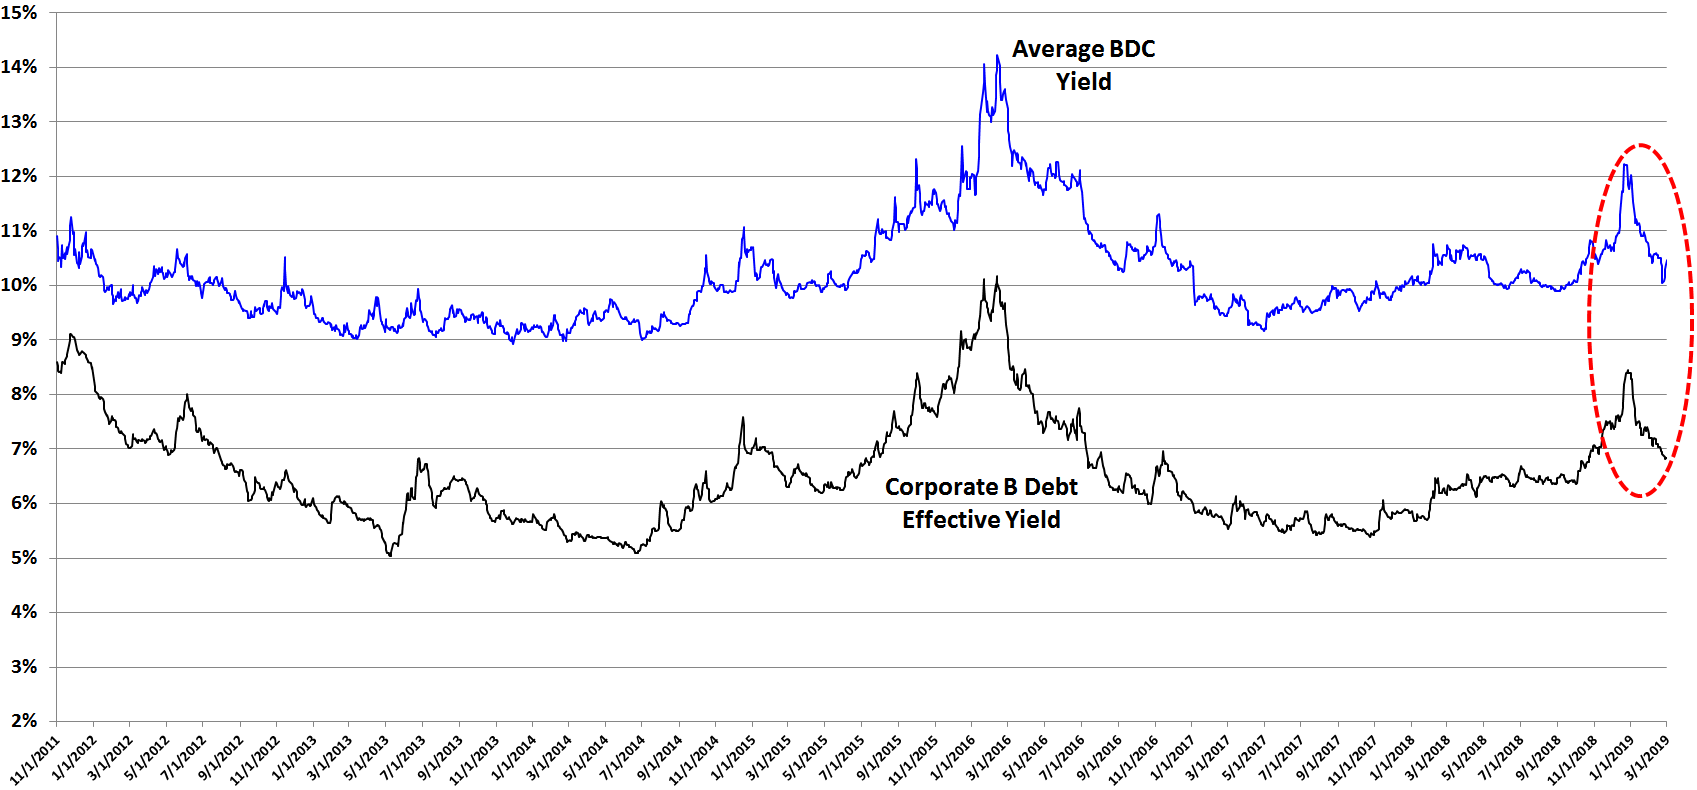
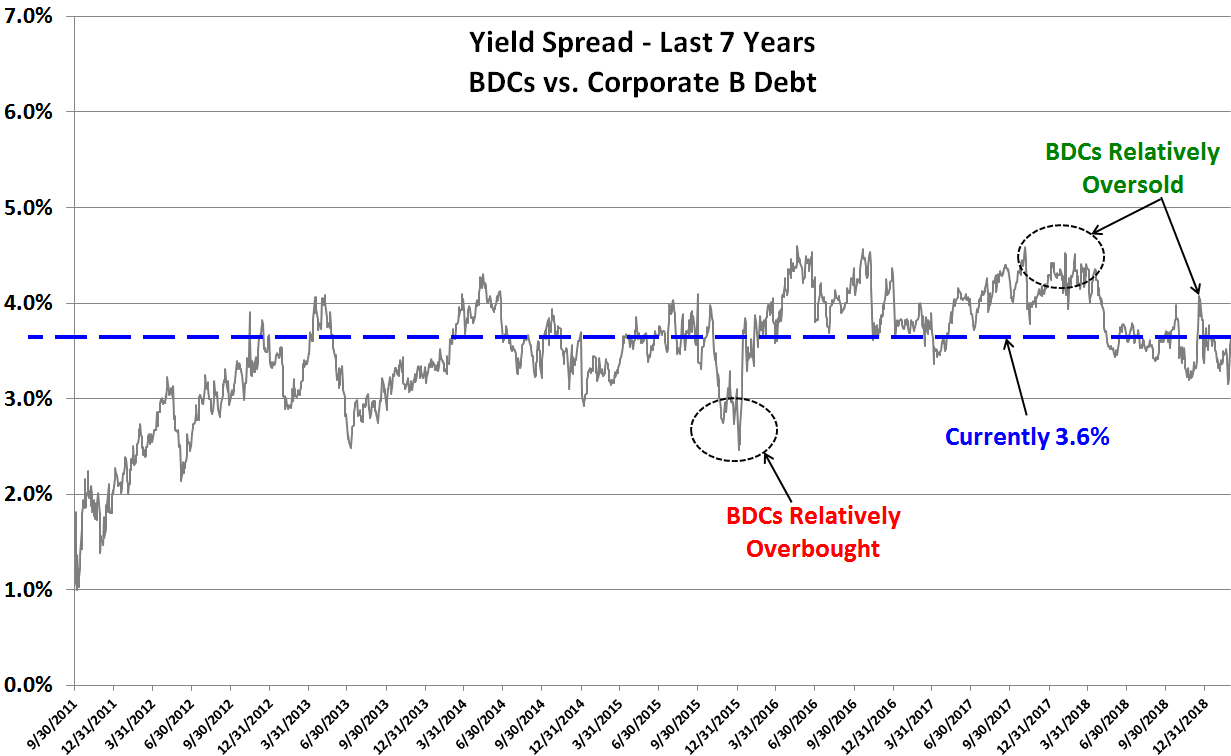
The following chart uses the information from the previous chart showing the average yield spread between BDCs and Corp B. I consider BDCs oversold when the yield spread is 4.0% higher and overbought when it is 3.0% lower. As shown in the chart below, BDCs are appropriately priced which is confirmed by the average RSI discussed earlier. The average BDC is currently yielding around 10.4% compared to Corp B at 6.8% for a current yield spread of 3.6%.
Analyzing BDCs:
For BDC target prices, dividend coverage and risk profile rankings, credit issues, earnings/dividend projections, quality of management, fee agreements, and my personal positions on all BDCs please see Premium Reports.