The following is from the FSK Update that was previously provided to subscribers of Premium BDC Reports along with revised target prices, dividend coverage and risk profile rankings, potential credit issues, earnings/dividend projections, quality of management, fee agreements, and my personal positions for all business development companies (“BDCs”).

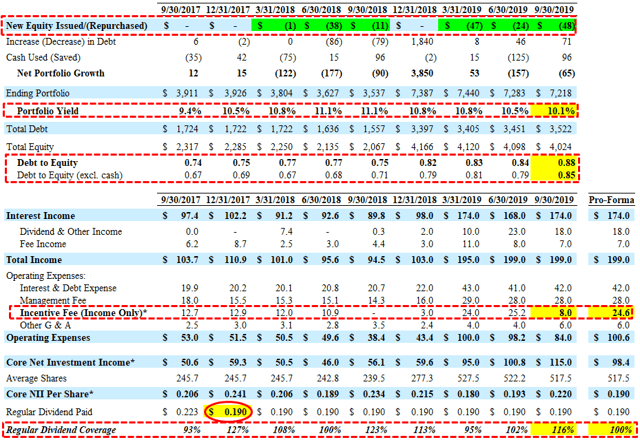
FS KKR Capital Corp. (FSK) reported just above its base case projections but only due to materially lower incentive fees paid driven by the ‘total return’ hurdle and continued unrealized losses (discussed later). As shown in the following table, FSK would have earned $0.19 per share if the full incentive fees were paid.
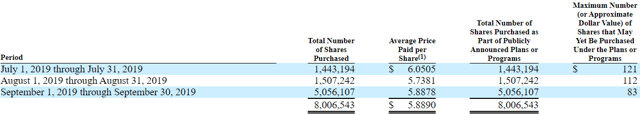
FSK continues to increase its use of leverage mostly due to share repurchases but also impacted by the previous NAV declines. During Q3 2019, the company repurchased another 8 million shares at an average price of $5.95 (24% discount to NAV).
Michael Forman, Chairman and CEO. “We delivered solid financial results in the third quarter. Our strong origination activity resulted in further diversification of our investment portfolio. We also meaningfully expanded our joint venture, and we continued taking steps to strengthen our capital structure. As we move forward, I’m excited by the leadership team we have assembled and believe we are well-positioned.”
In December 2018, FSK’s board of directors authorized a $200 million stock repurchase program. During the nine months ended September 30, 2019, the company repurchased 19,216,367 shares at an average price per share (inclusive of commissions paid) of $6.11 (totaling $118 million). So far in Q4 2019, the company has already repurchased another 3,189,687 shares at an average price per share (inclusive of commissions paid) of $5.78 (totaling $18 million). Additional repurchases could be limited due to approaching its revised targeted leverage but funded through rotating out of portfolio assets.
—————–
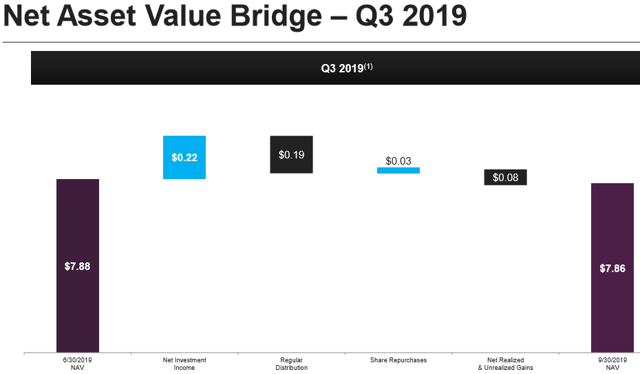
Previously, FSK was downgraded to a ‘Tier 3’ from an overall ranking and pricing standpoint (but remained a ‘Level 2’ dividend coverage implying a stable dividend) due to continued credit issues. FSK’s Board has declared a regular cash distribution for Q4 2019 of $0.19 per share, paid January 2, 2020 to stockholders of record as of the close of business on December 18, 2019. During Q3 2019, NAV per share decreased by $0.02 or 0.3% (from $7.88 to $7.86) due to $0.08 per share of net realized/unrealized losses mostly offset over-earning the dividend and share repurchases:
—————–
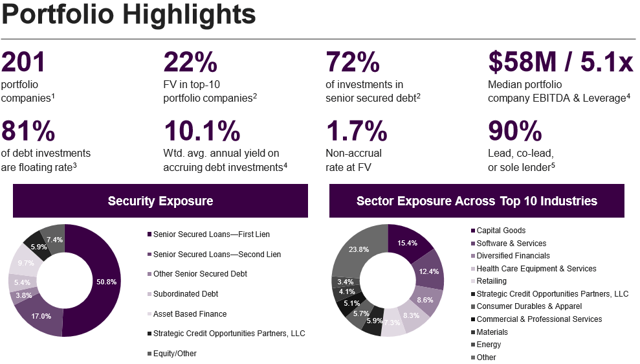
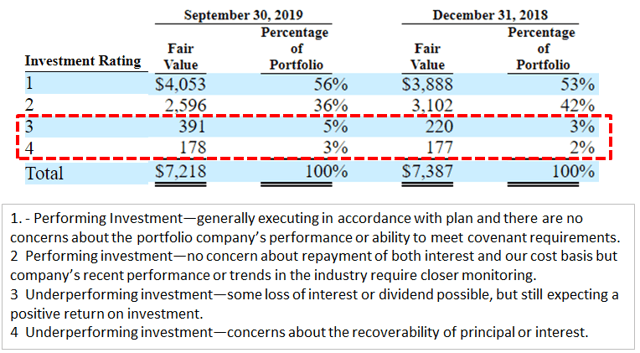
Total non-accruals increased from 1.2% to 1.7% of the portfolio based on fair value due to adding Bellatrix Exploration Ltd, AVF Parent LLC, and Acosta Holdco and will be discussed in the updated FSK Deep Dive report. Also, still on non-accrual are the previously discussed energy and retail-related investments including Hilding Anders, Rockport (Relay), Advanced Lighting Technologies Inc., Petroplex Acidizing Inc, AltEn, LLC, and HM Dunn Co. There has been a $171 million increase in the amount of investments in ‘Investment Rating 3’ implying “Underperforming investment some loss of interest or dividend possible, but still expecting a positive return on investment” and needs to be watched.
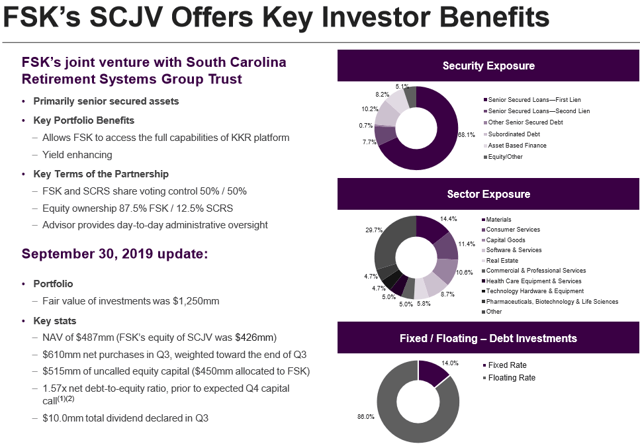
As mentioned in previous reports, there is the possibility for improved dividend coverage through its Strategic Credit Opportunities Partners (“SCJV”).
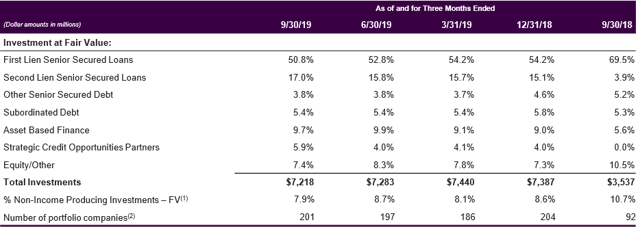
Also, management has been working to reduce the amount of non-income producing equity investments that is now 7.9% of the portfolio (partially due to markdowns in equity investments). However, the amount of first-lien declined from 70% to 51% mostly due to combining the portfolios of FSIC and CCT:
This information was previously made available to subscribers of Premium BDC Reports, along with:
- FSK target prices and buying points
- FSK risk profile, potential credit issues, and overall rankings
- FSK dividend coverage projections and worst-case scenarios
- Real-time changes to my personal portfolio
To be a successful BDC investor:
- As companies report results, closely monitor dividend coverage potential and portfolio credit quality.
- Identify BDCs that fit your risk profile.
- Establish appropriate price targets based on relative risk and returns (mostly from regular and potential special dividends).
- Diversify your BDC portfolio with at least five companies. There are around 50 publicly traded BDCs; please be selective.