The following information was previously provided to subscribers of Premium BDC Reports along with revised target prices, dividend coverage and risk profile rankings, potential credit issues, earnings/dividend projections, quality of management, fee agreements, and my personal positions for all business development companies (“BDCs”).
- The following is a portion of a public article that will be published soon discussing HTGC, TPVG, and HRZN.
- I currently do not cover HRZN for the reasons discussed in this update.
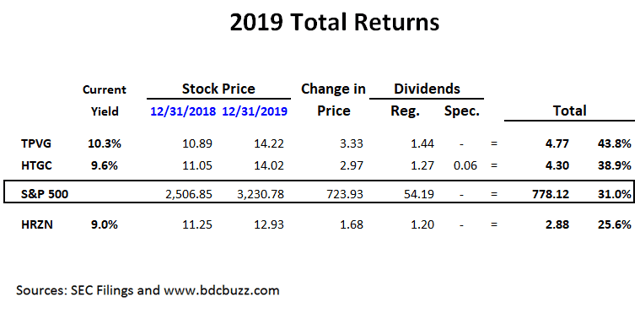
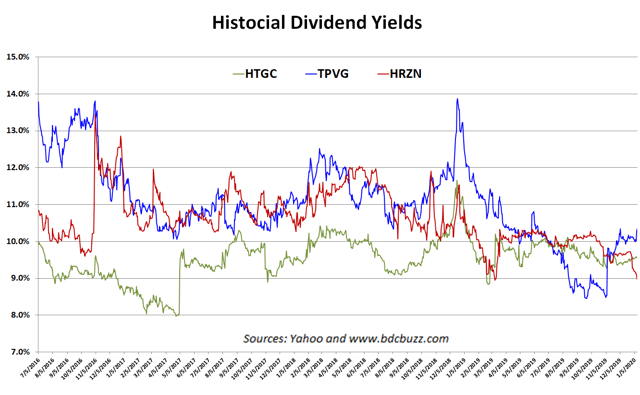
Hercules Capital (HTGC), TriplePoint Venture Growth (TPVG) and Horizon Technology Finance (HRZN) provide capital to venture capital (“VC”) backed technology and high growth companies paying dividend yields of 9% to 10%.

HTGC is the leading and largest specialty finance company focused on providing senior secured venture growth loans to high-growth, innovative venture capital-backed companies in a broad variety of technology, life sciences, and sustainable and renewable technology industries.
Source: HTGC Website

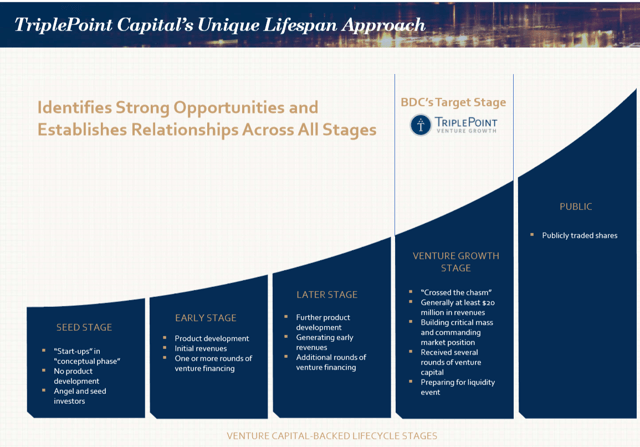
TPVG is the leading global provider of financing across all stages of development to technology, life sciences and other high growth companies backed by a select group of venture capital firms.
Source: TPVG Website

HRZN is a leading specialty finance company that provides capital in the form of secured loans to venture capital-backed companies in the technology, life science, healthcare information and services, and sustainability industries
Source: HRZN Website
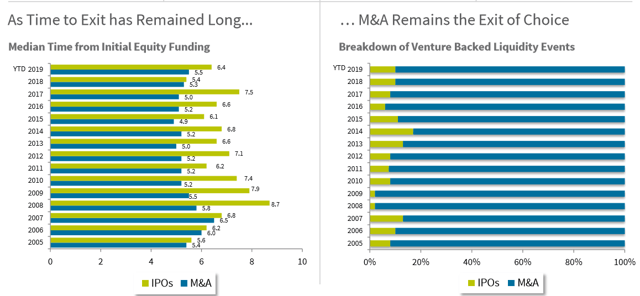
Source: TPVG Investor Presentation
Why Would Venture-Backed Companies Use Venture Debt?
- Less dilutive than new VC round
- Lengthens time before next equity round
- Provides negotiating leverage for higher valuations
- Leverages returns for equity investors
Source: HTGC Investor Presentation
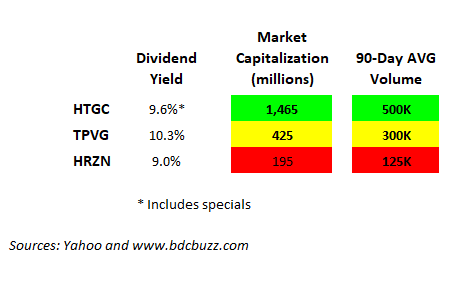
Dividend Yield, Market Cap, & Trading Volumes
I typically cover larger BDCs with adequate trading volumes as the sector can be volatile with meaningful swings during markets ‘flight to safety’. Larger investors prefer having liquidity especially when BDCs report ‘good’ or ‘bad’ results so that they can take advantage of the timing of trades etc. In a down market, you do not want to be holding a smaller BDC. Also, larger companies typically have more institutional investors that can drive management to do the right thing at times.
Quality of Management
This is likely the most important part of BDC analysis as management is responsible for building a portfolio to deliver returns to shareholders while protecting the capital invested. BDC management controls all the levers including the quality of the origination/credit platform, managing the capital structure with appropriate leverage, meaningful share repurchases, accretive equity offerings, and dividend policy, creating an efficient operating cost structure and willingness to “do the right thing” by waiving management fees or having a best in class fee structure that protects returns to shareholders. I’m not going to get into all of the details for each BDC here as it would be an entire article for each company.
The following table ranks each company by the amount or regular dividends paid annually divided by the current book value or net asset value (“NAV”):
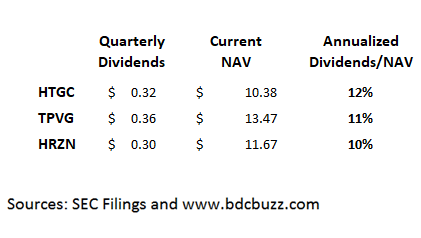
HTGC is obviously the winner with an internally-managed structure driving increased dividends and NAV per share with continued accretive equity offerings. TPVG is externally-managed with a stable dividend and pays specials when they can as well as equity offerings that are less accretive but the company uses the proceeds quickly.
HRZN is an outlier in the BDC sector and is one of the few BDCs that has issued shares below NAV as well as the previously discussed dividend cuts and the 33% decline in NAV per share. On March 24, 2015, HRZN completed a follow-on public equity offering of 2 million shares for net proceeds of $26.7 million or $13.35 per share which was 7% below its NAV per share of $14.36.
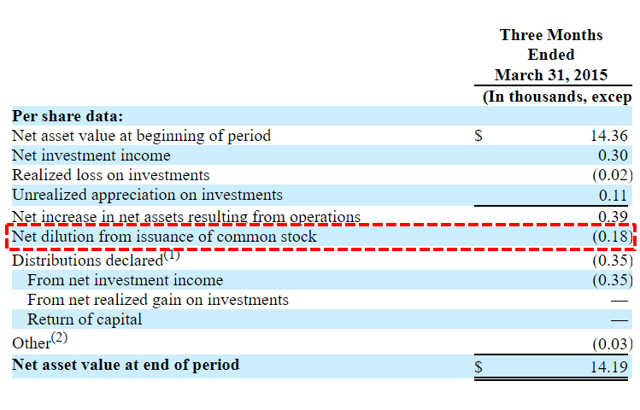
Source: HRZN SEC Filing
I do not like to point out that there have been bad actors (including MCC and PSEC) that have done this in the past because shareholders are reluctant to vote for giving this option to the management of quality BDCs that might need simply to lower borrowing rates on facilities.
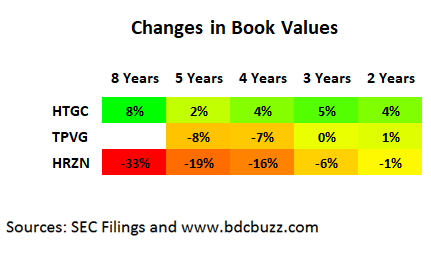
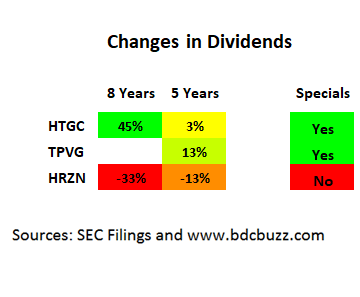
Historical Changes in Book Values & Dividends
As discussed in previous articles, changes in book value or net asset value (“NAV”) per share are not always a clear indicator of historical credit issues because there are many items that impact NAV including over or underpaying the dividend, equity issuances and general changes in values for assets and liabilities (borrowings). It is also important to recognize the difference between “realized” and “unrealized” gains and losses. BDCs that have recently cut dividends due to credit issues likely had larger amounts of realized losses from investments sold or written off. Many higher quality BDCs have had previous NAV per share declines mostly related to unrealized losses and conservatively marking assets down to reflect general market pricing rather than changes to credit quality. However, if you use a longer-term when measuring changes it becomes a more meaningful measure. Clearly, HTGC is the winner in this category. However, I am expecting a decline in TPVG’s NAV per share of around $0.18 due to Harvest Power, Inc. and publicly traded equity positions.
HRZN has cut its dividend twice and does not pay special dividends.
Conclusion and Recommendations
Historically, investors paid a premium for HTGC driving a lower yield but TPVG was overpriced last month at $17 temporarily driving its yield lower but has come back a bit for various reasons. HRZN’s yield has averaged around 10.6% but is currently 9.0% and likely overbought as discussed next.
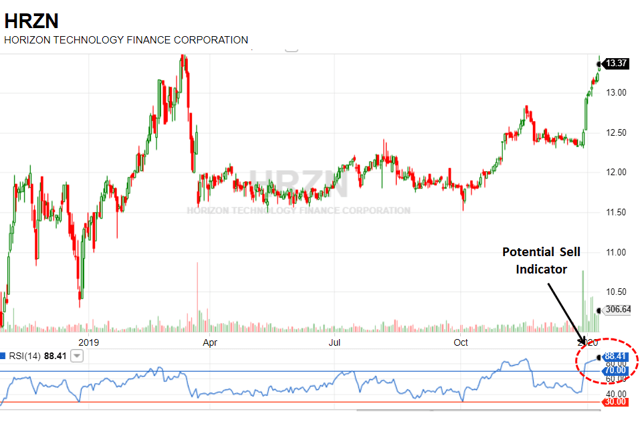
HRZN’s price has recently shot up driving its Relative Strength Index or RSI which is an indicator that I use after I already know which BDC I would like to purchase, but waiting for a good entry point. This is the definition from Investopedia:
The relative strength index (RSI) is a momentum indicator developed by noted technical analyst Welles Wilder, that compares the magnitude of recent gains and losses over a specified time period to measure speed and change of price movements of a security. It is primarily used to attempt to identify overbought or oversold conditions in the trading of an asset. Traditional interpretation and usage of the RSI is that RSI values of 70 or above indicate that a security is becoming overbought or overvalued, and therefore may be primed for a trend reversal or corrective pullback in price. On the other side of RSI values, an RSI reading of 30 or below is commonly interpreted as indicating an oversold or undervalued condition that may signal a trend change or corrective price reversal to the upside.”
HRZN’s RSI is currently over 88 as shown below compared to HTGC near 46 and TPVG near 35.
I recently had to lower my projections for TPVG due to updated information included in the SEC filings associated with the recent equity offering but I’m still expecting dividend coverage of around 105% for Q4. I’m assuming that other analysts will revise their estimates lower before the company reports results next month so there could be lower prices coming. Analysts (not me) are expecting HRZN to cover its dividend by 103% for Q4.
If you want to increase your exposure to one of these companies, I would choose HTGC as the safer higher quality internally-managed option. HTGC’s pricing is not ideal but adequate for a starter position and purchase additional shares during any pullbacks (which are likely coming). TPVG is more favorably priced but due to the previously discussed reasons. HRZN has had a nice run and hopefully, management has learned from past mistakes.
This information was previously made available to subscribers of Premium BDC Reports, along with:
- HTGC and TPVG target prices and buying points
- HTGC and TPVG risk profile, potential credit issues, and overall rankings
- HTGC and TPVG dividend coverage projections and worst-case scenarios
- Real-time changes to my personal portfolio
To be a successful BDC investor:
- As companies report results, closely monitor dividend coverage potential and portfolio credit quality.
- Identify BDCs that fit your risk profile.
- Establish appropriate price targets based on relative risk and returns (mostly from regular and potential special dividends).
- Diversify your BDC portfolio with at least five companies. There are around 50 publicly traded BDCs; please be selective.