The following information was previously provided to subscribers of Premium BDC Reports along with:
- FSK target prices/buying points
- FSK risk profile, potential credit issues, and overall rankings
- FSK dividend coverage projections (base, best, worst-case scenarios)
![]()
FSK Summary
- I have updated the projections for FSK to take into account the recently issued unsecured notes, changes to portfolio credit quality, and guidance from management on the recent call.
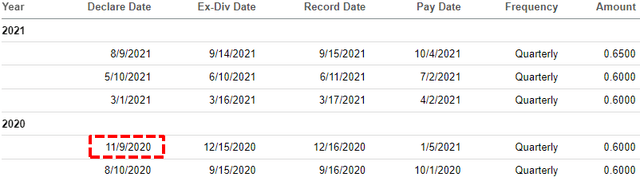
- FSK will announce its Q4 dividend during the second week of November and investors should expect $0.60 which could have an impact on the stock price.
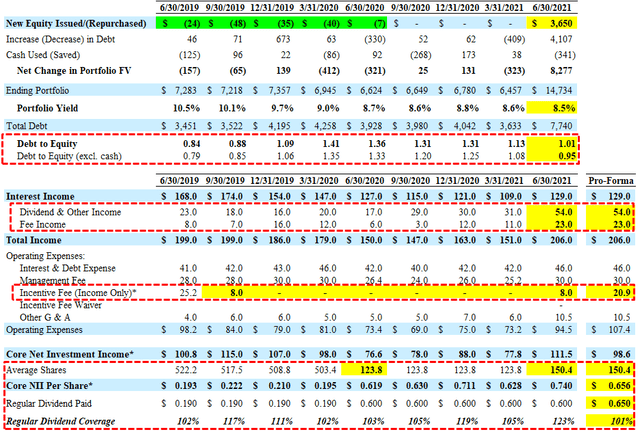
- This is supported by the Leverage Analysis projecting earnings of $0.561/share using a $15 billion portfolio with a stable yield and not including temporary fee waivers contributing $0.05/share.
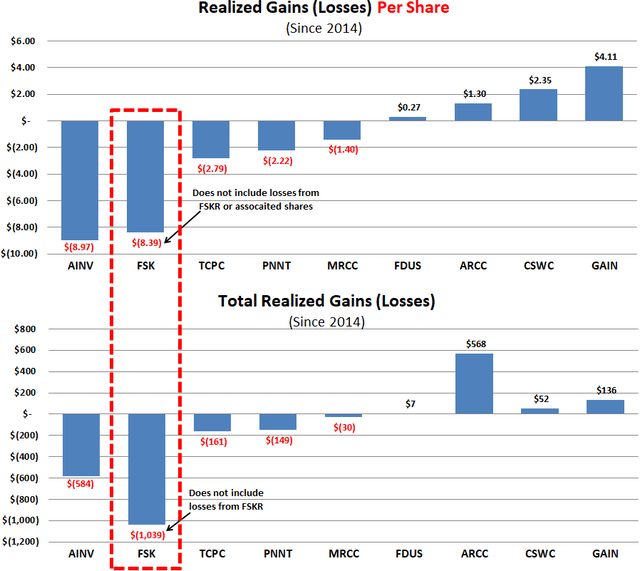
- FSK has experienced over $1 billion in realized losses which does not include in the realized losses from FSKR. This is more than almost every other BDC, especially when measured on a per-share basis as shown below.
- The total amount of investments considered non-accrual, related, or on the ‘watch lists’ accounts for almost $1.3 billion or 8.5% of the portfolio’s fair value. See details below.
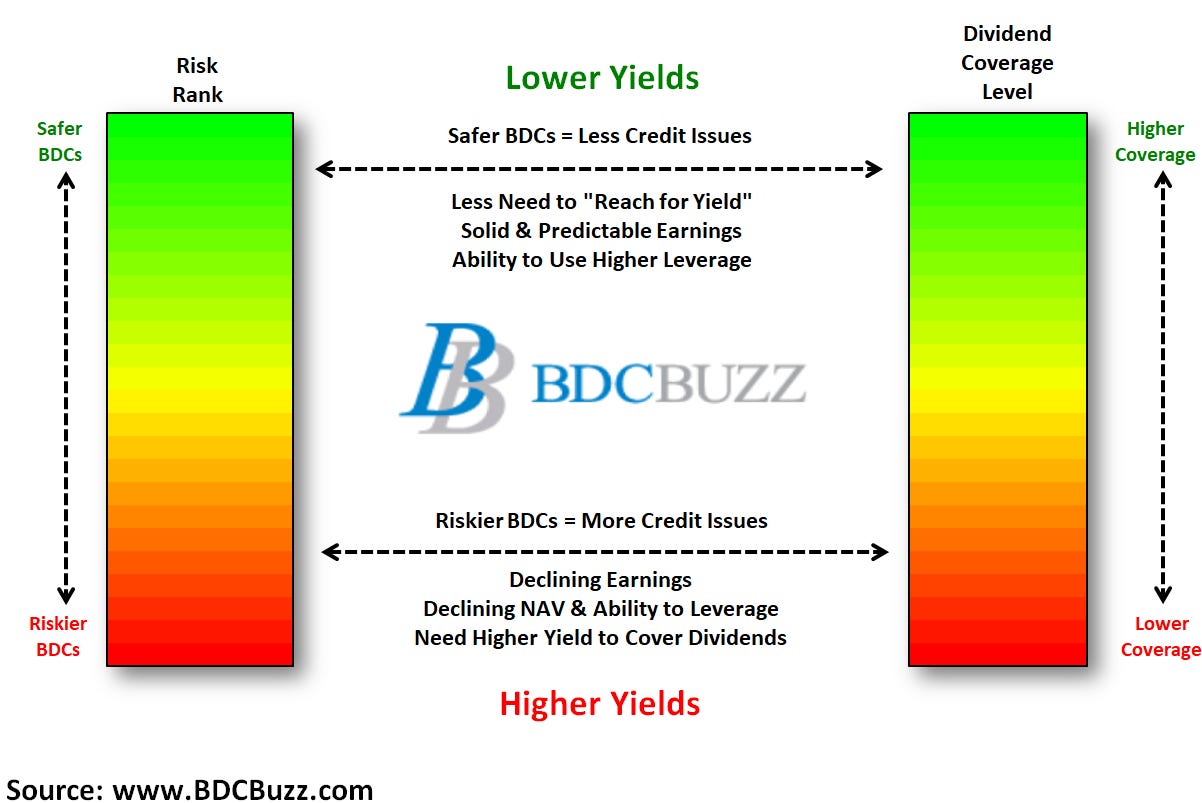
This report discusses FS KKR Capital (FSK) which is considered a higher risk BDC for the reasons discussed in this report including historical NAV declines and realized losses driven by higher cyclical exposure that accounts for around 25% of the total portfolio. The company has many of the same sector exposures in its SCJV which is almost 10% of the portfolio. Also, management has removed the ‘total return’ hurdle or ‘look back’ provision that was previously protecting shareholders from additional capital losses.
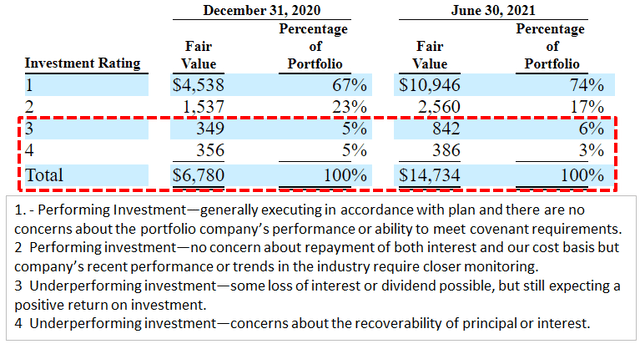
As discussed later, the total amount of investments considered non-accrual or related as well as on the ‘watch list’ account for almost $1.3 billion or 8.5% of the portfolio fair value. This is close to the amount of investments that the company has identified with its ‘Investment Rating’ 3 and 4 which are considered “underperforming investments” with “some loss of interest or dividend possible” and/or “concerns about the recoverability of principal or interest”. These investments have a total cost basis of almost $1.9 billion or 13% of the total portfolio and could result in additional realized losses over the coming quarters. Also, if additional watch list investments are added to non-accruals status this would likely drive additional declines in NAV per share, earnings, and dividend coverage.
FSK announces dividends when it reports financial results which are typically around the second week of November and there will likely be investors disappointed with the lower dividend payment and could impact its stock price. Please see the full discussion below.
Comparison of Realized Gains/Losses & Changes in NAV
Gains or losses are said to be “realized” when an investment is actually sold or exited as compared to “unrealized” gains and losses due to an increase or decrease in the value of an investment that has not yet been sold. When a BDC incurs realized losses there is generally no way to reverse these losses but can potentially be offset by positive performance from other investments and/or over-earning the dividend.
Since 2014, FSK has experienced over $1 billion in realized losses which does not include in the realized losses from FSKR. This is more than almost every other BDC even when measured on a per-share basis as shown below. These losses were due to lower portfolio credit quality and the primary driver of NAV per share declines and two dividend cuts. It should be noted that FSK still has a meaningful portion of its portfolio in cyclical sectors and/or companies that are more likely to be impacted by supply chain issues as well as rising input costs especially labor. Many of these investments have been discussed in previous reports and some are discussed later
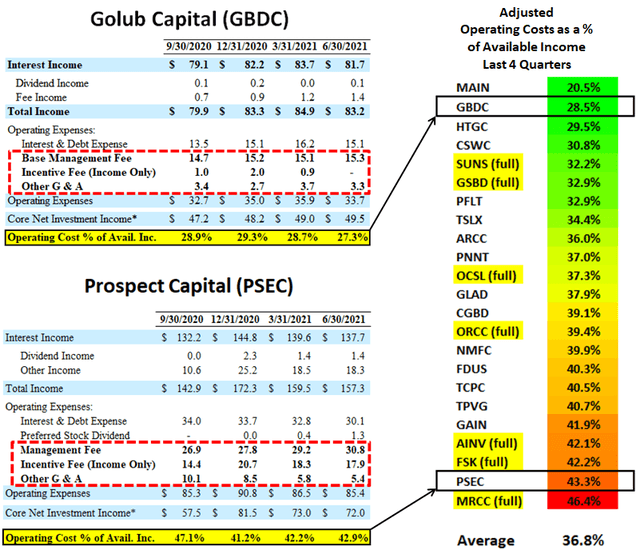
Operating Cost as a Percentage of Available Income
The last line in the projected financials (included in the Deep Dive Projection reports for each BDC) shows “Operating Cost as a Percentage of Available Income” which measures operating, management, and incentive fees compared to available income. BDCs with lower operating expenses can pay higher amounts to shareholders without investing in riskier assets.
- “Available Income” is total income less interest expense from borrowings and is the amount of income that is available to pay operating expenses and shareholder distributions.
Many BDCs have been temporarily waiving fees or have fee agreements that take into account previous capital losses. The following table shows the average adjusted operating cost ratios for each BDC over the last four quarters without the benefit of temporary fee waivers (including SUNS) with examples for GBDC and PSEC.
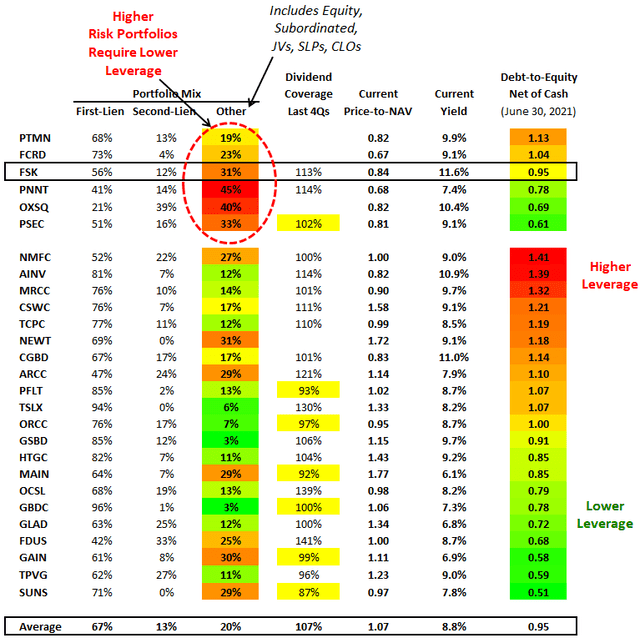
BDC Leverage Versus Portfolio Mix
The following table shows each BDC ranked by its debt-to-equity ratio net of cash along with its portfolio mix. The “Other” column includes everything that is NOT first or second-lien secured debt. I do not cover most of the higher-risk BDCs for many reasons but mostly because these are not typically buy-and-hold investments. BDCs with higher quality portfolios can support higher leverage. Many of the BDCs with lower leverage also have lower dividend coverage over the last four quarters including SUNS, GAIN, GBDC, MAIN, and ORCC. I am expecting improved dividend coverage for many BDCs as leverage increases as well as higher amounts of first-lien positions (to support higher leverage).
PTMN, FSK, FCRD, PSEC, and OXSQ have higher risk portfolios that require lower leverage and are separated from the others. These companies typically have higher amounts of cyclical exposure and/or non-secured debt, joint ventures, senior loan programs, CLOs, or equity positions that all carry much higher external leverage. Typically these assets do not qualify for lower cost BDC credit lines and revolvers which is why many of these BDCs have higher cost unsecured notes as well as using less leverage to maintain credit ratings.
FSK Dividend Coverage Update
On August 9, 2021, FSK declared a quarterly dividend of $0.65 for Q3 2021 which is an increase from the previous $0.60 due to higher-than-expected earnings for Q2 2021. As mentioned in the previous report, management has adopted a ‘variable dividend policy’ based on ANV per share and expected earnings:
“Consistent with our variable dividend policy of seeking to provide shareholders with an annualized 9% dividend yield on our NAV over time, we are committed to paying out additional levels of NII during quarters where our portfolio generates additional income. As a result, during the third quarter our dividend will be $0.65.”
However, as discussed in this report and by management on the recent call, investors should expect $0.60 of quarterly dividends for the following quarters;
“From a forward-looking dividend perspective, our third quarter dividend will be $0.65 per share, with the increase in this quarter’s dividend being tied directly to the additional net investment income we generated during the second quarter. All else being equal, given that we expect our third quarter adjusted NII to approximate $0.61 per share, we believe it is reasonable for investors to expect that should we achieve our adjusted NII guidance for the third quarter, that our fourth quarter dividend would be $0.60 per share; however, I should note that dividends are subject to the discretion of our board and applicable legal requirements, and this forward guidance, while intended to be helpful to investors, should not be interpreted as a formal dividend announcement.”
“Looking forward to the third quarter, while we expect our one-time fee and dividend income to return to a normalized level, we expect our adjusted NII to be $0.61 per share. Our recurring interest income on a GAAP basis is expected to approximate $275 million. We expect recurring dividend income associated with our joint venture to approximate $44 million. We expect other fee and dividend income to approximate $33 million during the third quarter.”
This is supported by the Leverage Analysis shown earlier projecting quarterly earnings of $0.561 per share using a portfolio of around $15 billion with a stable yield and not including the $15 million of temporary fee waivers which are around $0.05 per share.
FSK announces dividends when it reports financial results which is typically around the second week of November and there will likely be investors disappointed with the lower dividend payment and could impact its stock price.
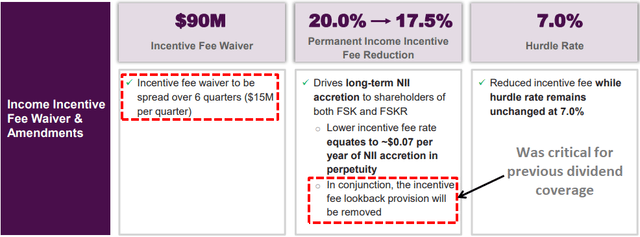
Historically, FSK has covered its dividend only due to no incentive fees paid driven by the ‘total return’ hurdle from previous realized/unrealized losses. However, the ‘total return’ hurdle or ‘look back’ provision was removed as a part of the merger agreement.
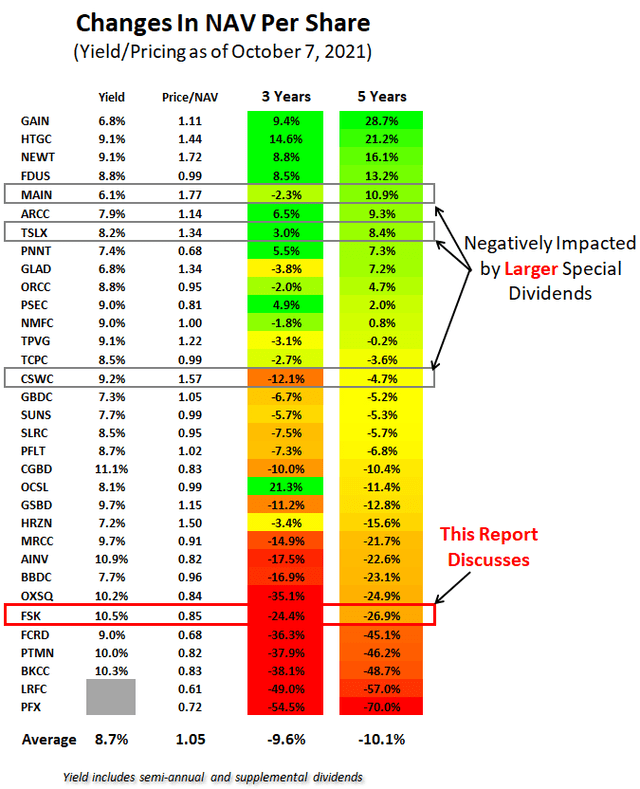
FS/KKR has agreed to waive $90 million of incentive fees spread evenly over the first six quarters following the closing. This waiver equates to $15 million per quarter. It is important to note that the company would have paid almost $90 million in incentive fees over the previous five quarters without the look-back provision which is almost $18 million per quarter. However, that is based on 20.0% income incentive fees compared to 17.5% but also only for FSK. The merger will double the size of the company with similar holdings and credit issues implying that the $15 million per quarter could be insufficient if there are continued/additional credit issues. FSKR’s NAV per share has declined by almost 30% over the last three years.
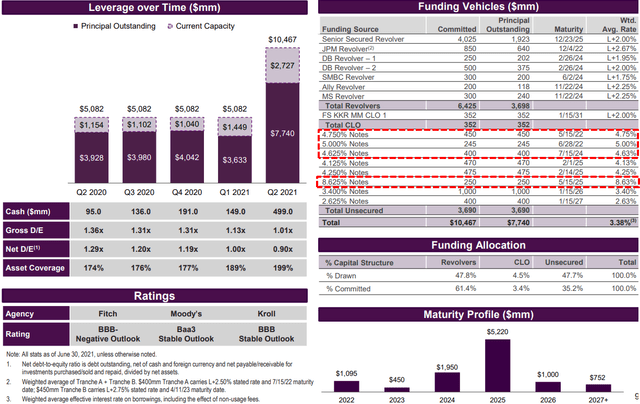
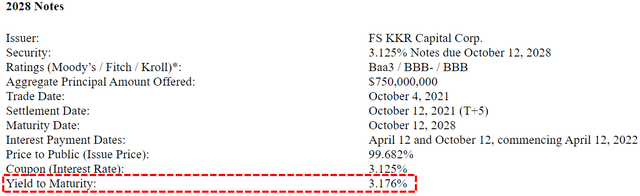
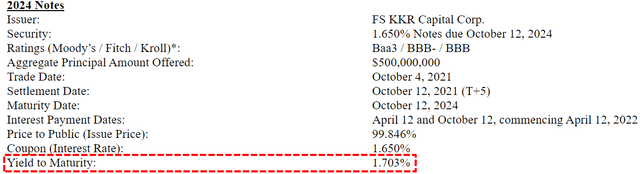
On October 4, 2021, FSK priced an offering of $750 million of 3.125% (YTM of 3.176%) unsecured notes due 2028 and $500 million of 1.650% (YTM of 1.703%) unsecured notes due 2024 that will likely be partially used to repay some of its higher rate borrowings and are taken into account with the updated projections. Management has guided for increased leverage driving portfolio growth over the coming quarters and is also taken into account:
“We’re at the end of this quarter roughly 0.9 times net. Our stated goals or targets there remain the same, really a range of 1.0 times to 1.25 times with probably a sweet spot around 1.1 times. We’ve got some room to grow there. We think that was one clear benefit of the merger. I think that can translate into additional deployment growth, additional income growth. I think we feel good about that, and then going back to the prior question, I think we feel quite good about the liability side of our balance sheet, how that all sort of stacks up. We do feel good about the macroeconomic environment, but I think we also want to be ready to play if there’s volatile times, and where we stand at our current leverage definitely allows us to do that. But you should expect us trending up to the one time-plus target over the coming quarters.”
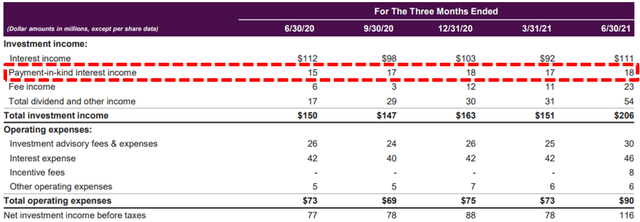
There are many factors to take into account when assessing dividend coverage for BDCs including portfolio credit quality, realized losses, fee structures including ‘total return hurdles’ taking into account capital losses, changes to portfolio yields, borrowing rates, the amount of non-recurring and non-cash income including payment-in-kind (“PIK”). Most BDCs have around 2% to 8% PIK income and I start to pay close attention once it is over ~5% of interest income. Higher amounts of PIK is typically a sign that portfolio companies are not able to pay interest expense in cash and could imply potential credit issues over the coming quarters.
The amount of PIK interest income declined but still accounts for almost 14.0% of total interest income compared to 15.6% during Q1 2021. There is a chance that FSK could be downgraded to ‘Level 3’ or ‘Level 4’ dividend coverage over the coming quarters if there is another round of credit issues driving additional realized losses and higher PIK similar to previous quarters and responsible for dividend reductions.
There is a good chance that management will be repurchasing shares during Q3 and Q4 2021:
“We also expect our previously announced $100 million board-approved stock buyback and program to begin during the third quarter. I think we’ve historically done these under a 10b5-1 plan. I think the expectation is we will continue to do that. I think going almost essentially exactly to your last point, we’ve probably thought about that more in the environment than if the stock was trading materially down, you want to try to be buying more if it was trading closer to book. We think that is starting to get into the numbers about it potentially being less attractive. We thought it was important as part of this merger to put another plan together, but I Think you should have the expectation it will be done under a 10b5-1.”

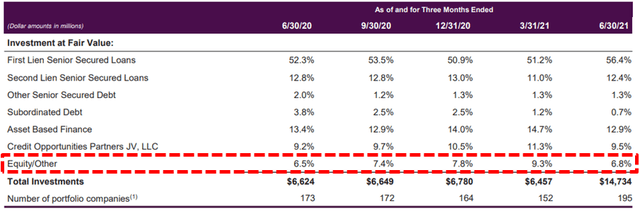
Management continues to reduce the amount of non-income producing equity investments from 9.3% to 6.8% partially related to the recent merger with FSKR.
For Q2 2021, FS KKR Capital (FSK) easily beat its best-case projections due to much higher-than-expected dividend income from Sound United, as well as a higher amount of fee and other income some of which is non-recurring:
“During the quarter, we materially out-earned our quarterly dividend due to strong originations as well as positive portfolio company performance, which included a significant one-time portfolio company dividend payment. The largest components of our fee and dividend income included $22 million of dividend income from our joint venture during the quarter. Other dividends from various portfolio companies totaled approximately $32 million during the quarter, of which $20 million was from our investment in Sound United. Finally, fee income totaled $23 million during the quarter, representing an increase of $12 million quarter-over-quarter with the change directly tied to our origination and repayment activity during the quarter.”
Also, it should be noted that the merger with FS KKR Capital II (FSKR) was near the end of the quarter which means that there is not a full quarter of income and expenses but also the amount of outstanding shares is now over 285 million compared to the weighted average of only 150 million used for calculating NII of $0.74 during Q2 2021.
FSK Quick Risk Profile Update
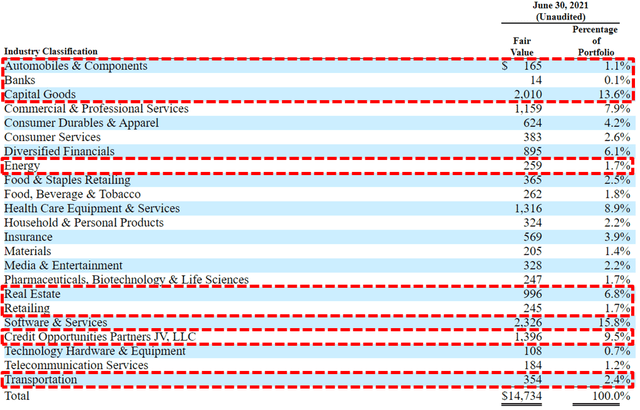
My primary concern is the higher amount of cyclical exposure including retail, capital goods, real estate, energy, and commodities that account for around 25% of the total portfolio. It also has many of the same exposures in its SCJV which is almost 10% of the portfolio. There is a good chance that many of FSK’s equity positions in these sectors have been benefiting from the recent recovery that could reverse at some point.
Also, many of the companies in FSK’s portfolio are more likely to be impacted by supply chain issues as well as “inflationary pressures” and rising input costs especially labor. On the August 2021 earnings call management views these issues as “transitory” and “supply chain disruptions to be resolved over the ensuing quarters”:
“The Fed’s comments in July regarding their belief of the transitory nature of many of the inflationary pressures currently affecting certain industries dovetails with our own views, as we expect many issues caused by COVID-related supply chain disruptions to be resolved over the ensuing quarters.”
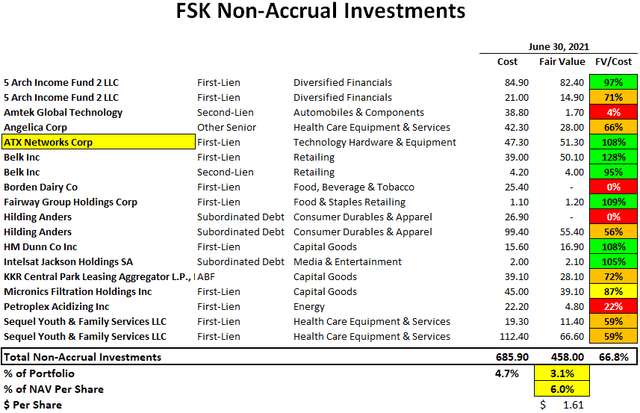
During Q2 2021, FSK placed its first-lien loan from ATX Networks on non-accrual status but will likely be back on accrual during Q3 2021 and is taken into account with the updated projections. It should be noted that this investment was marked 8% over cost as of June 30, 2021, as shown in the following table.
“During the second quarter, we placed one investment on non-accrual, ATX Networks. ATX design radio frequency, optical and other video networking equipment used primarily by cable operators. The company’s earnings have been negatively impacted by lower cable company capex spend. We owned $80 million of the $227 million first lien term loan marked at 64% of cost as of June 30, down from 69% of cost as of March 31. The company, a group of first lien lenders holding more than two-thirds of the first lien term loan, and other parties in the capital structure have made significant progress on a resolution of ATX’s breach of its Q1 financial covenant, and we expect the transaction resolving such breach to close in the third quarter. The anticipated impact of this potential transaction has been factored into the Q2 mark.”
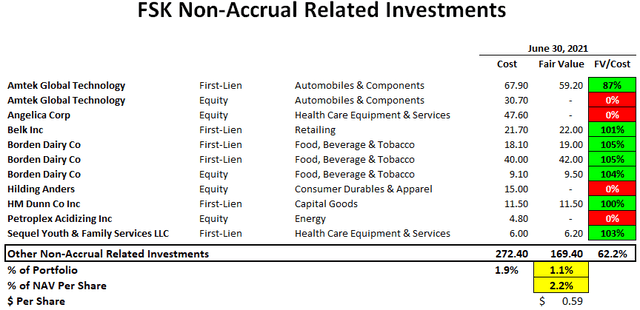
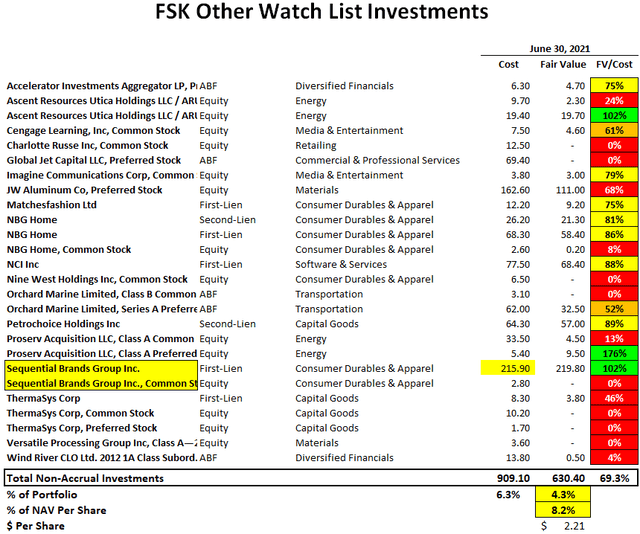
Total non-accruals currently account for around 4.7% of the portfolio at cost and 3.1% of the portfolio fair value but do not take into account the additional investments FSK has with these companies that account for another 1.9% of the portfolio at cost and 1.1% of the fair value. Also, there are quite a few investments that remain on its ‘watch list’ including Sequential Brands Group which filed for bankruptcy on August 31, 2021.
“The Company determined that, as a result of the significant debt on its corporate balance sheet, it was no longer able to operate its portfolio of brands. Accordingly, in conjunction with the filing, the Company will pursue the sale of all or substantially all of its assets under Section 363 of the U.S. Bankruptcy Code. In connection with this in-court process, Sequential will be obtaining $150 million in debtor-in-possession (“DIP”) financing from its existing Term B Lenders. The Company expects this new financing, together with cash generated from ongoing operations, to provide ample liquidity to support its operations during the sale process.”
As shown in the following tables, the total amount of investments considered non-accrual or related as well as on the ‘watch list’ account for almost $1.3 billion or 8.5% of the portfolio fair value. This is close to the amount of investments that the company has identified with its ‘Investment Rating’ 3 and 4 which are considered “underperforming investments” with “some loss of interest or dividend possible” and/or “concerns about the recoverability of principal or interest”. It should be noted that these investments have a total cost basis of almost $1.9 billion or 13% of the total portfolio and could result in additional realized losses over the coming quarters. Also, if additional watch list investments are added to non-accruals status this would likely drive additional declines in NAV per share, earnings, and dividend coverage.
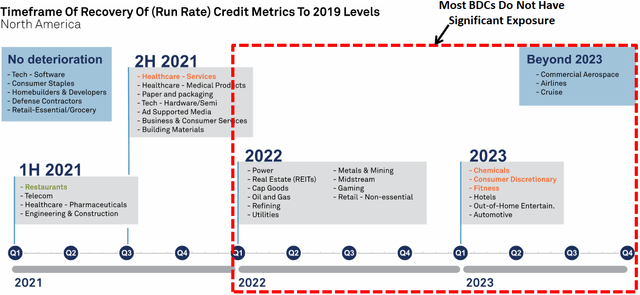
The following “Timeframe of Recovery of Credit Metrics to 2019 Levels” from S & P Global Ratings on February 17, 2021, shows their view of the recovery prospects for each sector. BDCs such as FSK and AINV have much higher concentrations of sectors that will likely take longer to recover which is taken into account with their risk ranks and pricing.
Full BDC Reports
This information was previously made available to subscribers of Premium BDC Reports. BDCs trade within a wide range of multiples driving higher and lower yields mostly related to portfolio credit quality and dividend coverage potential (not necessarily historical coverage). This means investors need to do their due diligence before buying.