The following information was previously provided to subscribers of BDC Buzz Premium Reports along with:
- PSEC target prices, buying points, and suggested limit orders (used during market volatility).
- PSEC risk profile, potential credit issues, changes in NAV, and overall rankings. Please see BDC Risk Profiles for additional details.
- PSEC dividend coverage projections (base, best, worst-case scenarios). Please see BDC Dividend Coverage Levels for additional details.
![]()
Coverage of Lower-Performing BDCs
There are a handful of reasons to cover/follow the lower-performing BDCs including:
- Establishing a range for key measures of quality in the sector which are used to assign price targets for each BDC. Also, it is helpful to see where how the other BDCs rank compared to others and then be able to tie to performance.
- Identifying signs of lower quality management so that we know what to look for in other BDCs before there is a ‘real problem’. This is similar to watching the car in front of you drive off the road so that you do not make the same mistake.
- There is always a chance that management will be able to improve performance as they are responsible for almost every aspect including credit quality, fee structure/waivers, dividend policy, marking the portfolio with appropriate valuations, timing of changes in the capital structure (equity and bond offerings), operating and borrowing expenses, etc.
- Also, many investors will hold their investment-grade bonds rather than the common shares (including myself but not with PSEC).
I believe that Prospect Capital (PSEC) is an excellent ‘case study’ of a poorly managed BDC that we can all learn from.
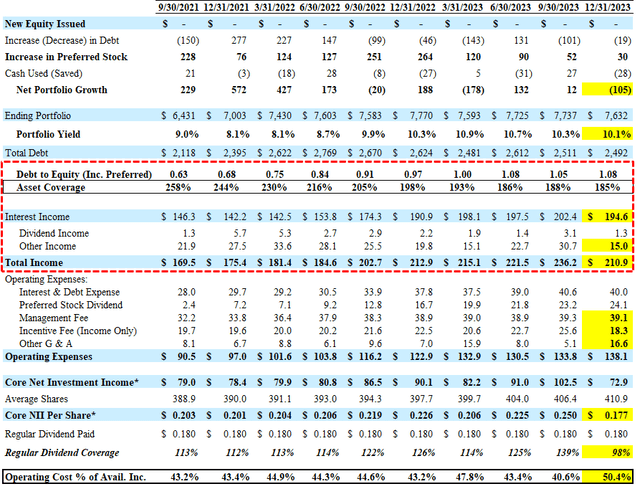
Its “Operating Cost as a Percentage of Available Income” which measures operating, management, and incentive fees compared to available income has recently increased to over 50% (as shown later). “Available Income” is total income less interest expense and is the amount of income that is available to pay operating expenses and shareholder distributions. This means that over 50% is going to management rather than paying shareholders.
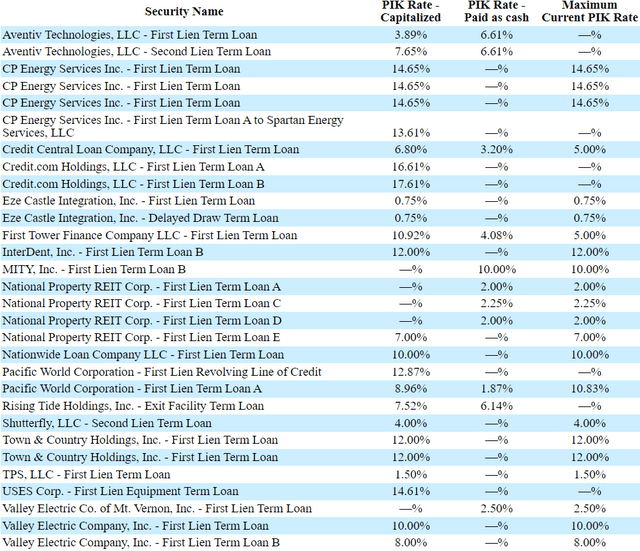
Also, the amount of PIK interest income for PSEC recently increased from 11.4% to 20.2% of interest income (from 9.8% to 18.6% of total income), which is now higher than FS KKR Capital (FSK) and Monroe Capital (MRCC) which is around 13% to 16 of total income.
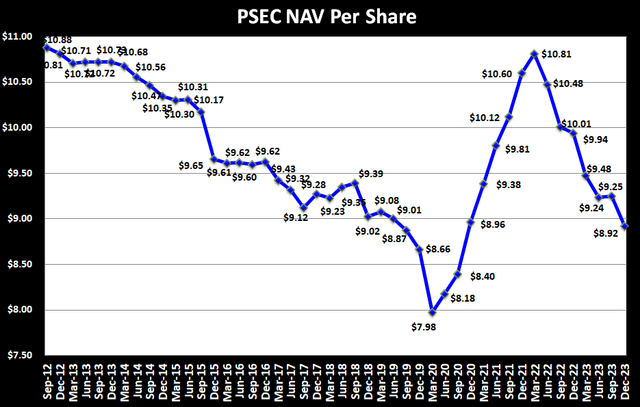
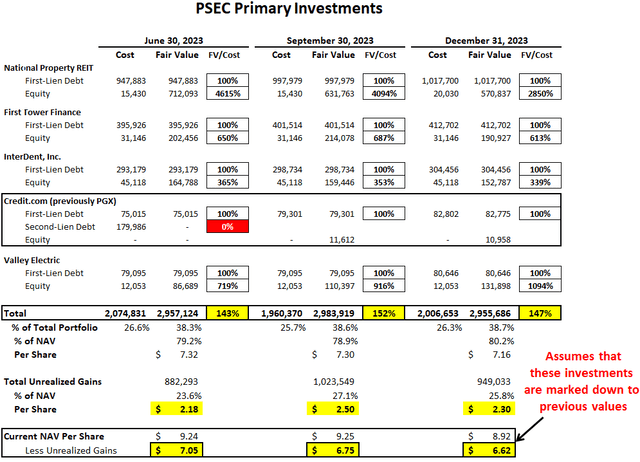
As shown later, its top five investments account for $3.0 billion, or almost 40% of the total portfolio, and over 80% of NAV per share. If these investments were marked back down to cost, the current NAV per share would decline from $8.92 to $6.62.

PSEC Quick Quarterly Update (December 31, 2023)
- Pricing: No change. I will reassess after updating the projections.
- Earnings: Reported below its worst-case projections due to lower-than-expected income from its CLO investments and zero structuring fee income from National Property REIT combined with much higher ‘Other G & A expenses’.
- Payment-in-Kind (“PIK”) Income: Increased from 11.4% to 20.2% of interest income (from 9.8% to 18.6% of total income), which is now higher than FSK and MRCC.
- Dividends: Maintained its regular monthly dividend of $0.06 per share through April 2024 and expects to declare subsequent distributions in May 2024.
- Credit Quality: Non-accrual investments remain 0.2% of the total portfolio at fair value and include only two of its loans to Uses Corp as the other remain fully valued and on accrual status. Other investments on non-accrual include Engine Group, Strategic Materials, and United Sporting Companies. Please note that Aventiv (Securus Technologies) remains on accrual status even though ARCC placed its second-lien position on non-accrual in Q4 2023.
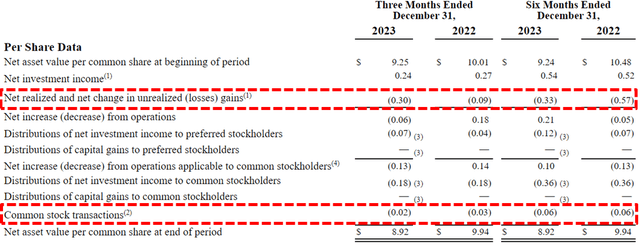
- NAV Per Share: Decreased by $0.33 or 3.6% (from $9.25 to $8.92) due to marking down its watch list investments in Securus Technologies, National Property REIT, First Tower Finance, CP Energy, and InterDent as well as issuing shares through its DRIP and conversion of its preferred stock (shown below). The markdowns in these five investments accounted for over $131 million of portfolio losses (as shown later) or around $0.32 per share but were partially offset by gains in Valley Electric.
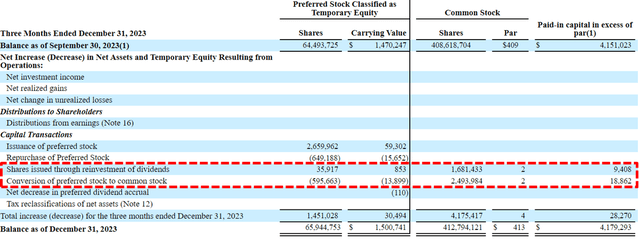
As shown below, there were almost 4.2 million additional shares issued during Q4 2023 mostly through conversion of its preferred stock plus the dividend reinvestment plan (“DRIP”) at a 5% discount to the market price. The weighted average price of the newly issued shares was around $6.77 or a 24% discount to NAV per share:
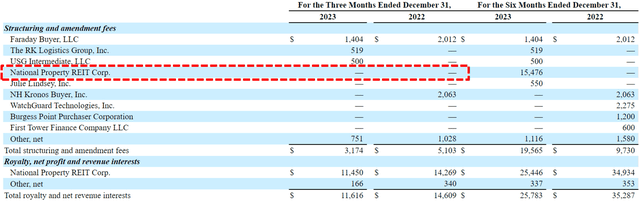
As shown below, there was no restructuring fee income from National Property REIT during Q4 2023 compared to $15.5 million the previous quarter. Also,
PSEC’s total revenues have declined to levels before the recent rise in interest rates even though leverage has increased due to additional credit issues, declining income from CLOs, and lower amounts of non-interest income. Also, the “Operating Cost as a Percentage of Available Income” which measures operating, management, and incentive fees compared to available income increased to over 50%. “Available Income” is total income less interest expense and is the amount of income that is available to pay operating expenses and shareholder distributions.
Its NAV per share declined by $0.33 or 3.6% due to marking down its watch list investments in Securus Technologies, National Property REIT, First Tower Finance, CP Energy, and InterDent accounted for over $131 million of losses partially offset by gains in Valley Electric:
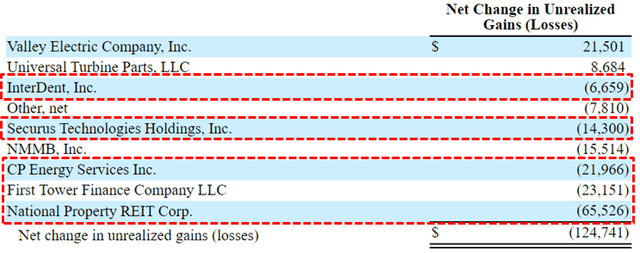
National Property REIT, First Tower Finance, InterDent, Valley Electric, and Credit.com/PGX, still account for $3.0 billion, or almost 40% of the total portfolio, and over 80% of NAV per share (as shown below). This is a very high-concentration risk, especially if management uses aggressive valuation measures. The following table shows the total amount of unrealized gains remains around $1 billion, which has added $2.30 to its NAV per share even after taking into account the continued markdowns. If these investments were marked back down to cost, the current NAV per share would decline from $8.92 to $6.62.
During an economic recession, this is a possibility for some of these investments, and investors should be prepared for a certain amount of markdowns. On September 28, 2023, PGX underwent a corporate restructuring with the new borrower being Credit.com Holdings. As part of the transaction, the first-lien term loan was restructured into new debt, resulting in a realized loss of $1.5 million, and the second-lien term loan was written off resulting in a realized loss of $180.0 million. In connection with a Chapter 11 process, PGX sold the majority of its assets to Credit.com Holdings, and PSEC was issued equity at Credit.com, through its Class B non-voting equity investment in PGX Topco.
There are many factors to take into account when assessing dividend coverage for BDCs including portfolio credit quality, realized losses, fee structures including ‘total return hurdles’ taking into account capital losses, changes to portfolio yields, borrowing rates, the amount of non-recurring and non-cash sources of income including payment-in-kind (“PIK”). Higher amounts of PIK for lower-quality BDCs are typically a sign that portfolio companies are not able to pay interest expense in cash and could imply potential credit issues over the coming quarters.
Most BDCs have around 2% to 8% PIK income and I pay close attention once it is over ~5% of total interest income. The amount of PIK interest income for PSEC recently increased from 11.4% to 20.2% of interest income (from 9.8% to 18.6% of total income), which is now higher than FSK and MRCC which are around 13% to 16 of total income.
The following table shows many of the larger PIK positions for PSEC with the following notes:
- PIK was due January 2, 2024 for Valley Electric Company, Inc. loans. The Maximum PIK rate that was capitalized into the balance of the First Lien Term Loan and First Lien Term Loan B was 10.00% and 8.00%, respectively.
- On December 29, 2023, the Aventiv Technologies First Lien and Second Lien Term Loan were amended to allow a portion of interest accruing in cash to be payable in kind.
- PIK was due October 2, 2023 for CP Energy Services loans. The Maximum PIK rate that was capitalized into the balance of the loans was 14.65%.
- On September 28, 2023, the Credit.com First Lien Term Loan A and First Lien Term Loan B were amended to allow a portion of interest accruing in cash to be payable in kind.
- On September 12, 2023, the Rising Tide Holdings, Inc. Exit Facility Term loan was amended to allow a portion of interest accruing in cash to be payable in kind.
- On March 28, 2023, the USES Corp. First Lien Equipment Term loan was amended to allow interest accruing in cash to be payable in kind resulting in a maximum current PIK rate of 14.61%.
- On January 6, 2023, the CP Energy Services Amendment No. 16 to Loan Agreement was amended to allow interest accruing in cash to be payable in kind resulting in a maximum current PIK rate of 14.65%.
- On August 22, 2022, the Spartan Energy Services Amended and Restated Senior Secured Loan Agreement was amended to allow interest accruing in cash to be payable in kind resulting in a maximum current PIK rate of 13.61%.
- On September 30, 2022, the Credit Central Senior Subordinated Loan Agreement was amended to allow interest accruing in cash to be payable in kind resulting in a maximum current PIK rate of 10.00%.
- On December 30, 2022, the First Tower Finance Amendment No. 15 was amended to reduce the PIK rate to 5.00% and allow the interest accruing in cash to be payable in kind resulting in a maximum current PIK rate of 15.00%.
As of December 31, 2023, around 18% of the portfolio was equity positions in a small group of investments, and 8% invested in the equity class of the collateralized loan obligation (“CLO”), which are considered non-qualified investments due to the amount of off-balance sheet leverage (typically 10 times) used to achieve returns. Together these account for almost 26% of the portfolio and banks will not allow these assets to be used as collateral for credit lines, which is why PSEC needs to use subordinated notes and preferred stock for most of its borrowings.
What Can I Expect Each Week With a Paid Subscription?
Each week we provide a balance between easy-to-digest general information to make timely trading decisions supported by the detail in the Deep Dive Projection reports (for each BDC) for subscribers that are building larger BDC portfolios.
- Monday Morning Update – Before the markets open each Monday morning, we provide quick updates for the sector, including significant events for each BDC along with upcoming earnings, reporting, and ex-dividend dates. Also, we provide a list of the best-priced opportunities along with oversold/overbought conditions, and what to look for in the coming week.
- Deep Dive Projection Reports – Detailed reports on individual BDCs each week prioritized by focusing on buying opportunities and potential issues such as changes in portfolio credit quality and/or dividend coverage (usually related). This should help subscribers put together a shopping list ready for the next general market pullback.
- Weekly General Updates or Comparison Reports – A series of updates discussing ‘Building a BDC Portfolio’, suggested pricing and limit orders, expense/return ratios, interest rates, leverage, BDC Investment Grade Notes/Baby Bonds, portfolio mix, and potential impacts on dividend coverage and risk.
![]()