The following is from the AINV Update that was previously provided to subscribers of Premium BDC Reports along with revised target prices, dividend coverage and risk profile rankings, potential credit issues, earnings/dividend projections, quality of management, fee agreements, and my personal positions for all business development companies (“BDCs”).

AINV Update Summary:
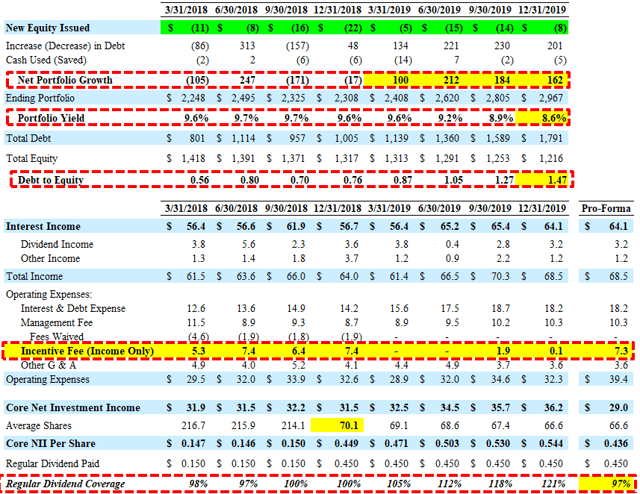
- AINV beat its best-case projections, covering its dividend but only due to additional markdowns (same as previous quarter) resulting in minimal incentive fees paid. AINV would have only covered 97% of its dividend if the full incentive fees had been paid.
- NAV per share declined by another $0.42 or 2.3% (from $18.69 to $18.27) due to additional markdowns mostly due to its ‘non-core legacy assets’.
- Total realized/unrealized losses were partially offset by accretive share repurchases (adding $0.02 per share) and overearning the dividend.
- On January 31, 2020, Fitch downgraded AINV’s senior unsecured debt rating to ‘BB+’ from ‘BBB-‘ but with ‘Stable Outlook’ that was previously ‘Negative’.
- Portfolio growth was higher-than-expected and the company repurchased 0.5 million shares at a 16% discount to the previously reported NAV resulting in an increased debt-to-equity ratio of 1.47 as the company utilizes its access to higher leverage.
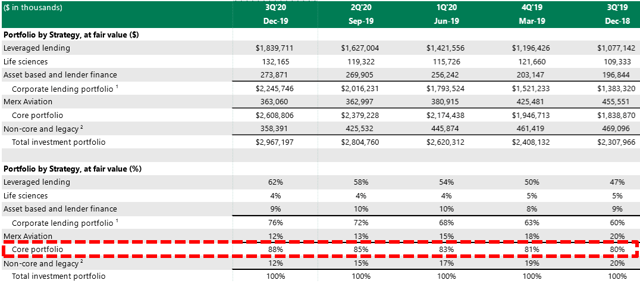
- The “core strategies” portion of the portfolio now accounts for 88% of all investments.
- However, the average leverage during the quarter was 1.27 implying higher earnings in the coming quarter.
- In 2020, AINV has not repurchased shares “given the recent rally in the stock”.
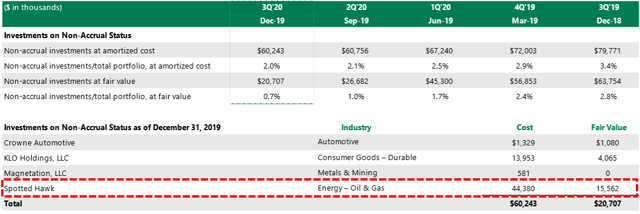
- Total non-accruals account for 0.7% of total investments at fair value (previously 1.0%) and 2.0% of total investments at cost (previously 2.1%). If these investments were completely written off, it would impact NAV by another $0.31 or 1.7%.
For calendar Q4 2019, Apollo Investment (AINV) beat best-case projections but only due to minimal incentive fees paid during the quarter driven by the ‘total return hurdle’:
“Net investment income for the quarter was $0.54 cents per share reflecting the net portfolio of growth and they were total return feature in our incentive fee structure, which resulted in a nominal incentive fee for the quarter.”
I was expecting a portion of credits to the incentive fees for calendar Q4 2019 but there were additional markdowns related to its ‘non-core’/oil and gas investments resulting in lower incentive fees paid during the quarter. As shown in the following table, the company would have only covered 97% of its dividend if the full incentive fees had been paid. The Board maintained its distribution of $0.45 per share.
Net asset value (“NAV”) per share declined by another $0.42 or 2.3% (from $18.69 to $18.27) due to additional markdowns mostly due to its ‘non-core legacy assets’ partially offset by accretive share repurchases (adding $0.02 per share) and overearning the dividend.
“Net asset value per share was 18.27 at the end of December down 2.3% quarter over quarter. The $0.42 net reduction in NAV per share was due to a $.54 net loss on the portfolio partially offset by net investment income in excess of the distribution of $0.09, and a $0.02 accretive impact from share repurchases. Noncore and legacy assets accounted for $.51 or 95% of the net loss, oil and gas accounted for $0.19 of loss, legacy assets for $0.18, renewable $0.13 and shipping $0.01.”
There were no new non-accruals that declined due another markdown of its oil and gas investment in Spotted Hawk. Total non-accruals currently account for 0.7% of total investments at fair value (previously 1.0%) and 2.0% of total investments at cost (previously 2.1%). If these investments were completely written off, it would impact NAV by another $0.31 or 1.7%.
“No investments were placed on or removed from nonaccrual status. At the end of December investments on nonaccrual status represented 0.7% of the portfolio fair value down from 1% last quarter and 2% at cost down from 2.1% last quarter.”
Portfolio growth was higher-than-expected and the company repurchased 0.5 million shares at a 16% discount to the previously reported NAV resulting in an increased debt-to-equity ratio (leverage) of 1.47 as the company utilizes its access to higher leverage. However, the average leverage during the quarter was 1.27 implying higher earnings in the coming quarter:
“It is important to note that average leverage for the quarter was 1.27 times and client at the larger portfolio will continue to drive earnings growth in the current quarter.”
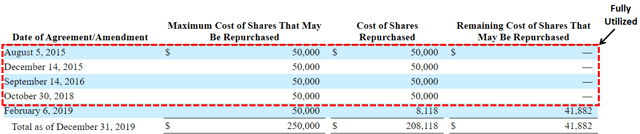
In February 2019, the Board approved a new stock repurchase plan to acquire up to $50 million of the common stock. The new plan was in addition to the existing share repurchase authorization that was fully utilized during the quarter. Since the inception of the share repurchase program, AINV has repurchased over 12 million shares at a weighted average price per share of $16.83 for a total cost of almost $208 million. Since the end of the quarter, AINV has not repurchased any shares.
“Given the recent rally in the stock, no shares have been purchased since early November. We believe that stock buybacks are the most accretive use of shareholder capital when the stock is trading at a meaningful discount on that. Our board has authorized $50 million plans for total authorization of $250 million. Today we have repurchased over $208 million of stock below NAV, which has accreted $0.68 to NAV per share. We believe the combination of AINV fee structure changes and active stock repurchase program demonstrate our commitment to creating value for our shareholders.”
As mentioned in previous reports, the company is in the process of repositioning the portfolio into safer assets including reducing its exposure to oil & gas, unsecured debt, and CLOs. The “core strategies” portion of the portfolio now accounts for 88% of all investments:
Mr. Howard Widra, AINV’s CEO commented, “We continued to successfully implement our plan to prudently grow our portfolio with first lien floating rate corporate loans sourced by the Apollo Direct Origination platform, while continuing to reduce our exposure non-core and legacy assets as well as second lien loans. We believe the risk profile of our portfolio continues to improve which allows us to operate at a higher leverage ratio. In addition, this quarter was an important inflection point in the makeup of our non-core portfolio. The non-core portfolio decreased by approximately $67 million through the combination of repayments and unrealized losses, reducing non-core assets to 12% of the portfolio. In addition, the risk attributable to our remaining non-core portfolio has decreased due to the successful restructuring of our investment in Carbonfree Chemicals. The combination of this restructuring and the accretive impact of the reinvestment of the proceeds received from non-core and legacy repayments has allowed us to have a smaller and better collateralized non-core portfolio while improving the overall earnings profile of Apollo Investment.
On January 31, 2020, Fitch downgraded AINV’s senior unsecured debt rating to ‘BB+’ from ‘BBB-‘ but with ‘Stable Outlook’ that was previously ‘Negative’. This will be discussed in the updated Deep Dive report.
“The ratings downgrade reflects the increase in balance sheet leverage, which has not been sufficiently offset by a reduction in portfolio risk, and Fitch’s expectation that Apollo’s leverage (debt/equity) could increase above the previously articulated maximum target of 1.40x; as well as an increased reliance on secured debt funding, which reduces the firm’s funding flexibility. Apollo’s ratings remain supported by its affiliation with the AGM platform; which provides access to investment resources and deal flow; the firm’s experienced management team; and improving portfolio risk profile, including above- average portfolio exposure to first lien investments compared to rated BDC peers. Rating constraints include Apollo’s weaker-than-peer track record in credit; the continuation of execution risk associated with the portfolio mix shift given the firm’s mixed track record and the highly competitive environment; and continued exposure, albeit declining, to certain non-core and legacy investments, which include energy, shipping, renewables.”
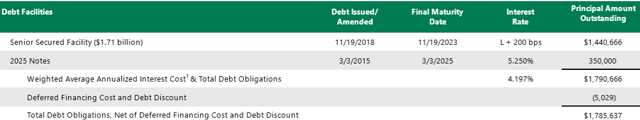
AINV previously amended its Senior Secured Facility increasing commitments by $70 million which increased the size of the facility to $1.71 billion.
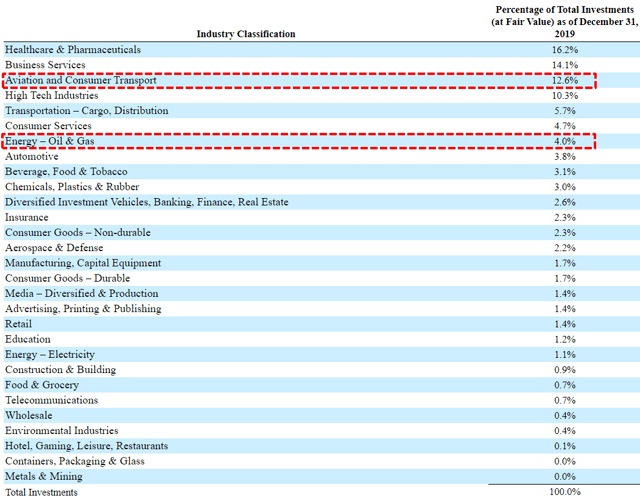
Its aircraft leasing through Merx Aviation remains the largest investment but is now below 13% of the portfolio and continues to pay dividend income. As mentioned in previous reports, AINV has been reducing its concentration risk including reducing its exposure to Merx. Energy, oil and gas investments account for around 4.0% of the portfolio (due to recent markdowns) as compared to 4.8% during the previous quarter:
This information was previously made available to subscribers of Premium BDC Reports, along with:
- AINV target prices and buying points
- AINV risk profile, potential credit issues, and overall rankings
- AINV dividend coverage projections and worst-case scenarios
- Real-time changes to my personal portfolio
To be a successful BDC investor:
- As companies report results, closely monitor dividend coverage potential and portfolio credit quality.
- Identify BDCs that fit your risk profile.
- Establish appropriate price targets based on relative risk and returns (mostly from regular and potential special dividends).
- Diversify your BDC portfolio with at least five companies. There are around 50 publicly traded BDCs; please be selective.