TCRD: 13.2% Yield At Risk Of Upcoming Dividend Cut

Summary

  • BDCs will begin reporting calendar Q2 2018 results next and I will be focusing on potential issues including expected dividend cuts as discussed in this article.
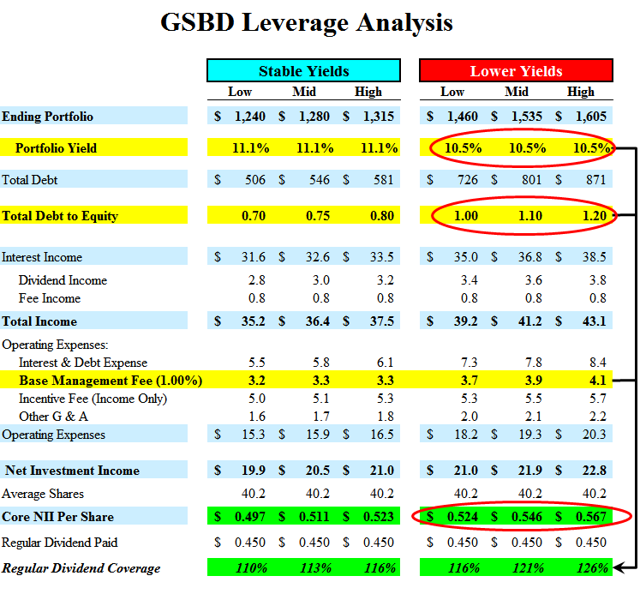
  • I have correctly predicted many of the previous dividend cuts for the companies that I follow using my ‘Leverage Analysis & Dividend Potential’ as shown in this article.
  • TCRD is working on many initiatives to improve dividend coverage including growing its Logan JV, rotating out of non-income producing assets and improving portfolio credit quality.
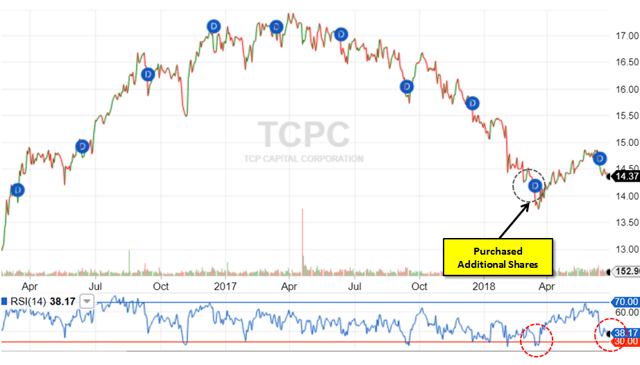
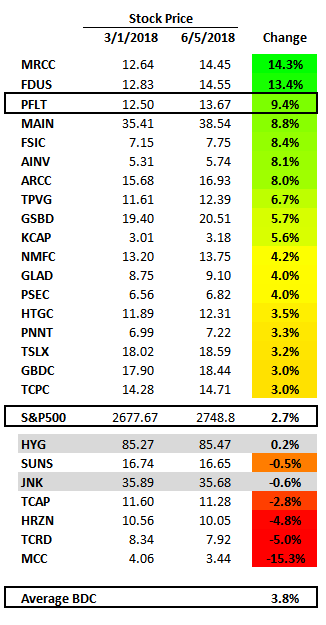
  • TCRD insiders have recently been purchasing additional shares at prices between $7.81 and $8.33 compared to the current price of around $8.18.
  • Investors need to pay close attention to upcoming results looking for potential credit issues and changes to expected dividend coverage.

You can read the full article at the following link:

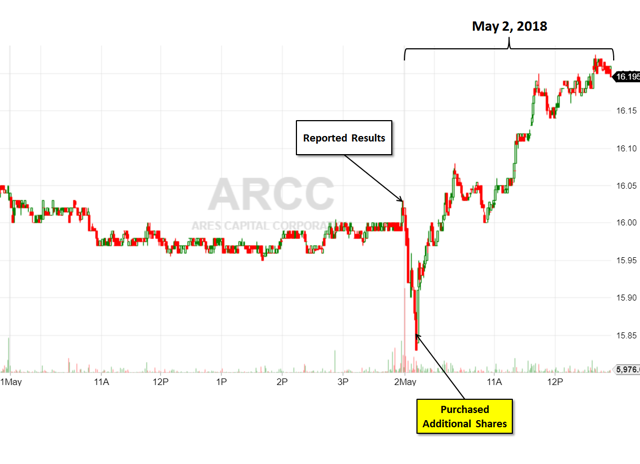
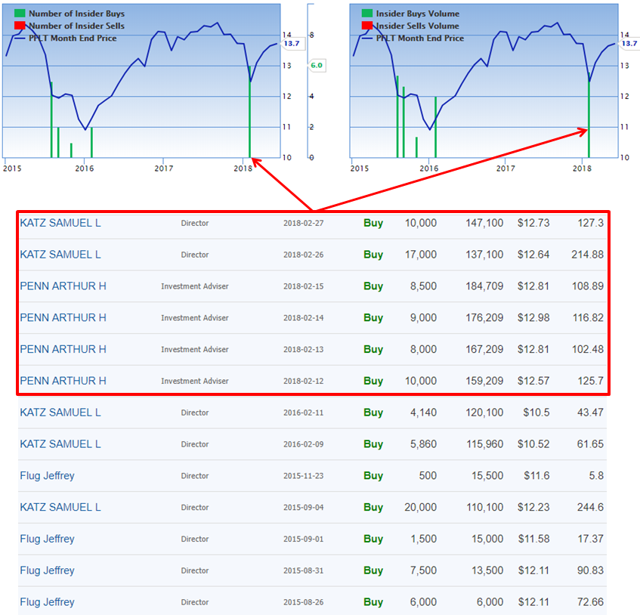
Recent TCRD Insider Purchases

As shown below, THL Credit (TCRD) insiders have recently been purchasing additional shares at prices between $7.81 and $8.33 compared to the current price of around $8.18:
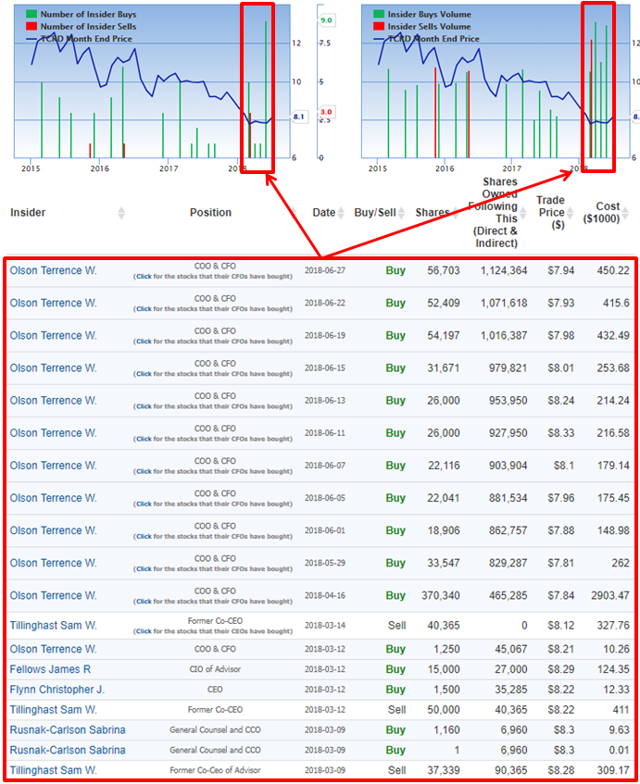
Source: GuruFocus

Upcoming Dividend Cut

There is a good chance of a ~20% dividend reduction in late 2018 as the fee waivers expire as shown in the Leverage Analysis at the end of this article. Previously, I downgraded TCRD due to continued credit issues, declining net asset value (“NAV”) and portfolio yield as well as being above target leverage with expected declines in the overall size of the portfolio and investments restructured into non-income producing equity assets. However, the company is working to create value in those positions and eventually reinvest into income producing assets that should help to offset additional yield compression in the coming quarters.

“We are focused on improving the diversification across the portfolio, monetizing our non-income-producing equity securities and growing the Logan joint venture, which provided roughly a 14% ROE to our shareholders in the first quarter. While this strategy is being executed, we and our adviser have sought to ensure alignment among ourselves and our shareholders. As we’ve mentioned on our previous call, our adviser has agreed to waive all incentive fees for 2018.”

Source: TCRD Earnings Call Transcript

Management is waiving 100% of its incentive fees through 2018 and undistributed taxable remains around $0.34 per share and the board previously declared a dividend of $0.27 per share paid on June 29, 2018. It should be noted that the last time TCRD reduced its dividend, there was undistributed taxable income but management aligned the dividend closer to expected NII over the coming quarters.

Christopher Flynn, CEO: “We are focused on our stated strategy to invest in first lien loans of sponsor-backed companies and increase diversity across the portfolio, to monetize non-income producing equity securities, and to grow the Logan joint venture. We have continued to support our dividend over the course of this on-going transition and benefit from the strong support of our Advisor.”

Source: TCRD Earnings Call Transcript


ARCC: 9% Dividend Yield Positioned For Rising Rates And Upcoming Special Dividend

Summary

  • I purchased additional shares of ARCC after reporting Q1 2018 results, taking advantage of lower morning prices before others were able to digest the favorable results discussed in this article.
  • The company will likely exit its investment in Alcami Holdings marked $254 million over cost, resulting in $0.60 per share of realized gains driving a potential special dividend.
  • On June 25, 2018, ARCC announced approval to reduce its asset coverage ratio effective on June 21, 2019. The management fee is reduced to 1.00% on assets over 1.00x debt-to-equity.
  • Dividend coverage should continue to improve due to utilizing its 30% non-qualified bucket (through SDLP and IHAM), rotation out of non-core assets and increased LIBOR/portfolio yield, leverage/portfolio growth.
  • ARCC and other BDCs will begin reporting Q2 results next week.

You can read the full article at the following link:

I recently purchased additional shares of Ares Capital (ARCC) on May 2, 2018, due to the company reporting favorable Q1 2018 results as discussed in this article. After the company reported, not all investors agreed that the results were ‘favorable’ and the price dropped in morning trading which is where I purchased shares at an average price of $15.87 as shown below:

ARCC released its 10-Q SEC filing before the markets open which does not give investors much time to digest before trading begins. Throughout the day, the price rebounded and has continued higher as shown below:

MAIN: This High-Yielding, Sleep-Well Investment Is About To Announce A Dividend Increase

Summary

  • I am predicting another monthly dividend increase to $0.195 per month to be announced before the company reports earnings on August 2, 2018, for the reasons discussed in this article.
  • MAIN is the top-rated BDC by S&P Global Ratings that continues to grow its “per share” economics, including earnings and book value driving higher total returns to shareholders.
  • This article also discusses increased NAV per share in Q2 2018 and when to purchase additional shares of this best-of-breed “sleep well at night” high-yield investment.
  • Semiannual dividends continue to be supported with realized gains including the recent exits of Hydratec, Inc. and Soft Touch Medical Holdings for realized gains of $7.9 million and $5.2 million, respectively.

You can read the full article at the following link:

Reasons to Buy MAIN:

MAIN is clearly one of the best-managed BDCs for many reasons (some are discussed in this article) as the company continues to deliver higher total returns to investors through:

  • Maintaining a much lower operational cost structure to maximize distributions to shareholders.
  • Managing an efficient lower cost capital structure with conservative leverage.
  • Well-timed highly accretive equity offerings.
  • Conservative valuation and dividend policy with consistent coverage from NII and semiannual supplemental dividends.
  • Quality of the origination/credit platform to build a portfolio to deliver consistent returns to shareholders while protecting the capital invested.
  • No plans to seek “externalization” or higher leverage through reduced asset coverage ratio.
  • Management is an active purchaser of shares each quarter, currently holding over $115 million.
  • Continued involvement in regulatory aspects of the sector: “we’ve been much more focused on our legislative agenda with respect to BDC modernization, getting an SBIC bill passed in the House and Appropriations Bill has some really good language in it. The House Appropriations Bill that cleared the committee, real good in it language on the AFFE issue, which could reinstate us back into the indices.”

Purchasing Additional Shares of MAIN

As mentioned earlier this week in “Another Big Win Driving Special Dividends And 9% To 10% Yield,” I have been buying additional shares of higher quality business development companies (“BDCs”), especially given the oversold conditions driving higher yields. Many BDCs have been rallying over the last three to four months, likely for the reasons discussed in previous articles including:

Once I have selected a BDC that fits my personal risk profile (there are over 50 publicly traded BDCs, please be selective), I use momentum indicators such as Relative Strength Index or (“RSI”) from my BDC Google Sheets to help determine if a stock is ‘oversold’ or ‘undervalued.’ Most of my previous purchases of MAIN were when the stock had an RSI of 30 or below. The following definition of RSI is from Investopedia:

Traditional interpretation and usage of the RSI is that RSI values of 70 or above indicate that a security is becoming overbought or overvalued, and therefore may be primed for a trend reversal or corrective pullback in price. On the other side of RSI values, an RSI reading of 30 or below is commonly interpreted as indicating an oversold or undervalued condition that may signal a trend change or corrective price reversal to the upside.”

Over the last two years, MAIN has been near or below 30 multiple times and typically a good buying point:


TSLX: Another Big Win Driving Special Dividends And 9% To 10% Yield

Summary

  • I recently purchased shares of TSLX (along with insiders) for many reasons, including excellent credit quality and dividend coverage, driving higher total returns and likely special dividends to shareholders.
  • TSLX has paid special dividends each quarter over the last five quarters for a total of $0.28 per share.
  • I am expecting higher amounts paid in 2018 for the reasons discussed in this article, including higher portfolio yield from rising interest rates and recent portfolio growth.
  • TSLX’s largest investment (iHeart Communications) debtors filed for bankruptcy on April 28, 2018, eventually repaying its $117.5 million ABL and providing around $0.07/$0.08 in NII for upcoming special dividends.
  • Two weeks from now, management will discuss another home run for Q2 2018 with its “opportunistic” investment in Ferrellgas Partners that will likely drive another large special dividend.

You can read the full article at the following link:

My Recent Purchase And Insider Buying:

I recently purchased shares of TPG Specialty Lending (TSLX) as discussed at the end of this article along with insiders earlier this year:

Source: GuruFocus

Continued And Upcoming Special Dividends

TSLX recently announced a special/supplemental dividend of $0.06 per share paid in June which was just below my ‘best case’ projected special dividend of $0.07. The company has paid special dividends each quarter over the last five quarters for a total of $0.28 per share:

“Consistent with our objective of maximizing distribution to shareholders while preserving the stability of our net asset value, we have declared a total of $0.28 per share in incremental dividends over the past five quarters based on our formulaic supplemental dividend framework. While increasing net asset value from $15.95 to $16.21 per share at the end of March after giving effect to the impact of the $0.06 Q1 supplemental dividend to be paid in Q2. Over the last 12 months we have increased dividend payment to shareholders over our base dividend by 15.4%, while generating a 1.3% increase in net asset value per share over the same period.”

Source: TSLX Earnings Call Transcript

The company has covered its regular dividend by an average of 134% over the last four quarters, with undistributed taxable income and capital gains of around $65 million or $1.01 per share after taking into account supplemental dividends. As discussed in previous articles, TSLX management continues to produce higher returns by investing in distressed companies through excellent underwriting standards that protect shareholders during worst-case scenarios including call protection, prepayment fees and amendment fees backed by first-lien collateral of the assets.

I am expecting higher amounts of supplemental dividends paid in 2018, given the likelihood of “other fees” associated with the upcoming repayment of its recent $117.5 million asset-based loan (“ABL”) with iHeart Communicationsat LIBOR+4.75. The fees are typically amortized over three years unless paid off early which will likely be in Q2/Q3 2018. iHeartMedia Inc. is the largest radio broadcaster and filed for bankruptcy on March 14, 2018, and the debtors filed Chapter 11 on April 28, 2018:

“On March 14, the company filed for Chapter 11 with a restructuring support agreement or RSA from a majority of its senior and junior creditors. We note that as part of the filing we negotiate a cash collateral order with the company where among other things we receive current interest, reserve default rate interest and received replacement liens on our collateral. In addition, the company must remain in compliance with our borrowing base. Last week on April 28 the iHeart debtors filed a joint Chapter 11 planned the reorganization, specifically as it relates to our investment the plan provides that ABL credit agreement claims are unimpaired other than the plan and the holders of the ABL credibly agreement claims shall receive payment in full in cash or reinstatement of those claims. As we indicated during our last earnings call, we expect repayment on our principal investment in iHeart to occur during the course of this year.”

Source: TSLX Earnings Call Transcript

GSBD: 8.6% Yield With Dividend Growth Potential Through Reduced Fees And Increased Leverage

Summary

  • On June 15, 2018, GSBD shareholders overwhelmingly approved the application of the reduced asset coverage requirements allowing the company to double its leverage.
  • Management has agreed to reduce its base management fee from 1.50% to 1.00% which would be among the lowest in the sector to help offset potentially lower yielding assets.
  • As shown in this article, the increased leverage and reduced fees will likely result in higher earnings (and dividends) over the coming quarter even with lower yielding and ‘safer’ investments.
  • I consider GSBD to a higher quality BDC for the reasons mentioned in this article and I purchased shares near the recent lows.

You can read the full article at the following link:

Recently Reduced Asset Coverage Ratio:

On June 15, 2018, Goldman Sachs BDC (GSBD) held its 2018 Annual Meeting of Stockholders and shareholders overwhelmingly approved the application of the reduced asset coverage requirements as disclosed in the recent 8-K filing:

Proposal 3: By the vote shown below, the stockholders approved the application of the reduced asset coverage requirements in Section 61(a)(2) of the Investment Company Act of 1940, as amended, to the Company, which permits the Company to double the maximum amount of leverage that it is permitted to incur by reducing the asset coverage requirement applicable to the Company from 200% to 150%. Approval of Proposal 3 required a majority of the votes cast by all stockholders present, in person or by proxy, at the Annual Meeting.

Borrowings & Fitch Credit Rating

On June 28, 2018, GSBD announced that it had priced an offering of $40 million of 4.50% convertible notes due 2022. Also, the company recently upsized its revolving credit facility to $695 million and extended the maturity date to February 2023.

Source: GSBD Earnings Call Slides

On June 18, 2018, GSBD announced that Fitch Ratings (“Fitch”) has assigned the company an investment grade rating of BBB-; the rating outlook is stable.

“We are pleased to receive an investment grade rating from Fitch, which we believe reflects both the quality of GSBD’s investment portfolio and the strength of Goldman Sachs Asset Management’s (“GSAM’s”) platform. We are particularly gratified by Fitch’s acknowledgment of GSAM’s differentiated risk management and proprietary loan sourcing capabilities in its assessment.” said Brendan McGovern, CEO of the Company.

Reduced Fee Structure & Lower Risk Portfolio

Management has agreed to reduce its base management fee from 1.50% to 1.00% which would be among the lowest in the sector to help offset potentially lower yielding assets and/or increased borrowing expenses as discussed on the May 4, 2018 earnings call:

“the company’s investment advisor will reduce its base management fee from 1.5% of gross assets to 1% of gross assets beginning immediately following shareholder approval. In addition the Board and GSAM considered that borrowing cost may increase as additional leverage incurred while asset yields may decline as the company pursues lower risk first lien assets. In an effort to support the increased returns on equity, that are the objectives of the proposed increasing leverage, both the Board and GSAM believe reduction in the base management fee is appropriate.”

Also discussed, was the ability to invest in a higher amount of first-lien loans with lower risk:

“we believe that the added balance sheet flexibility will allow us to pursue increased returns on shareholder equity, while also allowing us to invest in lower risk, lower yielding loans. Based on our existing maximum permitted debt-to-equity ratio of just these lower risk, low yielding loans are currently dilutive to our targeted shareholder returns. We expect that over time, our asset mix will shift toward a higher percentage of first lien loans that may have lower yields, but which we believe also carry a lower risk. Finally a lower asset coverage requirement gives the company an enhanced ability to make distributions to shareholders that are required under tax regulations”

Increased Leverage & Dividend Coverage Potential

I have recently used this analysis for Medley Capital (MCC), Oaktree Specialty Lending (OCSL) and Prospect Capital Corp. (PSEC) in the following articles:

The following table shows six different scenarios with various amounts of leverage, using the current portfolio yield of 11.1% and a lower yield of 10.5%to determine the impacts on dividend coverage. Each of these scenarios assumes a full quarter of benefits from interest income but also a full quarter of interest expenses, incentive and 1.00% management fees. However, I have used conservative debt-to-equity ratios of 1.00 to 1.20 for the lower yield analysis compared to the potential 2.00 allowed with the reduced asset coverage ratio.

TCPC: I Recently Purchased This 10% Yielding BDC

Summary

  • TCPC is likely under-priced for the reasons discussed in this article, trading under book value, RSI of 38, and offering a well-supported 10% dividend yield.
  • The recent combination with BlackRock will create one of the strongest credit platforms in the sector with improved scale, relationships and analytics while retaining the current higher quality management team.
  • TCPC is well-positioned for rising interest rates and has already experienced higher portfolio yields and improved net interest margin driving higher dividend coverage in the coming quarters.
  • Earlier this year, there were insider purchases and if the stock continues lower, there will likely be additional accretive share repurchases.
  • I recently purchased additional shares of TCPC at a price of $14.22 before the March 2018 ex-dividend date and have already earned $0.72 per share in dividends (including $0.36 paid tomorrow).

You can read the full article at the following link:

Current BDC Dividend Yields

The average yield for business development companies (“BDCs”) is currently 10.1% which is near its average over the last six years as shown below. However, there are currently a handful of higher quality BDCs that typically have lower yields due to safer portfolios that are more likely to outperform during an economic slowdown, stable to growing book values, excellent dividend coverage and management that is willing to do the right thing including shareholder-friendly fee agreements.

For the reasons discussed in this article, TCP Capital (TCPC) is clearly a higher quality BDC that deserves to trade above book value with a yield that is usually much lower than the average. However, TCPC’s yield is now 10% which is near the average BDC and its historical highs implying that the stock is relatively under-priced.

I recently purchased additional shares of TCPC at a price of $14.22 before the March 2018 ex-dividend date as shown below and have already earned $0.72 per share in dividends (including $0.36 paid tomorrow). The Relative Strength Index or RSI is an indicator that I use after selecting a BDC that I would like to purchase, but waiting for a good entry point. Currently, TCPC has an RSI of 38 as shown below and in my BDC Google Sheets indicating that the stock is becoming ‘oversold’ or ‘undervalued’ as discussed below. However, it should be noted that there are currently quite a few BDCs with RSI’s below 40.

This is the definition of RSI from Investopedia:

“Traditional interpretation and usage of the RSI is that RSI values of 70 or above indicate that a security is becoming overbought or overvalued, and therefore may be primed for a trend reversal or corrective pullback in price. On the other side of RSI values, an RSI reading of 30 or below is commonly interpreted as indicating an oversold or undervalued condition that may signal a trend change or corrective price reversal to the upside.”

FSIC: 10% Yield And 18% Discount To Book Priced For Upcoming Credit Issues?

Summary

  • My primary concern is the amount of investments that “require close monitoring”, which has increased from 6% to 21% of the portfolio over the last two quarters.
  • FSIC is my smallest position, I will not be purchasing shares until after the company reports Q2 2018 results in August, looking for signs of maintaining its portfolio credit quality.
  • The company is trading at an 18% discount to NAV, and through May 9, it repurchased 3,324,358 shares at an average price of $7.52 (18% discount to NAV).
  • During Q1 2018, there was 1.5% decline in NAV due to a markdown in its first-lien position in Safariland and markdowns in equity positions in multiple investments.
  • There is the potential for special distributions if annual NII exceeds $0.76 per share for 2018.

You can read the full article at the following link:

Follow-Up on Reducing Asset Coverage Ratio:

As mentioned in my previous article discussing FSIC, “3 Largest Business Development Companies Take Steps To Increase Returns To Shareholders“, the company was previously seeking to reduce its asset coverage ratio but reconsidered after the S&P weighed in:

“On April 12, 2018, the board of directors (the “Board”) of FS Investment Corporation (the “Company”), as a result of new industry guidelines set forth by Standard & Poor’s on April 3, 2018, determined to no longer modify, beginning March 29, 2019 (one year from prior Board determination), the asset coverage requirement for senior securities applicable to the Company under Section 61(a)(2) of the Investment Company Act of 1940, as amended by the Small Business Credit Availability Act. As a result, the Company’s asset coverage requirement for senior securities remains and is expected to remain at 200% instead of 150%.”

(Source: SEC Filings)

FSIC Portfolio Credit Quality Update

As mentioned in previous articles, I sold 50% of my position in FSIC at around $10 in late 2016 due to the anticipated dividend cut that was announced in August 2017. FSIC is currently my smallest BDC position, and I will not be purchasing additional shares until after the company reports Q2 2018 results in August, as I will be looking for signs of maintaining its portfolio credit quality. One of my primary concerns is the number of investments that “require close monitoring” has increased from 6% to 21% of the portfolio over the past two quarters.

As shown below, FSIC stock price has declined significantly since 2016 likely due to the dividend cut and potential upcoming credit issues.

As mentioned earlier, I am concerned about the amount of investments that “require close monitoring” increasing from 6% to 21% of the portfolio over the last two quarters. Also, 1% of portfolio investments rated “5”, implying “underperforming investment with expected loss of interest and some principal.

(Source: FSIC Earnings Call Slides)

For the quarter ended March 31, 2018, net asset value (“NAV”) per share declined by around 1.5% due to a markdown in its first-lien position in Safariland LLC and markdowns in equity positions for JW Aluminum, PSAV Aluminum Co., Advanced Lighting Technologies, Safariland LLC, andMood Media.

“NAV per share declined from $9.30 per share as of December 31, 2017 to $9.16 per share as of March 31, 2018. Driven primarily by unrealized losses attributed to certain equity position and one loan position which we believe we will ultimately realize the full value of our investment.”

(Source: FSIC Earnings Call Transcript)

(Source: SEC Filings and BDC Buzz)


TPVG: 11.7% Yield Positioned For Rising Rates And Ready To Rally

Summary

  • I am expecting a rally for TPVG’s stock price as well as higher earnings for TPVG over the coming quarters for the reasons discussed in this article.
  • On June 21, shareholders will vote on the proposal to immediately become subject to a minimum asset coverage ratio of at least 150%, permitting the company to double its leverage.
  • BDCs will begin reporting calendar Q2 2018 results in less than two months and I’m expecting TPVG to beat projected EPS and easily cover its dividend.
  • I recently purchased shares of TPVG as it was below my ST target price. Also, I use the BDC Google Sheets to identify when stocks are “oversold” with an RSI near 30 (TPVG is currently approaching).

You can read the full article at the following link:

Current BDC Yields:

Business development companies (“BDCs”) were pulling back (since May 2017) and as mentioned in “BDC Buzz Begins Purchases Of Higher Quality BDCs,” I have been buying additional shares of higher-quality BDCs, especially given the oversold conditions driving higher yields. As shown below, TriplePoint Venture Growth (TPVG) currently has a much higher yield than the average BDC:

As shown in the following chart, I recently purchased shares of TPVG as it was below my short-term target price. Also, I use the BDC Google Sheets to identify when stocks are “oversold” with a Relative Strength Index or RSI near 30 which it is currently approaching:

This information discussing TPVG was previously made available to subscribers of Premium Reports, along with real-time changes to my personal BDC positions, target prices and buying points, updated rankings and risk profile, any changes to dividend coverage and worst-case scenarios, suggested BDC portfolio as well as timing of Upcoming Public BDC Articles.


PFLT: 8.3% Dividend Yield ‘Safe Enough For Your Grandma’ And Positioned For Rising Rates

Summary

  • PFLT continues to rally since my previous article and up almost 10% since March 1, 2018. I am expecting improved dividend coverage for the reason mentioned in this article.
  • PFLT’s portfolio yield continues to rise partially due to being invested in 100% floating rate assets driving higher earnings as shown in my Interest Rate Sensitivity Analysis.
  • Similar to other higher quality BDCs, PFLT’s management is focused on capital preservation and “underwriting as if we’re at the peak of the credit cycle”.
  • Management purchased additional shares at the recent lows and mentioned: “Our growing portfolio, increases in LIBOR, and the doubling of PSSL should provide a strong tailwind to growing our earnings stream”.
  • PFLT is trading under book value with first-lien senior secured investments at floating rates for investors that want solid returns without the typical amount of BDC-related risk.

You can read the full article at the following link:

Recent BDC Performance:

The stock price for PennantPark Floating Rate Capital (PFLT) has continued to rally since my previous article “First-Lien Portfolio Currently Paying A 9% Dividend Yield” discussing reasons to buy including rising portfolio yield and dividend coverage over the coming quarters.

As mentioned in previous articles, most business development company (“BDCs”) have outperformed the S&P 500 since March 1, even before taking into account dividends paid:


PFLT insiders were purchasing additional shares near the recent lows:

I am expecting BDCs to continue higher for many reasons, including the recently announced strong Q1 2018 results reported by most BDCs, with higher portfolio yields and management guidance for increased portfolio growth potential in 2018. Also, many BDCs reported higher-than-expected earnings and dividend coverage with increased net interest margins.

GSBD: 9.4% Dividend Yield Supported By First-Lien And Strong Covenants

You can read the full article at the following link:

Summary

  • 9.4% dividend yield is excellent for a BDC with protective covenants for 90% of the portfolio, 54% is first-lien, and non-accruals decreased to 0.0% due to the restructuring of Bolttech.
  • GSBD has been trading lower, the market is likely expecting an equity offering, as the company was at its targeted leverage and trading at a premium to NAV.
  • Previously, I reduced GSBD’s short-term target price due to lower dividend coverage over the last two quarters and for my revised 2018 projections.

Quick BDC Market Update

As discussed in previous articles, business development companies (“BDCs”) have been pulling back since May 2017. The following chart uses UBS ETRACS Wells Fargo Busn Dev Co ETN (BDCS) as a rough proxy for the average BDC, many of which are near new lows (including GSBD).

Obviously, lower BDC prices have driven higher overall dividend yields with the average BDC currently yielding 10.6% as shown below. However, it should be noted that I’m expecting dividend cuts for a few of the higher yield BDCs as discussed in my recently updated Dividend Coverage Levels report.